Research Article
Assessment of Genetic Variance, Heritability, Genetic Advance, Correlation and Cluster Analysis in Mutagens Induced Ten Variants of Brassica Campestris L. Toria
Gopal Krishna Shukla1* and Singh RR2
1Department of Botany, Kisan P. G. College, India
2Department of Botany, University of Lucknow, India
*Corresponding author: Dr. Gopal Krishna Shukla, Department of Botany, Kisan P. G. College, India, Email:
gkrishnashukla@rediffmail.com
Copyright: © Shukla GK, et al. 2021. This is an open access article distributed under the Creative Commons Attribution License,
which permits unrestricted use, distribution, and reproduction in any medium, provided the original work is properly cited.
Article Information: Submission: 24/10/2021; Accepted: 01/12/2021; Published: 06/12/2021
Abstract
The study was taken up to estimate genotypic and phenotypic variability, heritability with genetic advance, correlation and cluster analysis on growth
and yield parameters in 10 variants of variety T-9 of Brassica Campestris (toria). These variants were obtained through mutagenesis. Analysis of variance
reveals that there are highly significant differences among all the traits studied. Comprehensively, phenotypic coefficients of variance were higher than their
respective genotypic coefficients of variance for all the traits. High GCV was observed for pods plant-1, beak length and seed yield plant-1 while highest PCV
was exhibited for secondary branches plant-1. Broad sense heritability ranged from lowest 16.41 for secondary branches per plant to highest 72.35 for plant
height. Pods plant-1, plant height, beak length, pod length and seed yield plant-1 showed high genetic advance over mean percent. The results of correlation
revealed that seed yield plant-1 exhibited highly significant positive association with stem perimeter, secondary branches, pods on main raceme, pod plant-1
and 100 seed weight, although significant negative correlation with beak length. The traits which showed positive correlation with seed yield were the main
contributor towards high seed yield plant-1. All genotypes were grouped into two clusters at 3% linkage. The cluster I comprising variants with maximum
mean value for plant height, raceme length, pod length whereas cluster II genotypes showed high mean value for pod plant-1, 100 seed weight and seed
yield plant-1.The result of genetic divergence in variants shows that it is helpful in the selection of superior yield attributes in breeding program of oilseed
Brassicas.
Keywords
Brassica Campestris; Mutagenesis; Genetic variance; Heritability
Introduction
The oleiferous Brassica spp. commonly known as rapeseed/
mustard is one of the economically important agricultural
commodities. Rapeseed/ mustard is being grown throughout the
world as a source of oil and protein for human/animal consumption
[1]. In India, rapeseed/mustard plays an important role in the
economy by providing edible oil, vegetables, condiments and animal
feed.
The three ecotypes of Indian rape, B.(2n=BB=20)
viz.,toria, brown sarson (lotni and tora types) and yellow sarson [2]. Brassica Campestris is relatively young species of Asiatic origin [3]. The
primary centre of origin of Brassica Campestris is near the Himalayan
region and history suggested that rapeseed was cultivated as early as
two centuries B.C. in India and introduced in China and Japan at
the time of Christ [4]. The rapeseed oil contains lowest amount of
saturated fatty acids as compared to other vegetable oils. It contains
nutritionally desired oleic acid, which gives stability to the oil, along
with two essential fatty acids, linoleic acid and linolenic acid, which
are not present in many of the other edible oils. Many nutritionists
suggested that this composition of fatty acids in oil is considered
as ideal for human nutrition and superior than that of many other
vegetable oils [5]. In present scenario, India has been importing edible oil to meet household requirements. The increasing population
may affect the supply-demand gap which can eventually increase
the importation of edible oils. Hence the oilseed production needs
a substantial boost to meet the demands in our country. Therefore
developing genotypes with diverse and desirable characteristics will
be of great value. Such improvement program in oilseed Brassica will
help in the enhancement of yield and nutritional qualities.
Mutagenesis has come up with a hope as an efficient tool for
creating genetic variability in various crops. Plant breeders are
also employing this method in rapeseed/ mustard. Development
of desirable genotypes requires excellent knowledge of the existing
genetic variation for yield and its components. The magnitude of
heritable variation in the traits has immense value for designing the
breeding programme for potential genotype. Thus assessment of
genetic parameters such as PCV (Phenotypic coefficient of variation),
GCV ( Genotypic coefficient of variation ), Heritability and Genetic
advancement is prerequisite for devising effective selection [6]. The
phenotypic values of different traits in the same individual are often
found to be correlated and may be useful for indirect selection [7].
Cluster analysis reveals existence of genetic variability in different
genotypes. With the consideration of above facts, the present study
emphasizes the nature and extent of variability present in mutagens
induced 10 variants (namely TV1,TV2,TV3,TV4,TV5,TV6,TV7,TV
8,TV9 and TV10) and control plant (TV0) of Brassica Campestris.
Materials and Methods
The present work focused on mutation induction followed by
selection of genetic variability in Brassica Campestris cultivar T-9 .
The seeds were obtained from U.P. State Seed Corporation, Lucknow,
India. In order to induce genetic variability artificial mutagenesis
has been carried out by using physical mutagen (Gamma rays)
and chemical mutagen (Ethyl Methane Sulphonate). For physical
mutagenesis, three lots of seeds were subjected to 25, 35 and 45
Krad doses of gamma irradiation at room temperature at National
Botanical Research Institute, Lucknow. The source of gamma rays
was 60CO.
In chemical mutagenesis, the seeds of cultivar T-9 (four lots of
each) were pre-soaked for 4 hrs in distilled water and then treated
with different concentrations(0.3%, 0.6 % and 0.9%) of EMS solution
prepared in phosphate buffer at pH 7.0 for 6 hrs at 30±1°C reaction
temperature. The treated seeds of both the varieties along with their
respective control were sown at the Lucknow University experimental
field in Randomized Block Design (RBD) to rise the M1 generation in
three replicates. Seeds were hand dibbled approximately an inch deep
with the spacing of 10- 12 cm between them in a well loosened and
watered soil. The rows were kept at a distance of about 30 cm with plants
at a spacing of 15 cm in each row. Based on visual observations, few
morpho-variants were isolated from M1 and M2 generation. Progeny
row of the isolated variants were raised in M3 generation to confirm
the stability of altered characters. Five competitive plants from each
row of all the variants were selected randomly for recording the data
on 12 characters viz. plant height (cm), stem perimeter, number of
primary branches per plant, number of secondary branches per plant,
length of main raceme (cm), number of pods on main raceme, pod
length (cm), beak length (cm), pods per plant, number of seeds per
pod, 100-seed weight (g) and seed yield per plant (g). Data obtained
from M3 generation were statistically analyzed by using SPSS software.
The mean data was subjected to analysis of variance. The Phenotypic
Coefficient of Variation (PCV), Genotypic Coefficient of Variation
(GCV) and heritability in broad sense were calculated using the
formula suggested by Burten and Devane [7]. Genetic advance was
calculated by the method suggested by Johansson [8].
Results
To assess the extent of genetic variability and divergence in the
variants of T-9, the statistical analysis was done on 12 quantitative
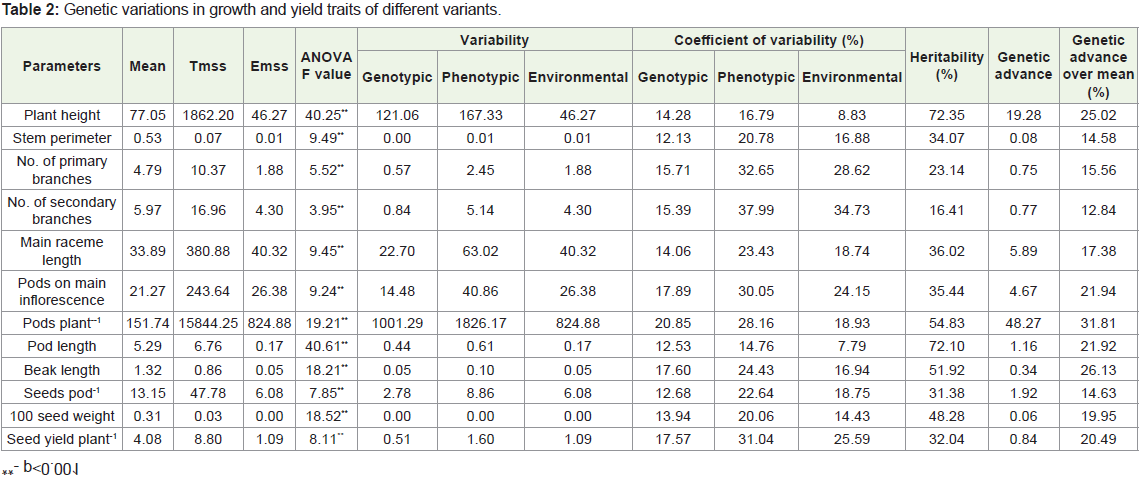
phenotypic traits. To compare the variation among the variants, mean
value, analysis of variance, Genotypic and Phenotypic coefficient of
variability, heritability, genetic advance and genetic advance over
percent mean are given in Table 1 and Table 2.
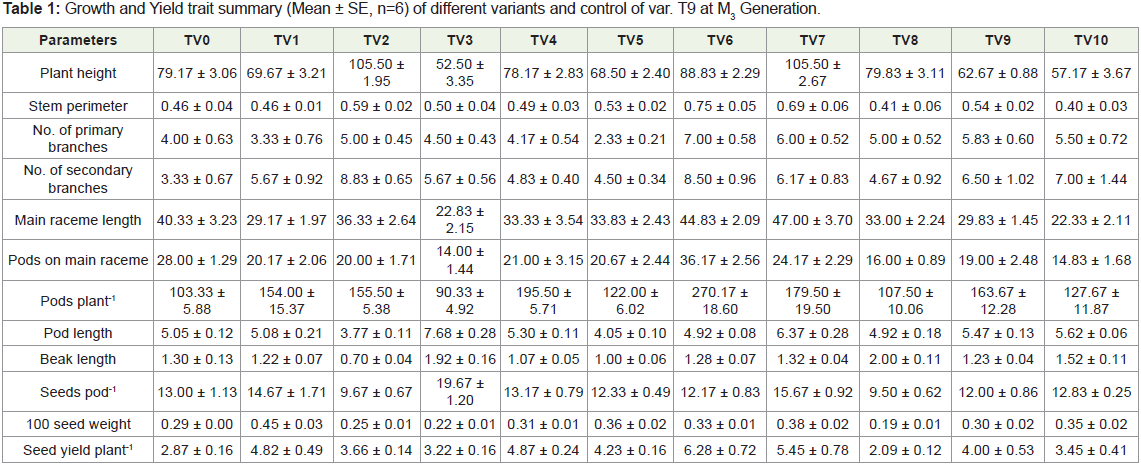
Plant height is an important yield contributing character. The
mean value reveals that variants TV3 (52.50±3.35, 3.22±0.16), TV9 (62.67±0.88, 4.00±0.53) and TV10 (57.17±3.67, 3.45±0.41) were
not only dwarf in stature but also had higher yield as compared
with their control (79.17±3.06,3.45±0.41). The variant TV6 showed
increase in the number of branches, pods on main raceme and also
had maximum pods plant-1. Variants TV3, TV7 showed significant
increase in pod length and also seeds pod-1. Most of the variants
viz., TV1, TV3, TV7 exhibited higher 100 seed weight than their
parent. Barring TV8, all the variants produced higher seed yield
plant-1. However, TV6 (6.28±0.72), TV7 (5.45±0.78) were superior
to the parent variety in terms of seed yield plant-1. The analysis of
variance among the genotypes (parent and variants) showed highly
significant (p< 0.001) difference for all the traits (Table 2). Genotypic
and phenotypic variances were highest for pods plant-1 (1001.29
and 1826.17) and lowest for beak length. The highest Phenotypic
coefficient of variation was recorded for secondary branches(37.99%)
followed by primary branches (32.65%) and seed yield plant-1(31.04
%) whereas maximum Genotypic coefficient of variation were
observed for pods plant-1 (20.85%) followed by pods on main raceme
(17.89%) and beak length (17.60%). The lowest PCV for pod length
(14.76%) and stem perimeter (12.13%) were observed. The result indicates that phenotypic coefficient of variance was higher than their
respective genotypic coefficient of variation for all the traits studied.
The GCV was higher than their respective environmental coefficient
of variability for all traits except for plant height, pods plant-1, pod
length and beak length. The heritability (%) estimates revealed
highest value for plant height (72.35%) followed by pods length
(72.10 %), pods plant-1 (54.83 %), beak length (51.92%), moderate for
100 seed weight (48.28%), main raceme length, pods on main raceme,
pods plant-1, seeds pod-1, number of primary branches plant-1 and
seed yield plant-1 whereas lowest heritability (%) was recorded for
secondary branches plant-1 (16.41%).
The genetic advance over control mean (%) was ranged from
12.84% for secondary branches to 31.81% for pods plant-1. Among
the traits, plant height, pods on main raceme, pod length, beak length,
seed yield plant-1 and 100 seed weight showed high percentage of
genetic advance over mean. Relatively high heritability and genetic
advance were observed for plant height. Secondary branches plant-1
showed low heritability and genetic advancement.
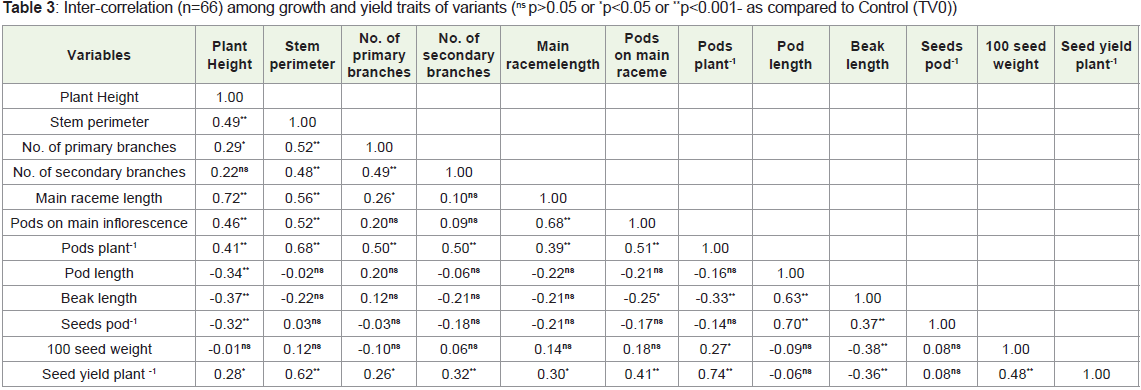
The results of correlation analysis among the traits of var.T-9 variants in M3 generation were shown in Table 3. All the traits showed
highly significant positive association with seed yield plant-1 except
number of seeds pod-1. Seed yield plant-1 exhibited significant negative
correlation with beak length. Plant height had highly significant
(p<0.001) positive correlation with main raceme length, pods on main
raceme while significant (p< 0.05) with seed yield plant-1. However,
it showed highly significant (p<0.001) but negative association with
pod length, beak length, seeds pod-1. The stem perimeter had high
significant and positive relation with all traits except pods length,
beak length. The primary branches plant-1 exhibit highly significant
association with pods plant-1, the secondary branches with pods plant-1
and seed yield plant-1, main raceme length with pods main raceme-1
and pod plant-1, pods raceme-1 with pod plant-1and seed yield plant-1.
The relationship of pods plant-1 was highly significant (p<0.001)
and negative with beak length while positive with seed yield plant-1.
Pod length was correlated with beak length. Beak length showed
significant and positive correlation with seeds pod-1 while significant
negative association with 100 seed weight and seed yield plant-1. 100
seed weight showed highly significant positive association with seed
yield plant-1. The positive correlation between pods plant-1 and seed
yield plant-1 indicate the possibility of cumulative improvement in the
yield attributes in rapeseed.
Cluster Analysis
Cluster analysis used to assess diversity among the genotypes.
The ten variants (TV1- TV10) and one control (TV0) from cultivar
T-9 were clustered on the basis of 12 quantitative traits recorded. The
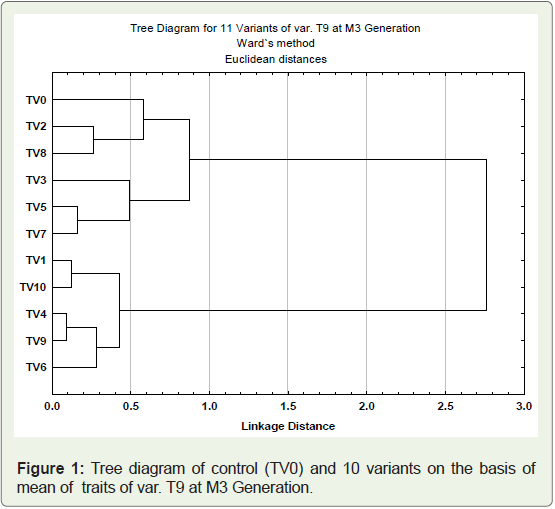
phylogenetic relationship among the variants and parent genotypes
were presented in dendrogram (Figure 1). The genotypes grouped
into two major clusters, cluster I possess six genotypes (parent and 5
variants) and cluster II confined five variant genotypes. The clustering
pattern of genotypes in dendrogram revealed the dissimilarities
between the clusters as well as within the cluster The genotypes
with maximum mean values for various traits such as plant height,
secondary branches, main raceme length, pod length, beak length, seeds pod-1 were placed together in cluster I whereas genotypes of
cluster II, showed maximum mean value for number of primary
branches, pod main raceme-1, pods plant-1, 100 seed weight and seed
yield plant-1. In cluster I, minimum linkage distance (0.2%) exists
between TV5 and TV7, followed by TV2 and TV8 (0.3%). Variant
named TV3 exists in separate sub cluster and showed maximum
linkage distance (0.5%). In cluster II, minimum linkage distance
(about 0.1%) present between TV4 and TV9, followed by TV1 and
TV10 (0.2%). Variant TV6 which showed maximum seed yield plant-1
was found to be most mutated with respect to their parent and placed
in separate sub cluster with linkage distance 0.3%. It was significant
to note that parent variety formed an independent sub cluster which
showed that the considerable genetic variations were created in
the quantitative phenotypic traits of the cultivar due to mutagenic
treatment.
Discussion
The assessment of genetic diversity plays major role in creating a
pool of variable germplasm, selection of superior genotypes from the
pool and utilization of selected individuals to create desired variability
[9]. The present study is carried out for the evaluation and selection
of improved variant genotypes obtained through mutagenesis. Plant
height is an important morpho- metric character. The variants of
T-9 viz. TV3, TV9 and TV10 were dwarf in stature and had higher
yield as compared with their respective parent. This confirms that
induced mutation played a significant role in the alteration of plant
architecture and effective selection of mutants will enhance yield
potential in rapeseed and mustard [10]. The variant TV6 showed
increase in the number of branches, pods on main raceme and highest
number of pods plant-1. Increase in pods plant-1 can be attributed to
increased number of branches. Genotypes with more branches and
pods plant-1 had been reported in oilseed Brassica as a consequence
of mutagenesis [11]. It was found that the number of pods plant-1
majorly responsive for all yield contributing components in canola
and was an important factor for yield compensation[12]. Variants
TV3, TV7 showed significant increase in pod length and seeds pod-1. Super long siliqua line also reported in B. napus [13]. However,
Mendham have argued that canola breeders should aim to produce
plant with fewer pods but with a higher number of seeds pod-1 to
maximise the seed survival [14]. Long pods had more seeds resulting
in a greater seed yield plant-1 [15]. All these results showed that longer
pod could provide a better environment for a higher proportion
of ovule surviving in mature seed. 100 seed weight of most of the
variants was higher than their parent which indicates an increase in
size of the seeds as a result of mutation. This is in conformity with
[11] who have reported the bold seed mutants in Brassica. All the
variants except TV8 produced higher seed yield plant-1. This might
be due to increase in yield contributing factors. The consistent
performance of these variants in all three generations indicated an
improvement in genetic constitution through gamma irradiation and
EMS induced mutations. These results are in consonance with earlier
reports [16,17].
The variance analysis showed that the genotypes differed
significantly among themselves for all the traits. Genotypic and
Phenotypic coefficient of variations had similar trend for all the traits. PCV although higher than GCV for all the traits indicating that had
interaction with environment to some degree [18]. The GCV provides
a mean to study the genetic variability generated in quantitative traits.
Pods plant-1 recorded comparatively higher GCV followed by pods
on main raceme and seed yield plant-1 which is in relation with the
findings of [19]. The estimate of heritability with genetic gain was
more useful than variability value along with predicting the resultant
effect of best individual [8]. In this study, higher and moderate
estimate of heritability observed for most of the traits whereas
lowest heritability (16.41%) was recorded for secondary branches.
High heritability for pods plant-1 is supported by the earlier findings
in Mustard [20]. Akbar et al., [21] also found high heritability for
plant height, pods plant-1 and seed yield plant-1. This suggested that
the variation due to environment played a selectively limited role
in influencing the inheritance of these characters. Among the traits,
four traits namely pods plant-1, plant height, pod length, seed pod-1
showed high heritability and genetic advance as mean percent. Our
results are further strengthened by the earlier reports in Brassica
juncea [22]. A trait with high heritability and genetic advance is to be
considered under control of additive genes and selection is effective
for such traits [23].
The correlation coefficient generally highlights the pattern of
association among yield and growth attributes which characterize
how yield, a complex character is expressed. Inter correlation among
yield and growth parameters of all variants showed that the seed yield
had highly significant and positive correlation with pods plant-1,
stem perimeter, pods on main raceme, secondary branches and plant
height while negatively associated with pod length and beak length
as compared with control. These results were in conformity with
the earlier findings [24]. Positive contribution of plant height, stem
perimeter, number of branches plant-1 and 100 seed weight for seed
yield plant-1 noted in the present study was also mentioned by [25]. In
this study negative correlation between beak length, pod length and
seed yield plant-1 was found that also been reported [26]. The negative
correlation of beak length with seed yield plant-1 indicated that long
beak length genotypes have less seed yield. The correlation study
among the traits reveals that, these aforesaid attributes were main
contributors towards the enhanced seed yield plant-1.
Cluster analysis signifies the extent of genetic diversity and that
is of much use in plant breeding [27]. Genetic similarity among
different genotypes using Euclidean distance cluster analysis based on
12 traits grouped in to 2 clusters at 3% linkage (Figure 1). The cluster
I consist of six genotypes (variants and parent variety) and others
formed cluster II. On the basis of morphological traits, Kumar et
al.,[16] reported the formation of 3 clusters of Brassica rapa mutants.
The present study indicates that phenotypically similar variants need
not have closer relationships. The variants TV1, TV4, TV9 and TV6
of T-9 differed significantly among them but fall in same cluster.
However [28,29] reported the mutants with similar morphological
traits fall in to the same cluster. The most distinct cluster with respect
of parental cluster could be used for mutant selection in subsequent
generations. Our study is favoured by the result of correlation and
also represents that the traits showed positive association can be
improved simultaneously and put together in a single genotype for
yield enhancement.
Conclusion
From the above study, it can conclude that mutagenesis played a
pivotal role in oilseed Brassica crop breeding. The genetic divergence
study of the variant genotypes provides a clue that mutation in
positive direction can successfully employ for the induction of
variation. Assessment of genetic variability and inter-relationships
among agronomic traits helps to select new genotypes with improved
characters.
References
Citation
Shukla GK, Singh RR. Assessment of Genetic Variance, Heritability, Genetic Advance, Correlation and Cluster Analysis in Mutagens Induced
Ten Variants of Brassica Campestris L. Toria. J Plant Sci Res. 2021;8(2): 214