Research Article
Species Diversity and Dominance Pattern in a Temperate Grassland of Kashmir Himalaya
Ganaie MM1 and Reshi ZA2
1Department of Botany Govt. Degree College Tral, J&K, India
2Department of Botany University of Kashmir Srinagar, J&K, India
*Corresponding author:: Ganaie MM, Department of Botany Govt. Degree College Tral, J&K, India, Email:
masoodmg@gmail.com
Copyright: © Ganaie MM, et al. 2021. This is an open access article distributed under the Creative Commons Attribution License,
which permits unrestricted use, distribution, and reproduction in any medium, provided the original work is properly cited.
Article Information: Submission: 13/05/2021; Accepted: 03/07/2021; Published: 13/07/2021
Abstract
Species richness, evenness, species diversity and concentration of dominance, computed on the basis of density of constituent species during months
and seasons, were used to study the community organization of protected temperate grassland in Kashmir Himalaya. The vegetation showed a strong
seasonal pattern reflected by high species richness and diversity during favourable seasons and low during unfavourable season. The species diversity
revealed an inverse relationship with concentration of dominance. The relative species, abundance pattern confirmed to log-normal pattern indicative of a
heterogeneous assemblage of species with relative abundance distribution governed by many independent factors.
Keywords
Species richness; Evenness; Species diversity; Relative abundance distribution; Dominance
Introduction
Species diversity is an important structural attribute of a natural
community and there is increasing evidence from experimental
studies that plant diversity can influence a variety of ecosystem
functions [1,2] particularly productivity [3] and stability [4-10].
Although species diversity in strict sense is the number of species
(richness) in a community, it also includes relative abundance pattern
of the species which also has been shown to have marked influence
on the structure and function of the community [11] and as such a
number of attempts have been made to explain the species abundance
and distribution pattern of both real and idealized communities [12-14]. For plants the most common view is that both abundance and
distribution reflect species’ relationships to resource availability
(Mitchley and Grubb, 1986 and Mitchley, 1988) [15,16] but lately it
has been shown that the ‘mobile’ dispersal phase also plays a role in
determining species abundance pattern [17].
In view of the importance of such studies, a number of
investigations have been conducted particularly on central Himalaya grasslands [18-22] to quantitatively analyse their community structure
and function, but the temperate grasslands of Kashmir Himalaya are
yet to be investigated hence the present study.
Study Area
The present studies were carried out on a grassland with flat
topography located in Srinagar district, lying at an altitude of 1576
m, above mean sea level and protected from any biotic disturbance
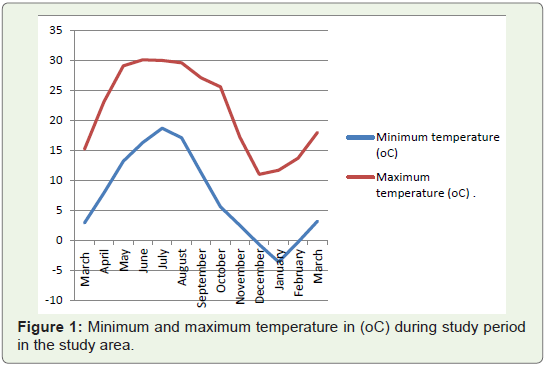
for last five years. The climate of the study area was temperate with
four distinct seasons viz. spring (March-May), summer (June-
August), autumn (September-November) and winter (December-
February). During the study period (March to next March) maximum
temperature of about 30.1o C was recorded during summer while a
minimum of about -3.6o C was recorded during winter (Figure 1).
Annual precipitation of 345.9 mm during the study period was less
than the annual average precipitation of 6.14.75 mm.
Materials and Methods
Twenty quadrats of 0.5 m2 size were randomly laid each month during the study period to record the number of individuals of each
species and the density of constituent species was calculated after
Curtis and Cottom (1965). In case of runners each node was taken
equivalent to an individual and in respect of other rhizomatous
species each upright shoot was considered as an individual [23]. The
diversity indices, evenness, concentration of dominance and species
abundance pattern was determined on the basis of density using
following formulae:
a) Diversity indices after [24]
N0 = Total number of species present
N1 = exp(Ĥ)
N2 = Reciprocal of Simpson’s index
N0 = Total number of species present
b) Shannon-Wiener’s index of general diversity after Shannon
and Wiener (1949) [25]
Ĥ = -Ʃpilnpi
where pi is the proportion of the total number of individuals
belonging to ith species
Ĥmax = log2S
where S is the total number of species
c)Equitibility or evenness indices
E1 = Ĥ/Ĥmax
E2 = (N2 -1)/(N1-1)/[26]
d) Concentration of dominance was by Simpson’s (1949) [27]
formula
C = Ʃ(Pi)2
where Ĥ, Ĥmax, N1, N2 and pi are same as defined earlier.
Relationship between various attributes was studied through
correlation and regression analysis.
Observations
The effective number of species (N0) revealed a very characteristic pattern of high species richness in month of March with consistent
decline in intervening months. Lowest number of species [12] was
recorded during January. The species richness, computed on the basis
of abundant species (N1), was highest during March 2020 but also
recorded increase during June and November (Table 1). Richness on
the basis of very abundant species (N2) exhibited bimodal pattern
with one peak in June and other in March 2021. Irrespective of index
of species richness, lowest value was recorded in January.
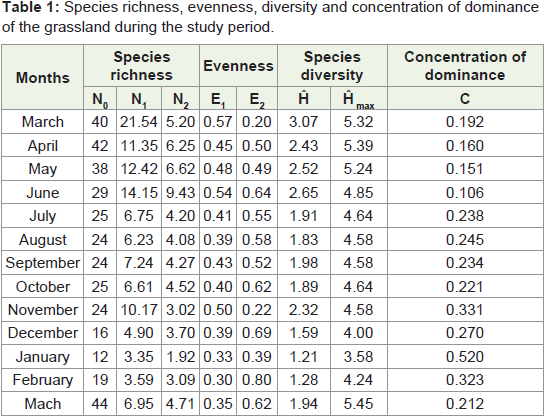
Evenness or Equitability
The evenness index (E1) revealed three peaks in months of
March 2019, June and November (Table 1). Evenness revealed an
entirely different pattern (E2) when worked after [26]. Data reveals
a low evenness value during March 2020 followed by an increase till
October but during November it recorded a sharp decline and in the
succeeding months a more or less regular pattern of increase and
decrease was observed with highest value observed during February.
Species diversity:
Ĥmax (Table 1) shows a more or less a uniform trend up to
November followed by a decline with lowest value recorded in
January. A sharp increase, however, was recorded after January
with Ĥmaxregistering a peak value in March 2021. Species diversity
computed on the basis of Shannon-Weiner information (Ĥ) also
reveals a similar pattern of lowest value during January and highest
during March.Concentration dominance:
The dominance index (C) revealed a more or less uniform pattern
up to December followed by a sharp increase attaining a peak value
in January, though marginal decrease was recorded during June. A
consistent decline, however, was recorded after January.Discussion
The species richness in the present grassland reflects a seasonal
pattern of maximum species richness during spring and minimum
during winter. Such a seasonal pattern is indicative of the involvement
of climatic variables chiefly precipitation and temperature pattern.
The maximum species occurrence during spring could be attributed to the prevalence of favourable climatic conditions while the very cold
climatic conditions during winter may be responsible for low species
richness. Analysis of the relationship between species richness (N0)
and the climatic variables revealed that precipitation pattern had a
significant influence on it explaining about 37% variability in species
variability in species richness and the two were related according to
the following equation:
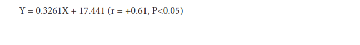
However, temperature and species richness (N0) showed an
insignificant positive correlation (r = +0.27). In addition to climatic
variables, changes in species composition have been attributed
to plant phenology [28], germination attributes [29-31] cycling
and availability of mineral nutrients, especially nitrogen [32-36]
photosynthetic strategy [37] and edaphic conditions [38]. Thus, the
seasonality in the species richness observed in the grassland during
the present study could be attributed to intrinsic species-specific
characteristics and a variety of biotic factors, besides climatic factors
particularly precipitation pattern.
Evenness, a measure of how similar are the abundances of
different species [39,40], has been related to a number of factors like
strong current completion [41], soil fertility [42] and succession [43-46]. A low value of evenness indicates that one or a few species are
highly dominant, while as a high value of evenness indicates that
all the species in the community have rather similar abundance. In
the present study, indices of evenness, in general, reveal high values
during favourable seasons of spring, summer and autumn but low
during unfavourable winter season suggestive of dominance of cold
tolerant species during winter while a more or less similar abundance
of constituent species during other seasons.
Diversity index, based on Shannon-Wienner information, further
strengthens our earlier conclusion of strong seasonal influence on
the community organization as the grassland under study was more
diverse when favourable climatic conditions prevailed and least
diverse during winter when climatic conditions were unfavourable.
Furthermore, diversity index showed a negative relationship with
concentration of dominance (Figure 2). The negative relationship is
presumably due to richness in species composition of the community
leading to distribution of importance value among many species,
rather than in few species. Such negative relationship has been
reported by [46-49] Increase in plant species richness has shown to increase above-ground biomass production [50-54] in experimental
assemblages of grassland species, where species richness and
functional composition were controlled through such a trend has not
been observed in semi-natural grasslands [55,56]. In the present study
also species diversity (log2S) and aboveground productivity did not
reveal any significant positive relationship (r = +0.429) and species
diversity explained only 18.44% of the variation in aboveground
biomass.
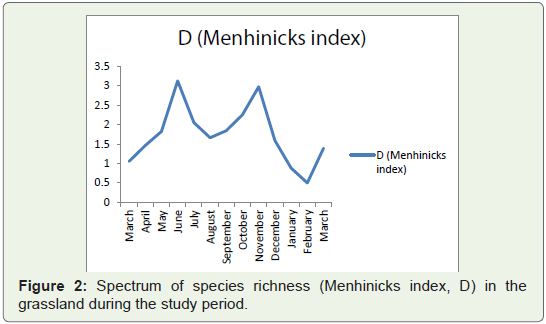
The relative abundance pattern of species was used to interpret
the nature and organization of the grassland community has been by
[57,58,59]. The species – abundance curve (Figure 2) approached by
the grassland under study, drawn by plotting log abundance (measured
as density) and ranked from the most to the least abundant species,
conforms neither to broken stick model nor to niche pre- emption
model but conforms to log-normal relationship that indicates
large and heterogeneous assemblage of species where abundance
distribution pattern is governed by,many more or less independent
factors [60] has further suggested that log-normal species abundance
curve is reflective of communities in stable environments [61-64] and
thus similar conclusions can be drawn for the grassland under study.
Climatic condition particularly temperature and precipitation
have a positive effect on the species richness as indicated in the present
study. High values of species richness during favourable seasons
(with good temperature conditions) and low ones in unfavourable
winter period indicates dominance of cold tolerant species during
winter while a similar abundance of constituent species during
other seasons. In the present study no significant relationship was
found between species diversity and aboveground productivity.
Shannon-Wienner diversity index in the present study showed a
negative relationship with concentration of dominance. This seems
due to richness in species composition of the community leading to
distribution of importance value among many species, rather than
in few species. The relative abundance pattern values of species in
the present study indicates large and heterogeneous assemblage of
species where abundance distribution pattern is governed bymany
more or less independent factors. The values also indicate stability of
the plant community under study.
References
4. Tilman D, Downing JA (1994) Biodiversity and stability in grasslands. Nature (London) 367: 363-365.
Citation
MM, Reshi ZA. Species Diversity and Dominance Pattern in a Temperate Grassland of Kashmir Himalaya. J Plant Sci Res. 2021;8(2):
211