Research Article
Protocol Establishment-As Well Defined Rule a and Step for Extreme Good DNA Extraction, Qualification, Quantification and Amplification Efficiency from Leaves and Fruit Peel of Phyllanthus Emblica, Tamarindus Indica, Cambopogon Citrates, Borhevia Diffusa and Bryophyllum Pinnatum- Containing Sour Taste
Ladani MR and Parabia FMM*
Ashok and Rita Patel Institute of Integrated Biotechnology & Allied Sciences, New Vallabhvidyanaga-388120
*Corresponding author: Parabia FM, Ashok and Rita Patel Institute of Integrated Biotechnology & Allied Sciences,
New Vallabhvidyanaga-388120 Gujarat, India; Tel: 9879578029; Email: farzin_parabia@yahoo.co.in
Copyright: © Ladani MR, et al. 2021. This is an open access article distributed under the Creative Commons Attribution License,
which permits unrestricted use, distribution, and reproduction in any medium, provided the original work is properly cited.
Article Information: Submission: 09/06/2021; Accepted: 08/07/2021; Published: 10/07/2021
Abstract
DNA extraction from plant is crucial step in molecular genetics and for this CTAB protocol is developed which is cationic detergent and CTAB can’t
be denatured at higher temperature 60ºC to 65 ºC that is one of the advantage of using CTAB in plant DNA extraction. Due to presence of complex
polysaccharides like polyglycosides and other secondary metabolites like tannins, alkaloids and polypheols in plant tissues it is difficult to quantify and qualify
pure plant DNA though they are also precipitated with isolated plant DNA. Therefore day by day certain modifications are carried out in CTAB protocol
depending upon polysaccharide and other polyphenol composition of individual plant tissue material. Present study explains standardization procedure for
quantification and qualification of DNA from leaves of Phyllanthus emblica, Tamarindus indica, Cambopogon citrates, Borhevia diffusa and Bryophyllum
pinnatum. Leaf tissues of these plants contain high amount of polyphenols, secondary metabolites like tannins, flavanoids and alkaloids and complex
polysaccharides like polyglycosides and more or less amount of Ascorbic acid and citric acid. DNA extraction from Ascorbic acid or Vitamin C rich tissues is
bit difficult due to its lower pH that leads to degradation of DNA. So to deal this issue we standardize one small protocol that don’t need use of Rnase enzyme
and liquid nitrogen but require frequent pH monitoring during incubation step. DNA isolated from this plant by this protocol is of good quality and quantity and
are effective enough to amplify in multiple copies.
Keywords
Phyllanthus Emblica; Tamarindus Indica; Cambopogon Citrates; Borhevia Diffusa; Bryophyllum pinnatum
Introduction
Isolation of good quality of DNA is an important step for study of
molecular genetics of an organism. A hike came in the development
of CTAB protocol for DNA extraction in plants [1]. CTAB is cationic detergent and is adaptable in high salt concentration in plant material.
It disrupts cell membrane and release the DNA. Alternatively plant
tissues are rich in complex polysaccharides like polyglycosides and
secondary metabolites like polyphenols, alkaloids, tannins etc. These
metabolites co-precipitate with DNA and cause interference during isolation procedure. The presence of these compounds shows the
difficulty due to long and time-consuming extraction procedures
those do not give good quality and quantity of DNA.
There are number of protocols developed for isolation and
purification of DNA from polyphenols, polysaccharides and
secondary metabolites rich plant materials but degradation of DNA is
one of the major problems in some plant species containing low pH in
their leaf tissues which generates inaccurate bands or no amplification
of DNA in PCR based studies. There are many problems came across
while isolating high molecular weight DNA from several plant
species which has been accounted for the degradation of DNA due
to endonuclease activity, co-isolation of viscous polysaccharides and
presence of certain inhibitor compounds with directly or indirectly
hinders enzymetic reactions [2]. Polyphenols are powerful oxidizing
agents that reduce the quality and yield of DNA [3].
Lot many protocols have been developed to isolate high quality
DNA from numerous plant species [4-9]. Degradation of DNA
was reported as the major problem during isolation [10]. But the
problem regarding good quality of DNA remains as it is. Earlier an
efficient protocol was developed for isolation of good quality of DNA
from leaves of Phyllanthus emblica without degradation of DNA by
stabilizing pH at different steps of isolation. But still quality was the
problem. More additionally this DNA was used for other downstream
applications like DNA fingerprinting and chloroplast genome analysis
from different germplasm of Phyllanthus emblica [11].
In the present study we established modified easiest and
quick protocol for isolation of good quality and quantity of DNA
from the leaves of Phyllanthus emblica, Tamarindus indica and
Cambopogoncitrates which contains more or less amount of ascorbic
acid in their leaf tissue them gives them sour taste. Leaves of
T.indicacontain highest amount of vitamin C compared to any other
plant species without the use of Phenol, liquid nitrogen and other
enzymes like Rnase and protenase K. The isolated DNA was also PCR
amplified by chloroplast gene.
Materials and Methods
Materials:
Leaves fruits samples of Phyllanthus emblica and leaves of
Tamarindus indica and Cambopogon citrates were collected from the
botanical garden of Anand Agriculture University, Gujarat and Store
at -20⁰C before using.Preparation of collected sample:
Fresh leaves were collected and then after washed properly with
sterilized distilled water, properly air dried at room temperature and
then quickly stored at avoid -20⁰C to avoid nuclease contamination.Genomic DNA Isolation:
Total genomic DNA was extracted by means of certain
modifications in CTAB protocol.Preparation of Reagents:
1.CTAB extraction buffer:
20mM EDTA, 100mM Tris-HCl, 1.14M NaCl, 3%w/v CTAB, pH 8.0
2.0.1N NaOH
3.0.2% β-mercaptoethanol
4.0.1%w/v PVP
0.1gram PVP dissolved in 100ml of Distilled water.
5.Chloroform: isoamylalcohol (24:1)
48ml of chloroform and 2ml of isoamylalcohol mixed properly in
50 ml of distilled water make final volume of 100ml.
6.5M potassium acetate
7.3M sodium acetatev
8.Ice cold Isopropanol 9.1x TE buffer:
9. 10mMTris-HCL, 1mM EDTA(pH 8.0m).
10. 10xTBE stock buffer(100ml)
10.8gram tris base, 5.5gram boric acid and 4ml of 0.5M EDTA
and make final volume of 100ml by distilled water.
11. 1x TBE buffer(100ml)
Add 10ml of 10x TBE buffer in 90 ml of distilled water to make
final volume of 100ml.
12. Ethyl Bromide Dye (EtBr) stock
5μgms are dissolved in 1ml of distilled water.
13. 0.7% Agarose
0.7grams of agarose powder dissolved in 100ml of distilled water.
14. 1x TE bubber:
10mMTris-HCL, 1mM EDTA(pH 8.0m)Protocol
0.2 gram of leaves were cut into small pieces and ground
thoroughly into prechilled mortle and pestle without the use of liquid
nitrogen under extraction buffer.β-mercatopethanol and PVP were
added during the process of grinding.
Tubes were incubated at 65⁰C for 30-35 minutes. pH was
measured during 5-10 minutes interval and adjusted with the help of
0.1N NaOH with gentle mixing of samples with regular time intervals.
Then tubes were centrifuged at 8000rpm for 10 minutes at room
temperature. Supernatant was collected in a new tube and 250μl of
5M potassium acetate was added. Tubes were incubated at -20C for
1hr. Then tubes were centrifuged at 8000rpm for 10 minutes at room
temperature.
Supernatant was collected in a new tube and equal amount of
Chloroform: isoamylalcohol (24:1) was added and centrifuged at
8000rpm for 10 minutes. Supernatant was collected in another tube
and again repeated Chloroform: Isoamyalcohol step.1/10th volume
of 3M Na-acetate was added in the final supernatant and half the
volume of isopropanol was added to precipitate the DNA.
In the last step tubes were centrifuged at 10000rpm for 15 minutes.
Pellet was dissolved in 50μl 1xTE buffer. There was intermittent pH
monitoring during each step.
Above protocol was repeated two times for better results. Then
above protocol was also tried one time for extraction of DNA from
surface peel of P.emblica fruits which are highly acidic.
Quality of Isolated DNA:
Quality of isolated DNA by this method from leaves of P.emlica,
T.indica, C.citrates, B.pinnatum and B.diffusa and fruit peels from
P.emblica was checked two times and loading 10 μl of sample in each
time on 0.7%agarose gel. This 10μl volume contained 7μl of diluted
sample and 3μl of EtBrdye(5μgm/ml).Quantification of DNA:
The yield of isolated DNA was determined by taking nanodrop at
260nm and 280 nm for measurement of 260/230 and 260/280 ratio to
check purity of isolated DNA.Amplification of isolated DNA:
The isolated genomic DNA was further analyzed for its analytical
applications by performing polymerase chain reaction to just check
quality of isolated DNA from chloroplast gene rbcL (650bp) and ITS
gene(450bp) with an initial denaturation 95⁰C for 3 minutes.It was followed by 35cycles of 1min denaturation at 95⁰C, 30s
annealing at 54⁰C and 1min extension at 72⁰C, with a final extension
of 10minute at 72⁰C.96 well thermal cycler (Applied Biosystems).
PCR reaction mixture containing of mastermix 20μl (Contains:
10X Taq buffer, 2mM MgCl2,0.4mM dNTP mix and 3 unit Taq DNA
polymerase (Blakbio).
Results
Quality of Isolated DNA:
DNA extracted by this method didn’t contain contamination
of RNA, polyphenols, complex polysaccharides like glycosides and
ascorbic acid without giving treatment of Rnase. In this way DNA
from Fresh leaves of Phyllanthus emblica, Tamarindus indica and
Cambopogon citrates, Bryophyllum pinnatum and Borhevia diffusa
and fruits peels for P.emplica containing low pH was extracted.Contamination of polyphenol was removed by use of PVP
(polyvinylpyrolidon) and contamination of polysaccharides was
removed by addition of salt (1.4M NaCl) containing extraction buffer
and pH was adjusted with the help of 0.1N NaOH.
In the present study we maintained pH 8.0 at the time of
incubation as well as at the time of grinding by adding 0.1N NaOH
during 10 to 15 minutes time interval at the time of incubation and
observed a good quality of DNA while running it on 0.7% Agarose
gel.
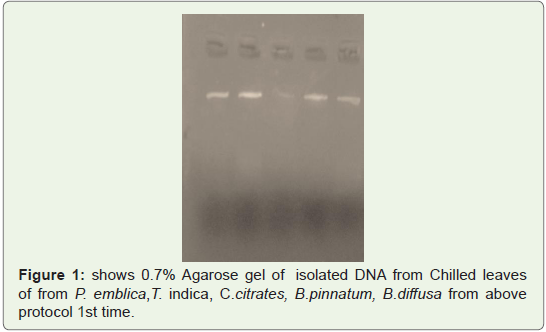
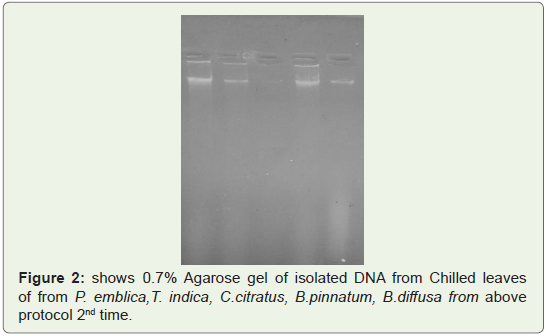
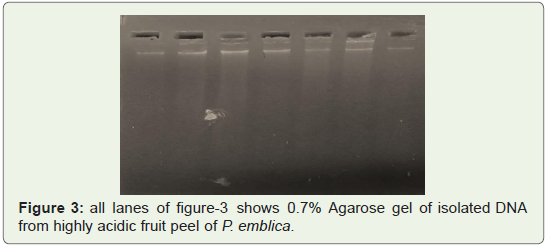
Good quality of DNA was observed in gel shown in Fighre1-3
isolated from leaves of P. emblica, T. indica, C.citrates, B.pinnatum,
B.diffusa two times (Figure 1,2) and from Fruit peels of P.emblica
one time (Figure 3).
Quantity of isolated DNA:
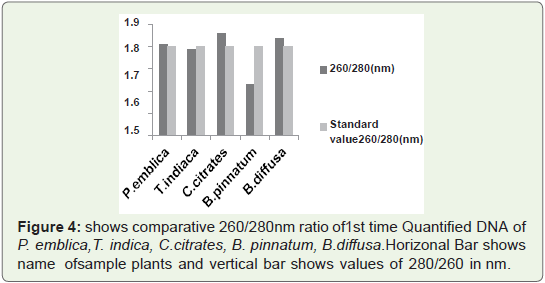
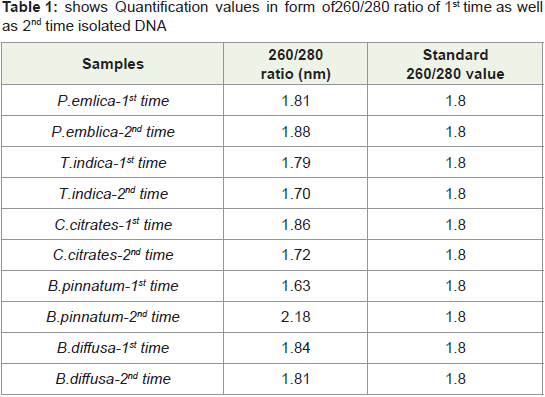
Quantity of 1st time isolated DNA from leaves 260/280 Ratio: It
is crucial to measure 260/280 nm ratio of isolated DNA especially
when DNA isolation is under intermittent pH monitoring. Because if
there will be mall change in pH that will lead to variations in 260/280
ratio. Generally standard values of this ratio for good quality DNA
is 1.8-1.9.However high 260/280 ratio is not much problematic. But
if ration is greater than 1.9 then it is problematic and it indicates
contamination of RNA and then in that case needs treatment of
Rnase during isolation. Very much high value sometimes indicates
contamination of protein.In Figure 4 Bar graph indicates that that 260/280 ratio of all
quantified plant. DNA samples are not more than 1.9.So ratio is not
so much higher than standard values. So 1st time quantified. DNA
from this protocol is RNA free and is not quantified in acidic pH that
means during isolation pH was maintained at 8.
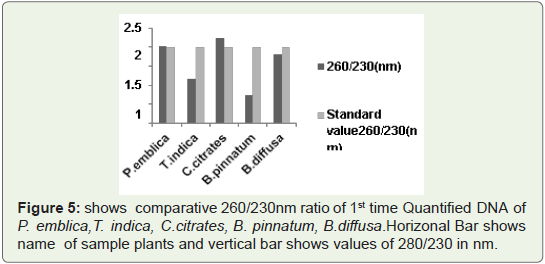
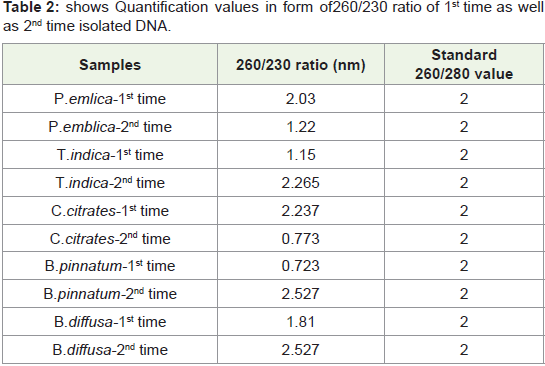
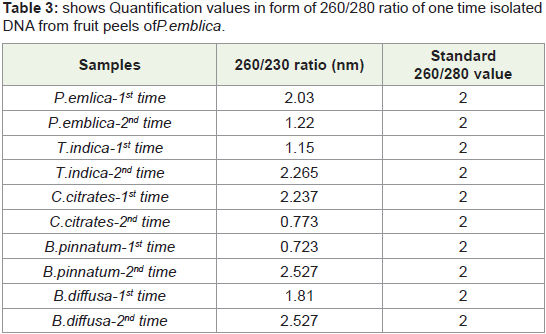
260/230 Ratio:
Generally standard 260/230 ratio of quantified DNA is in between
2-2.5.Sometimes these values can reach upto 3.But values more than 3 will be problematic. So unusual values indicated contamination of
reagents used during extraction procedure like phenol, chloroform
and other polysaccharides present in leaf tissue sample. Such unusual
value showing quantified DNA is difficult to amplify. So 1st time
quantified DNA from this protocol shows nearer to standard 260/230
values that is not more than 3 that means Isolated Quantified DNA is
Phenol free, chloroform free and also free from other polysaccharides.In Figure 5 Bar graph indicates that 260/230 ratio of all quantified
plant DNA samples are not more than 3.So ratio is not so much higher
than standard values. So 1st time quantified DNA from this protocol
is chloroform free, phenol free (if used) free and polysaccharides
free. Because presence of polysaccharides contain high 260/230 ratio
which is generally higher than 3.Such type of DNA needs further step
of purification either manually or with help of kit.
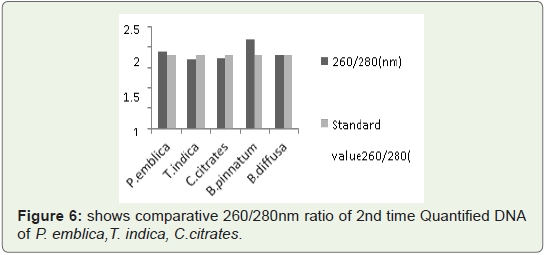
Quantity of 2nd time isolated DNA from leaves 260/280 Ratio:
260/280 ratio was measured of 2nd time isolated DNA by this
protocol for better standardization.In Figure 6 Bar graph indicates that 260/280 ratio of all quantified plant DNA samples are not more than 1.9.So ratio is not so much
higher than standard values. So again 2nd time quantified DNA from
this protocol is RNA free and is was not quantified in acidic pH that
means during isolation pH was maintained at 8.
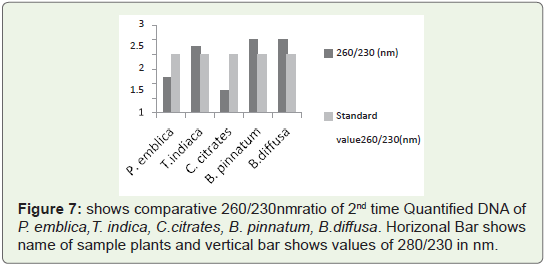
In Figure 7 Bar graph indicates that 260/230 ratio of all quantified
plant DNA samples are not more than 3.So ratio is not so much higher
than standard values. So 2nd time quantified DNA from this protocol
is chloroform free, phenol free (if used) free and polysaccharides
free. Because presence of polysaccharides contain high 260/230 ratio
which is generally higher than 3.Such type of DNA needs further step
of purification either manually of with help of kit.
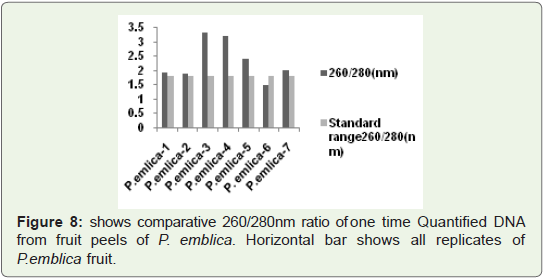
In Figure 8 Bar graph indicates that 260/280 ratio of quantified
plant isolated DNA samples from highly acidic fruit peel of P.emlica
replicates, These values are not more than 3.5, In some replicates
(vertical Bar-1, 2, 3, 7) values are nearer to standard value that is
1.8.So it is good indication of RNA free DNA and rest of replicates
indicates more or less contamination of protein. But we successfully
isolated good quantity of DNA from acidic fruit peel also.
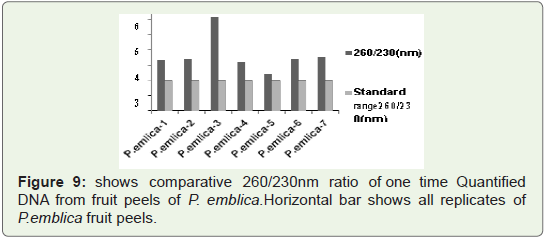
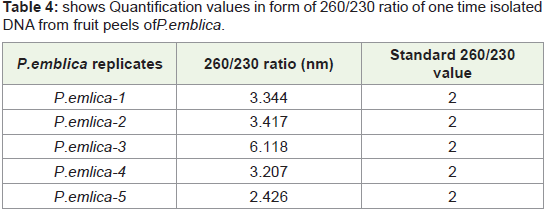
In Figure 9 Bar graph indicates that 260/230 ratio of quantified
plant isolated DNA samples from highly acidic fruit peel of P. emblica replicates. Among all seven replicates in some replicates value
reach upto 6.5 where as in some replicates it is nearer to standard
value that is 2 (vertical bar 4 and 5).Sometimes high 260/230 ratio is
not due to contamination of reagents and other handling errors but
it is due to presence of complex polysaccharides like polyglycosides.
We check this quantified DNA for PCR amplification which is well
isolated manually, but for further downstream processing like DNA
fingerprinting use of column is required.
Amplification of isolated DNA
Just to check amplification efficiency of well isolated and well
quantified DNA that was PCR(Thermo) amplified by chloroplast rbcL
gene(650bp). PCR amplification was carried out just one time and
amplified DNA was run on 2% agarose gel.
In Figure 10 lane-1 shows 100bp Standard DNA marker and from
lane-2 to lane-6 shows PCR amplified DNA of P. emblica,T. indica,
C.citrates, B. pinnatum, B.diffusa. In all lanes 3μl of amplified DNA of
all samples as well as marker was loaded.
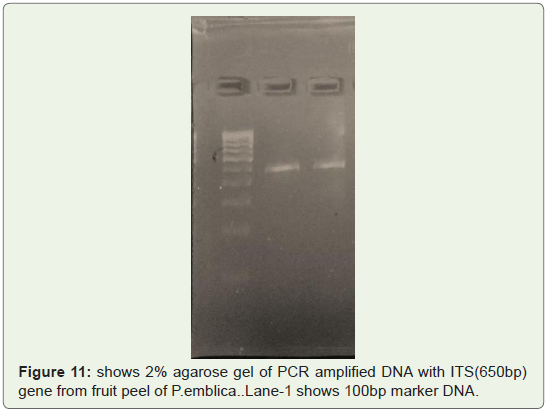
Amplification efficacy of well isolated and well quantified one
time from fruit peels of P.emblica was also checked and only two
replicates containing good 260/280 and 260/230 ratio were selected
for PCR (Thermo) amplification and they are amplified by ITS
(450bp) gene just to check amplification efficiency.
Discussion
It is difficult to extract genomic DNA from plants containing high
amount of polyphenol and polysaccharides. These polysaccharides
produce complex form of DNA which becomes resistant from certain
modifying enzymes like Restriction endonucleases, DNA polymerase
(Taq polymerases) and DNA ligase etc [16].
High quality and quantity of DNA are necessary for successful
PCR amplification and other downstream applications like DNA
fingerprinting. There are various protocols available for isolation of
good high quality of DNA from plant tissues [12-19]. But none of
them were applicable to plants containing high acidic pH.
Earlier DNA was isolated from the leaves of Phyllanthus
emblicabut still quality and quantity was a problem [20]. They isolated
DNA from three different maturity levels of leaves from different
varieties of Phyllanthus emblicaby adjusting pH at different steps of
isolation and pH was adjusted in between 7.0-7.66.
In present study by this standardized protocol quantification
values of isolated DNA shown in Table 1-4 both 1st time and 2nd
time indicates good results that is nearer to standard value that is
1.8 and free from contamination of Rnase. pH-8 is adjusted very
much carefully.260/280 ratio nearer to 1.8 indicates that DNA is not
degraded and it is well quantified.
Conclusion
In the present research work modified CTAB protocol was
successfully established and worked on DNA extraction from
pre chilled leaves of Phyllanthus emblica, Tamarindus indica,
Cambopogon citrates, Borhevia diffusa and Bryophyllum pinnatum.
Leaf tissues of this plant contain more or less amount of ascorbic
acid and due to present of vitamin C reach contents it was difficult
to isolate good quality of DNA and quantify them. Problem is solved
by this protocol without use of liquid nitrogen, Rnase enzyme and
protenase K enzyme but this protocol require intermittent pH
monitoring at 8 at every step and especially during step of incubation
of 30 minutes at 60ºC.So this protocol is suitable for plant leaves as
well as fruit peels which are acidic in nature and bit sour in taste and it
uncover difficulties of qualification, quantification and amplification
of DNA from such type of tissue materials.
Acknowledgement
Author is thankful to God and Dr Farzin M Parabia for his
constant support.Author is also thankful to all teaching and non
teaching members of ARIBAS college and beloved
Author is also thankful to all teaching and non teaching members
of ARIBAS college and beloved friends for their love and support.
References
Citation
Ladani MR, Parabia FM. Protocol Establishment-As Well Defined Rule a and Step for Extreme Good DNA Extraction, Qualification,
Quantification and Amplification Efficiency from Leaves and Fruit Peel of Phyllanthus Emblica, Tamarindus Indica, Cambopogon Citrates, Borhevia
Diffusa and Bryophyllum Pinnatum- Containing Sour Taste. J Plant Sci Res. 2021;8(2): 208