Research Article
Incidence of Ozone Injury on Hybrid Poplar Trees in Southwestern Pennsylvania USA: A 26-Year Field Study
Davis DD1*, Marini RP2 and Decoteau DR2
1Department of Plant Pathology and Environmental Microbiology, The Pennsylvania State University, USA
2Department of Plant Science, The Pennsylvania State University, USA
*Corresponding author: Davis DD, Department of Plant Pathology and Environmental Microbiology, The Pennsylvania State University, University Park, PA, USA; E-mail: ddd2@psu.edu
Copyright: © Davis DD, et al. 2020. This is an open access article distributed under the Creative Commons Attribution License, which permits unrestricted use, distribution, and reproduction in any medium, provided the original work is properly cited.
Article Information: Submission: 11/11/2020; Accepted: 14/12/2020; Published: 17/12/2020
Abstract
During 1991 to 2016, we evaluated the annual incidence (percentage) of hybrid poplar trees exhibiting ozone (O3)-induced leaf injury (stipple) within 15 planted field-study plots in southwestern Pennsylvania, USA. Incidence of stippled poplars decreased from a mean of 3.84% in 1991 to 0.00% in 2016. Mean
annual 8-hr ambient O3 concentrations, downloaded from a U.S. EPA monitoring site located ca 60 km west (upwind) from the closest study plot, decreased from 96 ppb in 1991 to 67 ppb in 2016. Regression analysis revealed that during the 26-year period, the annual incidence of poplar trees exhibiting ozoneinduced
leaf stipple was significantly and linearly related to the mean annual O3 concentration.
Keywords
Air pollution; Ozone; O3; Hybrid poplar trees; Leaf stipple
Introduction
Tropospheric ozone (O3):
Tropospheric ozone (O3) is the most important phytotoxic (plant
damaging) air pollutant in the USA [1,2]. Ozone is a secondary air
pollutant formed by photochemical reactions between Oxides of
Nitrogen (NOx) and Volatile Organic Compounds (VOCs), two
precursors to O3 formation [1,3,4]. Rural Pennsylvania (PA, USA)
contains phytotoxic levels of ambient O3 [2,5,6], especially in areas
that experience long-range transport of NOx and VOCs within slowmoving,
stagnant, high-pressure systems [7]. Predominantly eastbound
weather systems traverse the industrial Ohio River Valley
on the western border of PA and the Pittsburgh industrial areas,
collecting precursors to O3 formation before entering our study area
in southwestern PA. Elevated levels of ambient O3 in the study area
usually begin in May, increase through the summer, and often peak in
August. Diurnal patterns often reflect greater ozone concentrations
in mid-afternoon when O3-forming reactions are driven by incoming
solar radiation, and lowest O3 levels generally occur after sunset, when
O3 is continuously converted back to NNO2 and O2 in the presence of
NO [1,4,8].Ozone injury to vegetation:
The importance of O3 as a significant phytotoxic air pollutant
in the USA was first reported in the USA by Richards et al. in 1958
[9]. They had previously observed O3-induced leaf injury on wild and
cultivated grapes (Vitis spp.) as early as 1954 in the Los Angeles, CA
air-basin. They described O3-induced leaf symptoms as “stipple,”
which were comprised of groups of dark brown-to-black, leaf
palisade-mesophyll cells visible through the hyaline adaxial epidermis and overlying cuticle. Stipple on many species of broadleaved plants
was later shown to be indicative of phytotoxic concentrations of
ambient O3, which could be used to identify O3-sensitive bioindicator
plants [2,10,11]. Early researchers observed that the incidence and
severity of O3-induced stipple varied among individuals within
an open-pollinated species depended on their parentage [12].
However, variability could be minimized by using asexual, clonally
propagated (e.g., from cuttings) bio-indicator plants [Davis, personal
observations].On 1 October 2015, the U.S. Environmental Protection Agency
(EPA) enacted a more stringent National Ambient Air Quality
Standard (NAAQS) for ground-level O3 [13]. The new standard was
based on the 4th highest daily maximum O3 concentration, averaged
across 3 consecutive years for an averaging time of 8 hrs [14]. If
that value exceeded 70 ppb, the relevant area was considered to be
in nonattainment of the standard. Southwestern PA, including our
study area, was in attainment of the new NAAQS for 2016 to 2018,
the 3 most recent years for which EPA O3 data were available at
time of this writing (https://www3.epa.gov/airquality/greenbook/
map8hr_2015.html, accessed 24 September 2019).
Objectives:
The general objective of this study was to evaluate temporal and
spatial patterns of incidence (percentage) of planted hybrid poplar
trees that exhibited O3-induced stipple during 1991 to 2016 on study
plots in southwestern PA. The specific objective was to determine if
annual ambient ozone levels were statistically related to the annual
incidence of ozone-induced poplar stipple during the 26-year period.Introduction
Ambient ozone concentrations:
Material and Methods
Annual mean 8-hr ambient O3 concentrations (ppb) for 1991 to
2016 were downloaded from EPA O3 monitoring site #42-003-00008
(40°27’55”N, 79°57’38”W), located ~40 km westward and upwind
from the study area.Study area:
The study area is located in a rural portion of the Appalachian
Plateau Physiographic Province in southwestern PA (Figure 1), as
described by McClenahen et al. [15]. The area has a rolling dissected
topography with ridges oriented in a southwest-northeast direction
and elevations ranging from ~400 - 800 m. The climate is continental,
average annual precipitation is ~100 cm, and prevailing winds are
from the west. Although the study area is mainly rural, it contains
scattered industries and is located downwind from the Pittsburgh and
the Ohio River Valley industrial areas, which are major sources of
precursors to O3 formation. Johnstown, which has a 100-year history
of air pollutant emissions from steel mills and coke works [16], lies
slightly downwind from the southeastern edge of the study area
and may be a source of O3 and precursors during winds from the
southeast.Study plots:
In 1964, Hutnik et al. established a network of ecological plots
in former agricultural fields within the study area to study effects of sulfur and SO2 on coniferous plants [17]. However, during the late
1960s and early 1970s, air pollution effects research in PA shifted
emphasis from primary pollutants such as SO2, often localized near
point sources, to the widespread secondary air pollutant O3 [Davis,
personal observations]. Therefore during 1972 to 1976, Hutnik and
colleagues established 20 rooted cuttings of an O3-sensitive hybrid
poplar clone (Populus maximowizii x trichocarpa USDA Forest Service
Northeastern Forest Experiment Station Clone NE 388) on each of 22
50x50 m plots as bioindicators of phytotoxic levels of ambient O3 [18].
During 1981 to 1990, the years with the most complete datasets at the
time, the incidence of O3 injury on the poplar trees was significantly
(P = 0.05) correlated with the number of days having hourly O3 concentrations > 40 ppb [18]. By 1991 several original plots had been
lost due to change of land ownership and various land-use changes.
Therefore, we selected 15 of the remaining intact study plots for use
in this 26-year study beginning in 1991 (Figure 1). Large poplars
were removed to minimize plot shading and were replaced with new
rooted cuttings of the same clone; data were not taken on the new
cuttings until 1 year after establishment.Evaluation of visible ozone injury:
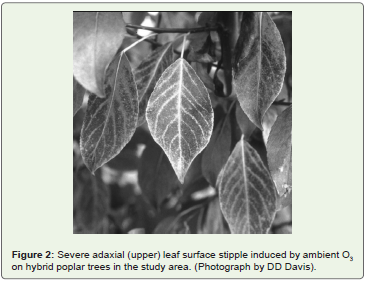
Beginning in 1991, each poplar tree on each plot was evaluated
for presence or absence of visible O3-induced leaf stipple (Figure 2),
which was shown to be caused by O3 in controlled studies [18].
Symptom evaluations were conducted in early to mid-August, usually
the time of greatest O3 injury on native broadleaved plants in the
study area [5,7,19]. Stipple on each tree was classified as present or
absent, and incidence (percentage) of poplar trees exhibiting stipple/
plot/year calculated until the study was terminated in 2016.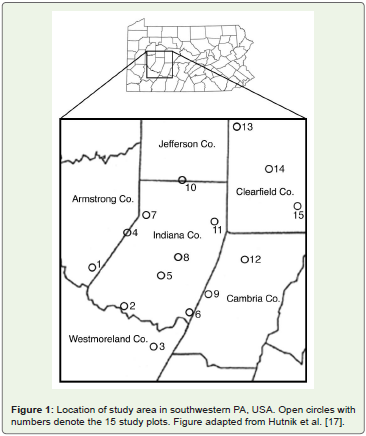
Statistical analyses:
Polynomial regression was performed with SAS’s PROC
REG (SAS for Linear Models, 4th Ed.) to evaluate the relationship
between O3-induced leaf injury and mean annual ambient ozone
concentration. However, only the linear term was significant and
residual plots indicated the quadratic term did not improve the
model. Therefore, linear models were fit in order to model changes
in O3 ambient concentrations and leaf injury over the 26-year study
period.Results and Discussion
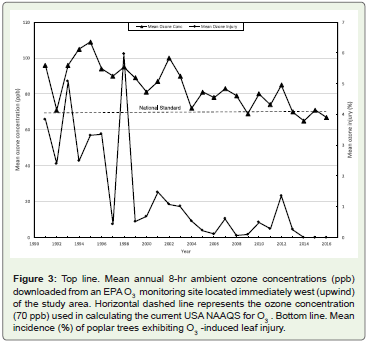
Regarding general temporal patterns, ambient O3 data downloaded from the EPA monitoring site revealed that the annual mean 8-hr O3 concentration decreased from 96 ppb in 1991 to 67 ppb in 2016, a 30% decrease (Figure 3). Mean annual percentage of hybrid poplar trees exhibiting O3-induced stipple decreased from 3.84% in 1991 to 0.00% in 2016, the last year of the study (Table 1). For the entire 26-year period, the mean annual ambient O3 concentrations and mean annual percentage of O3 injury on poplars were significantly and
positively correlated in a linear manner (n = 26, R2 = 0.39, P = 0.001). The complete lack of leaf stipple in 2016 was possibly due to ambient O3 levels being below a general level needed to induce O3 injury, or to environmental conditions that were not conducive to O3 uptake and subsequent development of foliar injury.
The temporal pattern of O3 injury incidence peaked in 1998.
However, this peak did not appear to be strongly related to a peak
in ambient O3 concentration in (Figure 3). Therefore, the 1998 peak
may have been influenced by environmental factors such as ideal
soil moisture levels that were conducive to maximum O3 uptake that
occurred concurrently with environmental conditions conducive for
maximum foliar injury. Foliar O3 injury precipitously decreased in
1999, but the decline did not appear related to a similar decline level
of ambient O3 (Figure 3).
However, injury-threshold values are only general estimates
[20]. Onset of O3-induced foliar injury can be influenced by multiple
interacting factors, including genetic (inherent species O3 sensitivity or
tolerance), physiologic (detoxification capacity, defense mechanisms),
physiographic (elevation), environmental (drought), seasonal, and others. These confounding factors and their interactions make it
difficult to determine meaningful O3 injury threshold values [20].
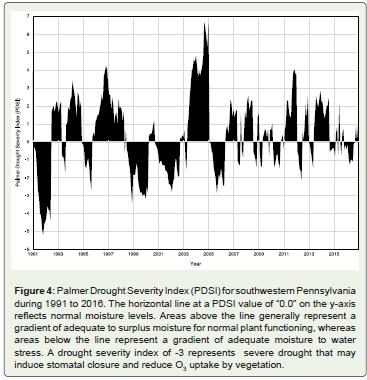
Relatedly, Smith et al. reported a similar temporal trend in O3 injury in a large study involving the incidence of O3-induced stipple on milkweed bioindicator plants (n = 65,448) in the northeastern USA from 1994 to 2010 [21]. Similar to our findings, they also reported a peak of O3 injury in 1998 followed by low stipple levels in 1999 that they related to a widespread drought that occurred in 1999 within northeastern USA. This drought also encompassed our study area, as verified by the Palmer Drought Severity Index for southwestern PA (Figure 4) [22]. Figure 4 also illustrates that two severe drought periods occurred in southwestern PA during the period from 1999 to 2003. During this time interval, the drought likely caused soil moisture stress, resulting in closed stomata and reduced O3 uptake, which in turn could reduce O3 injury on sensitive bioindicators [21,23]. The low level of O3-injury on poplars then persisted through 2016, except for small peaks of injury in 2001 and 2012 (Table 1 and
Figure 3). These small peaks may have been partially related to subtle changes in O3 concentrations in combination with subtle changes in
soil moisture (Figure 3). Interestingly, the similar temporal patterns
in O3 injury between our study involving poplars and that of Smith
et al. involving milkweeds, suggest similar environmental factors
for the two species that influenced the percentage of O3 injury [21].
Such common factors may influence O3 injury in other various plant
species [21,23].
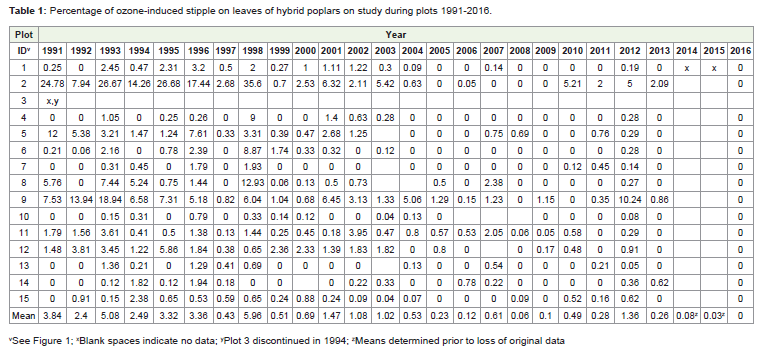
Regarding spatial patterns, during 1991 - 2003 and 2010 -
2013, mean O3-induced leaf symptoms on poplars appeared to be
slightly greater on plots in the west-southwest (generally upwind)
portion of the study area and becoming less severe with distance
downwind (to the northeast) (Figure 1 and Table 1). This upwind-todownwind
decreasing pattern is likely attributable, at least partially,
to O3 precursors (NOx and VOCs) originating from industries in
southwestern PA and the Ohio River Valley. However, during the
later time period from 2014 to 2016, O3 injury was minimal and
therefore spatial patterns could not be discerned (Table 1 and Figure 3). In 2016. for the first time since the study began, O3 injury was not
observed on ozone-sensitive hybrid poplar.
Conclusion
The incidence of O3-induced stipple on hybrid poplar trees
on field-study plots in southwestern PA decreased from a mean
of 3.4% in 1991 to 0.00% in 2016. Mean annual 8-hr ambient O3 concentrations, downloaded from a nearby U.S. EPA monitoring site
likewise decreased during the 26-year study. During 1991 to 2016,
the mean annual incidence of poplars exhibiting stipple induced by ambient ozone was significantly (P = 0.001) correlated with the mean
annual ozone concentration.
Acknowledgments
This work was supported by the USDA National Institute of Food
and Agriculture (NIFA) and Federal Appropriations under Project
PEN04564, Accession number 1002837; and by the owners of the
Keystone and Conemaugh electric generating stations.
References
Citation
Davis DD, Marini RP, Decoteau DR. Incidence of Ozone Injury on Hybrid Poplar Trees in Southwestern Pennsylvania USA: A 26-Year Field
Study. J Plant Sci Res. 2020;7(2): 199