Research Article
Use of Dried Compressed Air to Generate Ozone in Vegetation Exposure Chambers: Quantification of Trace Nitrogen Oxidants Formed During Corona Discharge
Lloyd KL1, Davis DD2, Marini RP1, Decoteau DR1*, Huff AK3 and Brune WH3
1Department of Plant Science, The Pennsylvania State University, USA
2Department of Plant Pathology and Environmental Microbiology, The Pennsylvania State University, USA
3Department of Meteorology and Atmospheric Science, The Pennsylvania State University, USA
*Corresponding author: Decoteau DR, The Pennsylvania State University, University Park, PA, USA, Email: drd10@
psu.edu
Copyright: © Lloyd KL, et al. 2019. This is an open access article distributed under the Creative Commons Attribution License,which permits unrestricted use, distribution, and reproduction in any medium, provided the original work is properly cited.
Article Information: Submission: 31/07/2019; Accepted: 04/09/2019; Published: 07/09/2019
Abstract
Corona discharge ozone (O3) generators provide valuable data on the response of vegetation to O3 exposures. Systems that use dried air as a feed gas, instead of pure or concentrated oxygen (O2), are known to produce trace nitrogen (N) oxidant byproducts that may be toxic to plants. This study quantified the concentration of total N oxidants, including nitrogen oxides (NOx, the sum of NO and NO2), dinitrogen pentoxide (N2O5), and nitric acid (HNO3
), relative
to O3
levels in a continuous stirred tank reactor (CSTR). The CSTR was part of computer-controlled O3
delivery and monitoring system used to study effects
of O3 on vegetation within a greenhouse with charcoal-filtered air. Ozone was generated via corona discharge with dried air as a feed gas, and the system
was operated at different O3 output levels and environmental conditions in seven separate trials. At O3 levels up to 330 ppb, total N oxidant concentrations in the CSTR did not exceed 9.2 ppb, when averaged over 60-sec intervals. Across all trials, the relationship between total N oxidants and O3
was described by the equation: N oxidants (ppb = 0.0108 [O3(ppb)] + 3.37 (R2 = 0.46; n = 205). In this system, trace N oxidant levels produced under typical experimental conditions are not expected to cause direct toxicity to vegetation. Therefore, corona discharge O3 generators provide a suitable, inexpensive method of O3 production for vegetation exposure studies.
Keywords
Air pollution; Ozone; Oxides of nitrogen; CSTR exposure chambers; Corona discharge
Introduction
Tropospheric ozone (O3): Ambient tropospheric O3
is one of the most phytotoxic air pollutants in the U.S., if not the world [1-3]. Ozone is a secondary air
pollutant formed from photochemical reactions of nitrogen oxides
(NOx, the sum of NO and NO2) and volatile organic compounds (VOCs). The U.S. Environmental Protection Agency (EPA) has designated O3
as one of six criteria air pollutants regulated by the
National Ambient Air Quality Standards (NAAQS) to protect human
beings, agricultural crops, forest ecosystems, and other resources
in the U.S. from ambient exposure [4]. Ozone is of regional-scale
importance in the U.S. due to its multi-day lifetime within slowmoving, stagnant high-pressure systems and, as a result, may cause damage to vegetation many miles downwind from the origin of its precursors, NOx and VOCs [3].
Exposing vegetation to O3 in chambers: Ozone generators are important tools to study effects of O3 on
vegetation. Since O3 cannot be stored, it must be created on-demand
at the application site. In vegetation studies, O3 generators have been
essential for controlled studies evaluating the harmful effects of Ov on vegetation [5,6], including the U.S. EPA’s National Crop Loss
Assessment Network, which established dose-response relationships
between O3 and crop yields using a network of open-top chambers
[7]. Current research relies on O3 generators to evaluate the impacts
of O3
on different crop species [8,9], at different times of day [10,11],
and interacting with climatic changes [8].
Generation of ozone: Ozone generators dissociate molecular oxygen (O2) into atomic
oxygen (O). Subsequently, the O atoms produced by the generator
combine with O2
to form O3
[12,13].
The most common O3 generation method, corona discharge,
uses a high-voltage electric arc to split O2
(i.e., similar to lightning), but if air is used as a feed gas instead of pure O2
, NOx and N2O5 also
form [14]. Corona discharge or high-voltage electric arc generators
produce electrons that collide with and dissociate molecules of O2
and N2 in the air, resulting in formation of O and NO. As a byproduct,
NO is then oxidized by O3 until it reaches the highest possible
oxidation states as N2O5
or HNO3
. If water vapor is present, the N2O5
is hydrated to HNO3
[15]. Nitrous oxide (N2O), another byproduct, is
not formed via dissociation but rather from an excited N2 molecule, which reacts with an O molecule. N2
O is chemically stable and not
further oxidized [15]. To prevent byproducts, pure O2
is the ideal feed
gas for corona discharge, providing up to twice the O3
output of dried
air. In addition to compressed O2
, oxygen concentrators can be used
to increase O2
levels in a pressurized ambient air supply. However,
both options raise production costs. Ambient air is therefore the least
expensive feed gas but necessitates frequent corona cell maintenance.
When ambient air is dried (i.e., to a dewpoint ≤-60 °
C), O3
output
is more consistent, and maintenance needs are reduced relative to
humid air [14,16].
In contrast, UV lamps use ambient air as a feed gas without
generating trace N oxidants. Light emitted by mercury lamps, in the
UV region at 185 nm, irradiates O2
present in ambient air, similar to
the photochemistry of the stratosphere, where O2
absorbs radiation
from 240 to 120 nm. In this process, one photon can generate up to
two O3 molecules when it dissociates one O2molecule to two single
O molecules, which then primarily combine with O2
to produce O3
[12]. Other types of lamps, such as xenon excimers, are also capable
of dissociating O2
and have been studied for practical O3
production
[17]. However, mercury remains standard, and new coatings have
been developed to increase lamp lifetime [18]. In spite of advances
in technology for UV lamps, corona discharge generators provide
the most efficient, durable O3
production, particularly for studies
requiring high flow rates of O3
and distribution to multiple exposure
chambers from a single source [19]. However, the cost of pure O2
as
a feed gas can be prohibitive for long-term studies [20].
Potential toxicity of N oxidants to vegetation: When using ambient air as a feed gas, it is important to quantify the potentially phytotoxic N oxidant compounds that result from passing O2 and N2 through a high-voltage dielectric field. These include NO and NO2 [20], as well as HNO3 [22] formed from hydrated N2O5 [15].
Under the Clean Air Act, EPA has maintained the secondary
NAAQS, which protect public welfare, for NO2
in the form of an
annual arithmetic mean of 53 ppb, which is considered sufficient to
protect vegetation from direct effects of gaseous NO2
[23]. However,
EPA [4] acknowledged the causal relationship between gaseous
NOx
and injury to vegetation. Further, EPA concluded that, at
ambient exposure levels for NO2
, exposure-response relationships
were variable, due to differences in biological and environmental
factors among experiments [24]. In some cases, low NO2
levels
increased growth, likely via foliar N fertilization. For continued (>
14 d) exposures of several hours per day, growth reductions generally
appeared when NOx
levels exceeded 100 to 500 ppb, depending on the
plant species [24]. EPA supported the conclusion that gaseous HNO3
can cause “changes” to vegetation but did not find evidence of direct
injury from HNO3
exposure [4]. They noted that dry deposition of
HNO3
and resulting changes (e.g., degradation of epicuticular waxes)
may increase adverse effects of other pollutants, such as O3
, on
vegetation [25]. However, Mortensen and Jørgensen [20] suggested
that trace N oxidants produced by corona discharge can also protect
vegetation against O3
damage. Few studies have been performed
since the 1993 EPA summary [24], leading to a lack of information
on the long-term effects of low concentrations of HNO3
and total
atmospheric oxidized N (NOy
) on plant species [4].
Terminology in this paper that defines inorganic N species is as
follows:
Previous studies have measured the production of N oxidants
relative to O3
by corona discharge with dried air, as emitted directly
from the generator. Notably, different systems and conditions (e.g.,
temperature, pressure) cause variation in relative yields [25]. Using
infrared spectroscopy Harris et al. [14] and Kogelschatz and Baessler
[17] estimated a molar ratio of HNO3
to O3
ranging from 0.007 to
0.010 per 1 mol O3
. Bubbling the generator air stream through water
and measuring dissolved NO3
- resulted in higher HNO3
: O3 ratios, in
the range of 0.020 to 0.025 [20,25].
Objective:
The objective of this study was to quantify trace N oxidants,
as NOy
, present in a charcoal-filtered-air greenhouse during O3
production via corona discharge. Specifically, the relationship
between O3
and NOy
concentrations within continuous stirred tank
reactor (CSTR) treatment chambers [6], used to study the response
of vegetation to O3
[11] was of interest. Quantification of N oxidant
byproducts under experimental operating conditions was necessary
to ensure that the use of pure air as a feed gas for the corona discharge
generator would not produce injurious levels of N oxide byproducts,
potentially confounding the effects of O3
treatment on vegetation.Material and Mehods
Ozone was generated via corona discharge, with dried air as
a feed gas, and distributed among 16 separate CSTRs, each with a
volume of ~2.6 m3, as described by Lloyd et al. [11]. Data were
recorded within a single representative CSTR. In order to quantify
NOy, oxidation products were reduced via thermal dissociation at 650 °
C to NO2
and measured using chemiluminescence (Model 42i-TL;
Thermo Environmental Corp., Franklin, MA) as NO, NO2
, and NOx Ozone was generated via corona discharge, with dried air as a feed gas, and distributed among 16 separate CSTRs, each with a volume of ~2.6 m3, as described by Lloyd et al. [11]. Data were recorded within a single representative CSTR. In order to quantify NOy, oxidation products were reduced via thermal dissociation at 650 ° C to NO2 and measured using chemiluminescence (Model 42i-TL; Thermo Environmental Corp., Franklin, MA) as NO, NO2, and NOx, with a 60-sec averaging time. The thermal dissociation column was
constructed as described by Wooldridge et al. [26] and placed in one
of the CSTRs. Measurements recorded when the thermal dissociator
was at ambient temperature and when heated to 650 °
C reflect NOx
and NOy
levels, respectively. Therefore, the difference between those
quantities (i.e., NOy
– NOx
) gives an approximation for NOz.
Results and Discussion
Across seven trials, background NOx
levels in the CSTR, prior to
operation of the O3
generator, ranged from approximately 2 to 5 ppb,
with about 45% in the form of NO (data not shown). For comparison,
across the U.S., the average annual NO2
concentration for ambient
air is ≈15 ppb [27]. Production of O3
from the generator decreased
the proportion of NO, since O3
reacts with NO to form NO2 [25]. The
minimum levels of NO recorded during ambient conditions and O3
production were 0.77 and 0.22 ppb, respectively (data not shown).
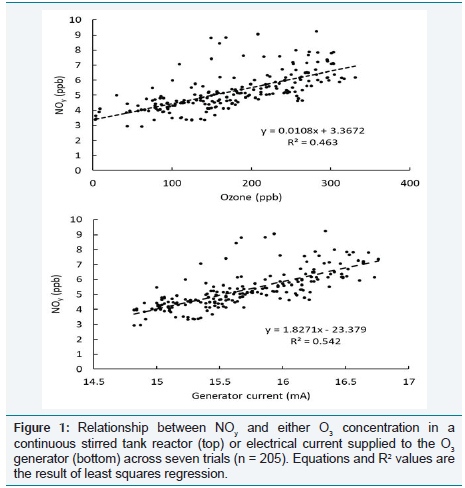
Background NOx
levels during operation of the O3
generator
(and thermal dissociation column) can be inferred from the intercept
term of least squares regression, with a mean of 3.37 ppb across
trials (Figure 1). Background NO2
was included in the analysis of the
relationship between NOy
and O3
to provide a maximum estimate of
the level of NOy
plants may be exposed to in CSTRs.
Across all measurements, NOy
concentration was linearly related
to both O3
concentration and electric current, but electric current
explained slightly more variation (R2 = 0.54) than did O3
(R2 = 0.46, Figure 1). For the range of O3
concentrations tested, up to 331 ppb,
the maximum NOy levels recorded did not exceed 9.2 ppb. Across the
seven trials, the linear relationship between NOy
and O3
in the CSTR
was described by: NOy
(ppb) = 0.0108 [O3
(ppb)] + 3.37 (R2
= 0.46, n
= 205 Figure 1).
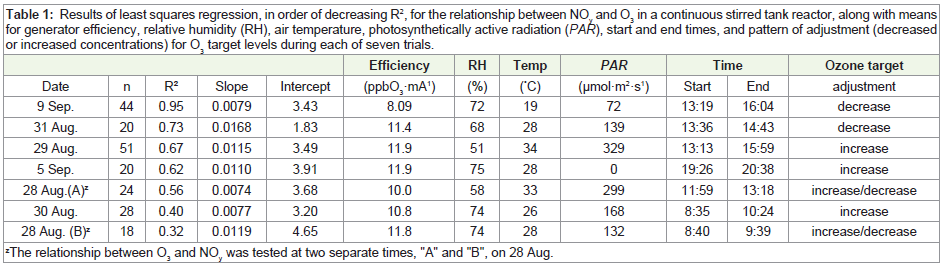
For the seven separate trials, results of least squares regression
are given in Table 1. R2 values ranged from 0.32 to 0.95, slope coefficients ranged from 0.0074 to 0.0168 ppb NOy
·ppb O3-1, and
intercepts ranged from 1.83 to 4.65 ppb NOy
. Notably, the number of
individual measurements and overall time period varied among trials
(Table 1). Based on least squares regression, there was no relationship
between slopes or intercepts and air temperature, relative humidity,
or photosynthetically active radiation (PAR) across the seven trials
(R2 = 0.01 to 0.04, data not shown).
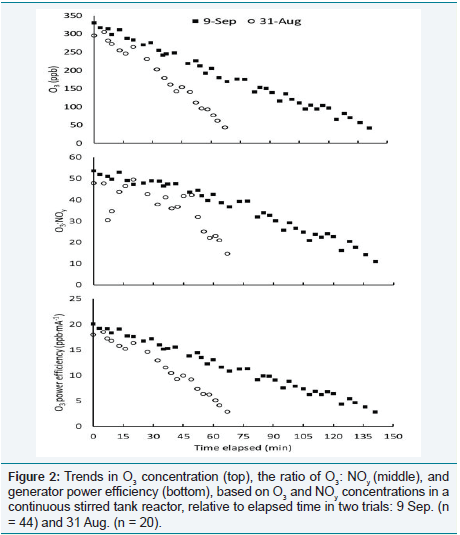
Comparison of the trials on two dates with the highest R2
values,
9 September and 31 August, helps explain the variation in slopes and
intercepts. Relative to 31 August, the regression from 9 September
produced a larger intercept (3.43 vs. 1.83 ppb NOy
) and smaller slope
(0.0079 vs. 0168 ppb NOy
.
ppb O3-1, Table 1). Figure 2 shows the O3
concentration (ppb), ratio of O3
(ppb) to NOy
(ppb), and power
efficiency (ppb O3
·mA-1) plotted relative to the elapsed measurement
time (min) on both days. On 9 September, a larger number of
measurements (n = 44 vs. 20) was recorded over a longer time period
(185 vs. 67 min). On both dates, target O3
levels in the CSTR were initially set at greater than 300 ppb and decreased over time. The
rate was slower on 9 September than on 31 August, and the ratio of
O3
: NOy
was less variable, as well as the generator power efficiency.
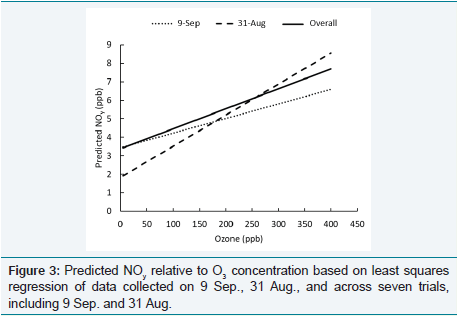
These differences reflect inherent “noise” in the O3
distribution and
monitoring systems, which can result during computerized feedback
when adjustment of electrical current to the generator overshoots
target levels. The air in each CSTR is replaced (via a blower system)
approximately once per minute, leading to a time lag between O3
input from the generator, equilibration of the gas composition in
the CSTR, and travel distance for a sample parcel to reach the O3
monitor [11]. Figure 3 shows that the more rapid decrease in target
O3
concentration and resulting “bumps” in generator output caused
underestimates of predicted NOy
at low O3
levels and overestimates at high levels, relative to the expected values based on regression of
the overall data set.
The slope obtained via linear regression of all CSTR observations
(0.0108 ppb NOy
·ppb O3-1) falls within the range of prior measurements
(0.007 to 0.025), confirming that present observations of NO3
were
within reported values [14,15,20,25].
Using the predictive equation derived from all seven trials, at
a CSTR O3
level of 300 ppb, the expected NOy
concentration was
≈6.6 ppb. With maximum CSTR concentrations far lower than the
secondary NAAQS for NO2
, set at 53 ppb [24], direct plant injury is
unlikely. Further, Stripe et al. [22] treated two snap bean (Phaseolus
vulgaris L.) genotypes with HNO3
during the daytime for 6 weeks.
Exposure to peak daily HNO3
concentrations of 80 to 100 ppb did
not significantly affect bean plant biomass. Therefore, NO2
and HNO3
generated by corona discharge in the CSTR system are unlikely to
incite direct phytotoxic effects.
Conclusion
The system-specific estimates of NOy
production via corona
discharge, with dried air as a feed gas, are in agreement with other
studies, and these levels are not expected to be directly phytotoxic
in the form of NO2
or HNO3
. Notably, Taylor et al. [28] suggested
that elevated levels of both O3
and HNO3 are representative of
ambient conditions in the outdoor growth environment. However,
O3 has a much higher phytotoxicity than NOx
[24]. Therefore, studies
employing this method of O3
generation should produce valid results
testing the effect of O3
treatment on vegetation, though actual N by
product outputs will vary among exposure systems.
References
Citation
Lloyd KL, Davis DD, Marini RP, Decoteau DR, Huff AK, et al. Use of Dried Compressed Air to Generate Ozone in Vegetation Exposure
Chambers: Quantification of Trace Nitrogen Oxidants Formed During Corona Discharge. J Plant Sci Res. 2019;6(2): 186