Research Article
Dry Forest Vegetation Analysis and its Soil Properties
Nay Myo Htike1, San Thwin2* and Nyunt Khaing3
1Forest Department, Head Office of Ministry of Natural Resources and Environmental Conservation, Nay Pyi Taw, Myanmar
2Department of Forestry, University of Forestry, Yezin, Nay Pyi Taw, Myanmar
3Forest Research Institute, Ministry of Natural Resources and Environmental Conservation, Nay Pyi Taw, Myanmar
Corresponding author: San Thwin, Department of Forestry, University of Forestry, Yezin, Nay Pyi Taw,Myanmar; E-mail: santhwin@gmail.com
Citation: Htike NM, Thwin S, Khaing N. Dry Forest Vegetation Analysis and its Soil Properties. J Plant Sci Res. 2016;3(2): 159.
Copyright © Htike, et al., 2016. This is an open access article distributed under the Creative Commons Attribution License, which permits unrestricted use, distribution, and reproduction in any medium, provided the original work is properly cited.
Journal of Plant Science & Research | ISSN: 2349-2805 | Volume: 3, Issue: 2
Submission: 12/08/2016; Accepted: 06/09/2016; Published: 10/09/2016
Abstract
Thirty sample plots (40m×25 m) were randomly sampled from three different sites of the dry forest under different management practices; natural forest protected by local people (CF), protected natural forest (PNF) and primary forest (PF) in Shwesettaw Wildlife Sanctuary. A total of 44 species belonging to 23 families at the adult tree level were recorded in the study area. The PF was found the highest 29 species of 19 families, following 29 species of 16 families in PNF, 21 species of 11 families in CF respectively. Tectona hamiltoniana ndicated the highest ecological significant species in the study area.Mimosaceae was the dominant in the study area. The structure described by diameter distribution was reversed J-shaped. Soil properties (BD, OM and pH) showed differences at significant level (p< 0.05) between CF and PF. By using PCA, the results showed that the species distribution is mainly related to soil compaction (BD) among the soil variable investigated at p< 0.05.
Keywords: Dry forest; Species composition; Diversity; Species distribution; Soil properties
Introduction
Dry Forests in the Central Myanmar are one of the ecologicalprecious resources which regulate local climate, and providebasis needs of local people, habitat for wild flora and fauna. Thesustainability of these forests is very important for the dry landecosystem. Nowadays, the Central Myanmar has faced challenges interms of land degradation and habitats loss because of rapid reductionin forest cover. So, dry forests require management intervention tomaintain the overall biodiversity, productivity and sustainability.Insufficient up-to-date baseline data on dry forests makes it difficultto develop effective conservation strategies. Knowledge of speciescharacteristics and stand structure is important in management ofbiodiversity conservation [1]. Thus, the study of floristic composition and structure of tropical forest becomes more imperative in the face of the ever increasing threat to the forest ecosystem. Knowledge of soil properties will provide as a useful tool in management practice for rehabilitation process [2]. Therefore, forest management practices need to monitor at the overall soil properties changes through the conservation of species composition. There exists little authentic quantitative analysis between soil-vegetation characteristics in Central Myanmar. For this reason, the present study attempts to analyze the species composition, diversity and species distribution in relation to soil properties of the dry forests under different management practices in Central Myanmar.
Material and Method
Study area
The two study sites; the Community Forest (CF) and the Protected Natural Forest (PNF) were selected in Pwinbyu Township,which is ranging the altitude from 120-300 m and situated between94’ 22’’ to 94’ 56’’ E and 20’ 07’’ to 20’ 30’’ N. The annual rainfallis 697.88 mm. The average highest and lowest temperatures of thestudy area are 33.07 °C and 20.84 °C respectively. CF implementationwas conducted about 90 ha through the natural forest conservationsystem in 2003. PNF with the area of 2100 ha was established in2005. By using the definition of FAO [3], the Primary Forest (PF) is selected in the Shwesettaw Wildlife Sancturay, which was established in 1940 and situated closely to the study sites, as a reference site for comparison of vegetation formation. All of these investigated forest stands represent the same forest formation of Terminalia oliveri-Tectona hamiltoniana.
Data collection
The study sites were demarcated using topographic maps,allocation of sample plots randomly and physiographic factorswere measured by GPS. Sample plot design followed the proceduredescribed by Lamprecht [4]. The 10 sample plots were set up in eachstudy site. Sample plot size was (40m × 25 m), where of all trees withDBH ≥ 10 cm were measured in DBH and height. Within the plot,one quadrate (20m × 15 m) was set and then saplings with DBH < 10 cm and total height of ≥ 1.3 m were measured in DBH and height.Then, subplots (5m × 5 m) were nested at four corners of the plotand all seedlings (0.3 m < height ≤ 1.3 m) were recorded in speciesidentification. Soil samples were taken at the center of the each sampleplot from 2 layers, 0-10 cm and 40-50 cm respectively.
Data analysis
Species composition was evaluated by analyzing three parameters:abundance, frequency and dominance of the species [5]. For the species diversity analysis, Shannon and Simpson’s index [6] was used as the index affected by both species richness and evenness of the population. Sorensen index [4] was used to indicate similarity of shared species between two communities. Soil properties were analyzed in the texture, bulk density (BD), moisture content (MC), soil reaction (pH) and organic matter (OM). All statistical analyzes were performed by using Excel 2007, Statistica 9 and PC-ORD version 5.10) for Window.
Results
Tree species composition and species diversity
The study of species composition in a community is of paramountimportant to effective conservation planning. Curtis and McIntoshpointed out Important Value Index (IVI) [7]. The ecological significant species in a community can be known by the species owned value called IVI. In the CF, Tectona hamiltoniana and Terminalia oliveri were the most ecological significant species based on their IVI values (Table 1). These species were approximately 33% of total abundance with the basal area 0.69 m2/ha in the forest. The CF belonged to 21 species and 11 families. Mimosaceae was the dominant family in the study site.

Table 1: Ecological significant species for all trees ≥10 cm dbh in the CF.
There were 16 families at the adult stage in the PNF. Fabaceaeand Combretaceae were dominant by occupying about 25% of thetotal families found in this site. The PNF had the higher numbers of individuals and basal area, and thus approaching to the PF. About29 species were found per hectare (Table 2). Tectona hamiltoniana with the highest density value was found to be the dominant species having maximum IVI value of 77.54; taking 34% of total abundanceand basal area of the investigated forest stand.
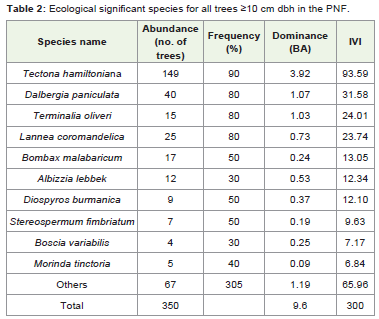
Table 2: Ecological significant species for all trees ≥10 cm dbh in the PNF.
In the PF, about 19 families represented and thus these numbers were the highest number of families among the study sites (Table 3). The two families, Fabaceae and Mimosaceae, were the most frequently found families, contributing about 13% of total occurrence in this study site. There were 29 species in the PF. The highest total basal area among three study sites, 9.60 m2 /ha was found in this study site. Tectona hamiltoniana showed the highest IVI value of93.59 and occupied approximately 43% in total abundance and 41%in total basal area. So, it can be said that the forest is a single species dominated stand, and thus this factor seems to be an indicator of the PF.
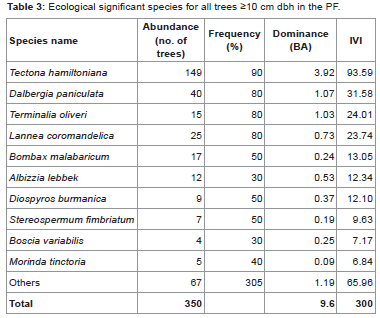
Table 3: Ecological significant species for all trees ≥10 cm dbh in the PF.
Species diversity
Species diversity is a function which incorporates information on species richness and evenness. The diversity is usually carried out inorder to examine its linkage to others community properties such asproductivity and stability, or to the facing environmental conditions[8]. Similarity indices indicate how species distribute between two communities [9]. The Sorenson’s index is based on the number of species (Ks) and dominance (Kd). Table 4 shows the diversity values observed in all investigated stands. The CF had the highest tree species richness (H’) and most even distribution (E) of the species among the study sites. The PF was found the lowest diversity indices. The PNF presented moderate value of diversity indices among all investigatedstands.
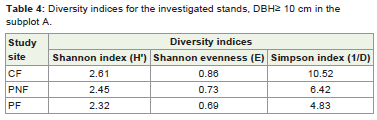
Table 4: Diversity indices for the investigated stands, DBH≥ 10 cm in the subplot A.
The coefficient of similarities for three study sites is shown inTable 5. A total of 14 species in the CF were similar to the PNF. This similarity index indicated that 56% of tree species found in the CF were similar to that of the PNF. The similar trend was observed between the PNF and the PF. The Kd indicated that approximately 80% of the species found in the PF were shared with the CF and the PNF.The PF and the PNF were highly similar; Kd was 91%, demonstratingthat these forest stands were remarkably similar. The higher similaritybetween these forest stands may be due to the occurrence of thespecies, Tectona hamiltonia, which occupied approximately 44% oftotal basal area the PF and amounted to 37% in the PNF.
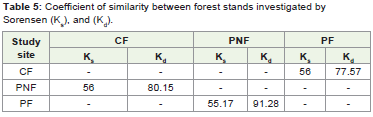
Table 5: Coefficient of similarity between forest stands investigated by Sorensen (Ks), and (Kd).
Horizontal stand structure by diameter frequency distribution
The horizontal structure of a forest can be measured by diametersize distribution of tree species considered individually or as acommunity [10]. In the CF the largest number of trees, i.e. 262 stems (53% of total abundance), occurred in the smallest diameter class ( ). Although the largest trees in the Community Forest attained a diameter class of 30- 35 cm, there were only two individuals in the largest diameter class. In the PNF, the smallest diameter class (0-5 cm) presented 273 individuals. At the diameter class of 5-10 cm, thetree density suddenly dropped into 88 stems.
A sudden decreasing of tree density in this diameter class may be due to the mortality of seedlings by natural or anthropogenicdisturbances. The PF exhibited a diameter frequency distribution ofreverse J-shaped. The tree densities were 880 individuals, and thusthe PF had the highest tree density that widely distributed in all dbhclasses up to 50 cm, in comparing to the CF and the PNF. The smallestdiameter class, i.e. 0-5 cm, contained 404 stems which amounted to46% of the total abundance. The PF showed favorable results by meanof well stocked and diameter-frequency distribution.
Stratification of forest canopy by IUFRO classificationscheme
The forest canopy can be flexibility stratified by IUFROclassification scheme. According to IUFRO classification scheme,forest vertical structure is composed of three strata [4]; upper (tree height> 2/3 top height), middle (2/3>tree height >1/3) and lower (< 1/3 of top height). The classification scheme informs some ecological traits of tree species of a stand: species with a regular vertical distribution, i.e. a particular tree species occurred in three strata; and species with uncertain natural regeneration, i.e. occurrence of species only in the upper canopy, etc.
As shown in Table 6, the upper strata consisted of the minimum number of species, tree abundance and basal area in all study sites. The species with regular vertical distribution were Tectona hamiltoniana, Terminalia oliveri, Shorea obtuse, Dipterocarpus tuberculatus in CF; Tectona hamiltoniana, Terminalia oliveri, Lannea coromandelica in PNF; Tectona hamiltoniana, Lannea coromandelica, Albizzia lebbek, Stereospermum fimbriatum, Dalbergia paniculata in PF respectively. By showing regular vertical distribution, these species are expected to certain in natural regeneration and long term sustainability.
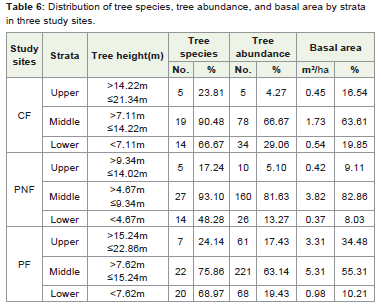
Table 6: Distribution of tree species, tree abundance, and basal area by strata in three study sites.
Forest soil properties
The knowledge of soil is very important to understand thegrowth and regeneration of forest. There is a dynamic process in soilformation and associated forest vegetation over long period of timethrough a complex sequence of interconnected events [11].
Numbers are the means with standard deviation (Mean ± SD).Different small letters indicate significant differences (p< 0.05) inTurkey HSD test Figure 1.
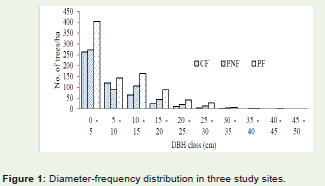
Figure 1: Diameter-frequency distribution in three study sites.
Overall study of soil texture, there was no large variation ofparticle size distribution between soil layers, among all study sites(Table 7). According to the soil texture triangle, three investigated forests possessed sandy loam in two soil layers. The CF belonged to the highest mean value of BD (1.53 g/cm3) among three investigated sites. Comparing with the findings of Arshad et al., [12], the mean values of BD showed the ideal level for plant growth. The top soillayer (0-10 cm) was more richness OM than subsoil layer (40-50 cm)in all study sites. The MC in all forests observed lower value in topsoillayer than subsoil layer. According to soil moisture range chart [13],the MC in both soil layers of all forests was below the wilting point.According to the general relationship between soil pH and availabilityof plant [14], the current findings in pH were also optimum level for plant growth. By regarding Turkey HSD comparison test, the findings significantly different at 5% level was observed in the case of BD and OM between CF and PF, and pH in all study sites.
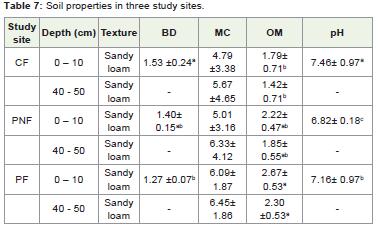
Table 7: Soil properties in three study sites.
Species distribution in relation to soil properties
The study of species-environment relationship has always beena critical issue in ecosystem [15]. All species have grown on their particular niche and a tendency to be rich around their favorableenvironmental condition. The main focus of PCA is to determine themost effective environmental factors in the dispersion of vegetationdata and to find the relationships between the existing plants andenvironmental factors [16].
The results of the PCA ordination are presented Figure 2. Theadult trees of 50 species and 5 soil variables (Texture, BD, MC, OMand pH) were used in the analysis. Tabachnick and Fidell recommendan inspection of the correlation matrix for evidence of coefficientsgreater than 0.3 [17]. McCune and Grace reported that it is pleased toexplain more than 50% of the variation with two axes [18]. The firsttwo principal components (PC1 and PC2) resolutely captured morevariance than expected by chance, together accounted for 76.047 % ofthe total variance in data set, contribution being 68.709% and 7.338%variance respectively.
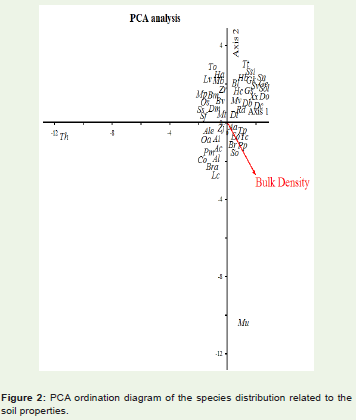
Figure 2: PCA ordination diagram of the species distribution related to the soil properties.
Species distribution according to soil properties by the PCAshowed significantly correlation with BD. Axis 1 (explained variance= 68.709%) of species data correlated with BD (r=0.521) at p< 0.05.The analysis results 8 species in positive correlation, 13 species in negative correlation and 29 species in no correlation with the BD.Axis 2 (explained variance = 7.338%) provided little information inthe data set. Combretaceae family was dominant among 5 familiesat the positive correlation with soil compaction. On the other hand,Mimosaceace was dominant at 21 families in no correlation withsoil compaction. Understanding the main factors affecting in thedistribution of species in the study area is applied in recommendationadaptable species for reclamation of the area.
Each species is identified by a code indicating its taxonomicsignificance, as follows: Mu, Melanorrhoea usitata; Pp, Premnapyramidata; Tc, Terminalia chebula; So, Shorea obtuse; Aa, Anogeissusacuminate; Tp, Terminalia pyrifolia; Br, Bridelia retusa; Eo, Emblicaofficinalis; Dm, Diospyros montana; Lv, Lagerstroemia villosa; Bm,Bombax malabaricum; Mb, Millettia brandisiana; To, Terminaliaoliveri; Mp, Millettia pendula; Sf, Stereospermum fimbriatum; Bv,Boscia variabilis; Ss, Schrebera swietenioides; Zr, Ziziphus rugosa;Mt, Morinda tinctoria; Ha, Holarrhena antidysenterica; Os, Olaxscandens; Th, Tectona hamiltoniana; Lc, Lannea coromandelica; Al,Albizzia lebbek; Sv, Sterculia versicolor; Gk, Gentiana kurroo; Rd,Randia dumetorum; Hc, Hesperethusa crenulata; Sol, Schleicheraoleosa; Xx, Xylia xylocarpa; Ge, Grewia eriocarpa; Tt, Terminaliatomentosa; Do, Dalbergia oliveri; Ssi, Shorea siamensis; Hb, Hiptagebenghalensis, Db, Diospyros burmanica; Sn, Strychnos nux-blanda;Bl, Buchanania Lanzan; Dc, Dalbergia cultrata; Dt, Dipterocarpustuberculatus; Mv, Miliusa velutina; Ale, Acacia leucophloea; Ai,Azadirachta indica; Co, Corton sp; Oa, Osyris arborea; Ac, Albizziachinensis; Pm, Pterocarpus macrocarpus;Bra, Bauhinia racemosa; Gs,Gardenia sootepensis;Zj, Ziziphus jujube.
Discussion
Tectona hamiltoniana indicated the highest ecological significantamong the species in the study area. It may be its peculiar characterssuch as strong coppicing power, drought resistant, survival on verypoor infertile soils [19]. Based on the result of species composition, there were 44 species and 23 families at the adult tree level in the study area. In the regards of diameter class, dbh size classes of all forests are examined as reversed J shaped. This situation implies that the younger trees can replace into the mature trees by means of sustainability. By dominating Tectona hamiltoniana with 43% of total tree density and higher numbers of rare species in the PF, the species richness (H’) was lowest and species distribution (E) was uneven in the case of the PF. Based on the PCA, 8 species; Premna pyramidata, Shorea obtuse etc., showed positive correlation with BD. These species have highresistance soil compaction and have a tendency to distribute widely inhigh BD area. The distribution of 13 species such as Terminalia oliveriand Bombax malabaricum indicated negatively correlation with theBD so that these species decrease with increasing BD.
Conclusion
Tectona hamiltoniana is found to be ecological significant speciesin the study area. Mimosaceae is observed to be the most dominantfamily in all stands. The forest will be sustained. In the study area, itis obviously found that soil compaction can dramatically alter speciesdistribution than other soil properties investigated.
References
- Belbin L (1995) ‘A multivariate approach to the selection of biological reserves’. Biodiversity & Conservation 4: 951-963.
- Brozek S, Mulder J, Gruba P, Mulder P, Blonska E, et al. (2010) Development of soil quality indices for natural forest habitats of lowlands and uplands in Poland and its application in silviculture: project description.
- FAO (2012) FRA 2015 Terms and Definitions. Forest Resources Assessment Working Pager 180. 28 pp.
- Lamprecht H (1989) Silviculture in the tropics. Eschborn, Rossdorf, Germany, 296 pp.
- Mishra R (1968) Ecology Work Book, Oxford and IBH, Calcutta.
- Magurran AE (1988) Ecological diversity and it's measurement. Princeton University Press, Princeton, New Jersey, 179 pp.
- Curtis JJ, McIntosh RP (1951) An upland forest continuum in the prairie forest border region of Wisconsin. Ecology 32: 476-496.
- Pielou EC (1975) Ecological Diversity. 165 pp.
- Grassle JF, Smith W (1976) A similarity measure sensitive to the contribution of rare species and its use in investigation of variation in Marine Benthic Communities. Oecologia (Berl.) 25: 13-22.
- Davis LS, Johnson KN (1987) Forest Management, Third ed. McGraw-Hill, New York.
- Pritchett WL (1979) ‘Properties and Management of Forest Soils’. 500 pp.
- Arshad MA, Lowery B, Grossman B (1996) Physical tests for monitoring soil quality. In: Doran, J. W., Jones, A. J. (eds). Methods for assessing soil quality, Macmillan Publishing Company, pp. 123-141.
- Ploeg MV, Dirkse M, Bergman J (2009) Final design report. Team 14: Going green. Engineering 340: 1 - 83.
- Foth HD (1990) Fundamental of Soil Science, 8th Ed. 353 pp.
- Antoine G, Niklaus EZ (2000) ‘Predictive habitat distribution models in ecology'. Ecological Modeling 135: 147-186.
- Mercier P, Chessel D, Doledec S (1992) Complete correspondence analysis of an ecological profile data table: a central ordination method. Acta Oecologica 13: 25-44.
- Tabachnick BG, Fidell LS (1996) Using multivariate statistics (3 rd edition). New York: HarperCollins. Chapter 13.
- McCune B, Grace JB (2002) Analysis of Ecological Communities. 300 pp.
- Minn Y (2007) Genetic diversity within and among populations of Teak (Tectona grandis Linn. f.) and Dahat (Tectona hamiltoniana Wall.) in Myanmar detected by AFLPs and cpSSRs. 70 pp.