Research Article
Studies on Quantitative MorphogeneticalVariations and their Relationship among Wheat Varieties (Triticum aestivum L.)
Sanjay Kumar
Department of Botany, Nagaland University, Lumami 798627, Nagaland, India
Corresponding author: Sanjay Kumar, Department of Botany, Nagaland University, Lumami 798627, Nagaland, India; E-mail: ksanjay79@gmail.com
Citation: Kumar S. Studies on Quantitative Morphogenetical Variations and their Relationship among Wheat Varieties (Triticum aestivum L.). J Plant Sci Res. 2016;3(2): 155.
Copyright © Sanjay Kumar, 2016. This is an open access article distributed under the Creative Commons Attribution License, which permits unrestricted use, distribution, and reproduction in any medium, provided the original work is properly cited.
Journal of Plant Science & Research | ISSN: 2349-2805 | Volume: 3, Issue: 2
Submission: 12/07/2016; Accepted: 09/08/2016; Published: 13/08/2016
Abstract
The morphogenetical characters [number of seeds per inflorescence, seed weight (g), leaf area (cm), shoot length (cm), internode length (cm), root length (cm), shoot biomass fresh weight and dry weight (g-1 FW/DW)] were collected from the three wheat (Triticum aestivum L.) varieties (HUW 234, HUW468 and HUW 533) during March 2007-10 every year. The characters were analyzed for each variety separately and merged together and calculated the similarity index for direct or indirect connection of the characters with each other and between the characters by SPSS ver. 16. The result showed that most of the characters were directly associated with each other for growth and development of the crop plant. The distance matrix was estimated using the similaritymatrix (Pearson correlation). The distance matrix was utilized to predict the circular tree by UPGMA for the association of characters and relationship of wheat varieties and suggested that wheat varieties could be divided into two different groups. The first group included the HUW 533 and second group included the HUW 234 and HUW 468. The Covariance (Cov), total (HT) and mean (HS) heterozygosity, gene differentiation (GST) and gene flow (Nm) were calculated. The GST and Nm was found to be similar with the values 0.875 and 0.0714 respectively in all the varieties which indicated the varietal origin of the HUW 234,HUW 468 and HUW 533 but the Cov, HT and HS showed partial difference which may be due to environmental effect.
Keywords: Circular tree; Dissimilarity index; Quantitative Traits; Similarity index
Introduction
Wheat (Triticum aestivum L.) corresponds to an essential supply of foodstuff and vigor to promptly escalating population of India. It occupies a foremost place in the cropping mold of the nation. Thetotal area under wheat cultivation is 29.8 million hectares with a totalproduction of 86 million tons (estimated 95.91 million tonnes) inIndia. The National Productivity is about 3 tonnes /ha (3075 Kg/ha)in India [1].
The miscellany in earth, type of weather, height above sea level,landscape and geographical separation factors may be persuadedthe enormous range in Indian wheat and their varieties. The different communities and people of an area play an important rolein diversification of a crop. The morphological, biochemical andmolecular diversification of Indian wheat may be the consequence ofgenetic load, hybridization, genetic recombination, spontaneous andartificial blend in varied surroundings [2].
The information of variety trials allocate the plant breeders toknow the evolutionary associations among the varieties along withgermplasm accession to illustrate in a more methodical mannerwhich would be helpful to integrate valuable multiplicity in theirbreeding plan [3].
The range of varieties has been a ground score in expansion of inherent property and resulted in amplification of its prospective forgrain yield. Wheat varieties may be categorized in diverse clustersdepending on their dissimilar function, value and magnitude. Theinformation about the hereditary diversity and genetic relatednessamong the varieties along with selected objects is an essentialcomponent in plant breeding [4].
The assessment of hereditary assortment in wheat may be ondiversity in morphological and agronomic characters or lineageinformation [5]. Cultivar recognition is valuable for relating a newcultivar, complicated genotype wholesomeness and momentum ofsharpness, consistency and steadiness [6]. The digits of techniquesare available at present on hand for scrutiny of genetic mixture in agermplasm attainment, breeding lines and to segregate populations.The techniques are based on ancestry, morphological, agronomicproduction, biochemical and molecular statistics [7]. Molecularpointers are suitable instrument for speedy genetic investigation andpermitting to differentiate solitary allele on or after the others. Thereare several purposeful indicators which have been widened for QTLtogether with a set of PCR markers which was premeditated to tellapart allelic difference at QTL locus. The fundamental informationon genetic systematize of yield and yield apparatus is extremelysupportive to a large extent in manipulation of a breeding program[8].
The prospect of our breeding program depends on the ease ofuse of genetic unevenness to augment yield. The fabrication of wheatproduction in India has been reduced at some stage in modern yearsthan it was in the past. The yield enhancement in wheat diversityhas not been significant in last few years. It may be because of theconstricted genetic pedestal exploitation of the germplasm whichhas been painstaking at the most important grounds. The sustaineddis-improvement in efficiency of yield considered a huge threat forthe reason that of mounting demand by the silent but on the rise ofhuman being general population.
The understanding of the constitution of the Indian wheatcollectively with the bottomless perceptive of the environment andthe level of their variation are vital to capably utilize and marmaladethe present plant matter and it is essential to learn the prospective ofthe obtainable wheat varieties in order to devise planned germplasmimprovement and expansion curriculum expected for constant wheatproduction.
The present studies were carried out to have information on theinheritance of yield and its components in wheat varieties (Triticumaestivum L. var. HUW 234, HUW 468 and HUW 533) developed atIAS, BHU, Varanasi by Pedigree method as shown below.
HUW12× Sparrow→ F1× HUW12→ HUW 234
CPAN1 962×TON1→ LIRA 'S' (F1)× PRL 'S' → HUW 468
Unnath − c − 306× HUW81→ F1× K8027→ HUW 533
The objective of the present article was to analyze morphogeneticdiversity and phylogenetic interrelationship of characters studied inwheat varieties.
Material and Methods
The experiment was set up in the 1st week of October and the data were collected at the end of March 2007-10 during the harvestingtime every year. The average data of yield [number of seeds perinflorescence, seed weight (g)] and quality contributing parameters[leaf area (cm), shoot length (cm), internode length (cm), root length(cm), shoot biomass fresh weight and dry weight (g-1 FW/DW)]often randomly selected plants were recorded. Statistical analyseswere done by SPSS ver. 16 and the interrelationship among the traitsand varieties (Triticum aestivum L. var. HUW 234, HUW 468 andHUW 533) were established using UPGMA method.
Results
The results and calculations on the similarity, dissimilarity,covariance, heterozygosity, gene differentiation, gene flow andcircular tree in Triticum aestivum varieties based on quantitativetraits were presented in Table 1-11 and Figure 1-5.
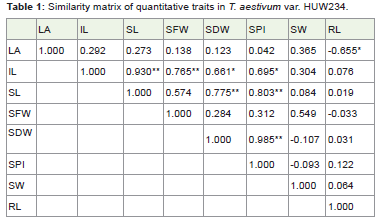
Table 1: Similarity matrix of quantitative traits in T. aestivum var. HUW234.
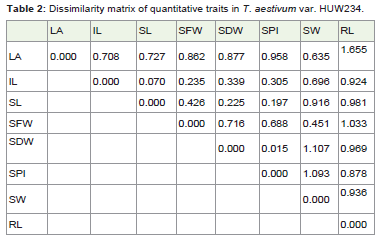
Table 2: Dissimilarity matrix of quantitative traits in T. aestivum var. HUW234.
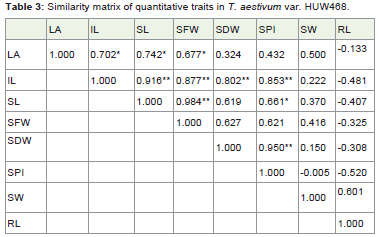
Table 3: Similarity matrix of quantitative traits in T. aestivum var. HUW468.
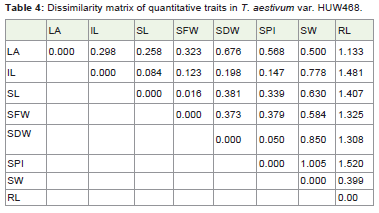
Table 4: Dissimilarity matrix of quantitative traits in T. aestivum var. HUW468.
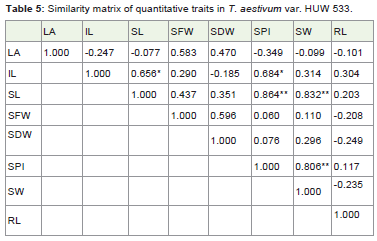
Table 5: Similarity matrix of quantitative traits in T. aestivum var. HUW 533.
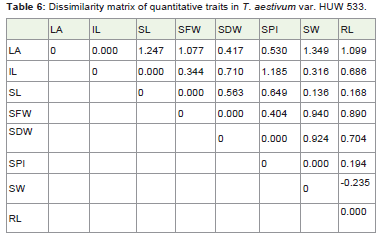
Table 6: Dissimilarity matrix of quantitative traits in T. aestivum var. HUW 533.
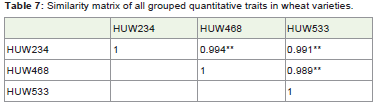
Table 7: Similarity matrix of all grouped quantitative traits in wheat varieties.
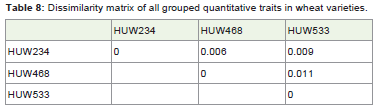
Table 8: Dissimilarity matrix of all grouped quantitative traits in wheat varieties.
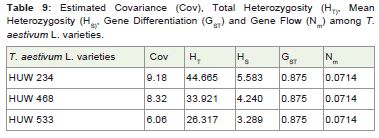
Table 9: Estimated Covariance (Cov), Total Heterozygosity (HT), Mean Heterozygosity (HS), Gene Differentiation (GST) and Gene Flow (Nm) among T. aestivum L. varieties.
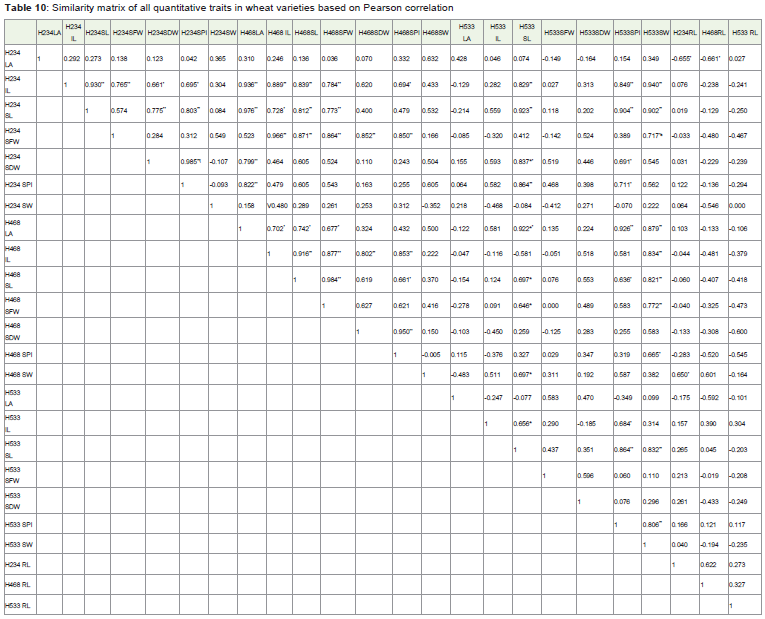
Table 10: Similarity matrix of all quantitative traits in wheat varieties based on Pearson correlation.
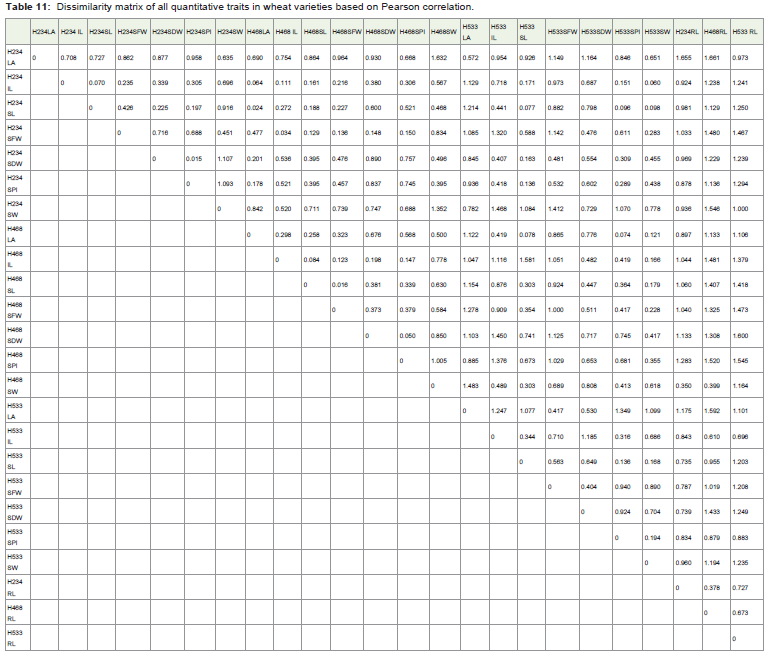
Table 11: Dissimilarity matrix of all quantitative traits in wheat varieties based on Pearson correlation.
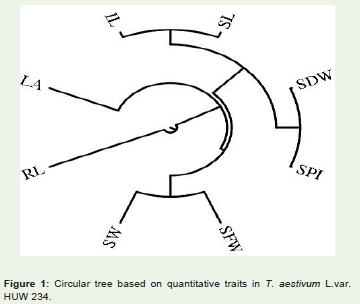
Figure 1: Circular tree based on quantitative traits in T. aestivum L.var. HUW 234.
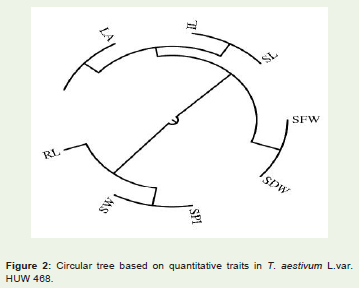
Figure 2: Circular tree based on quantitative traits in T. aestivum L.var. HUW 468.
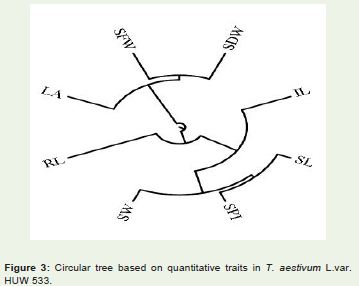
Figure 3: Circular tree based on quantitative traits in T. aestivum L.var. HUW 533.
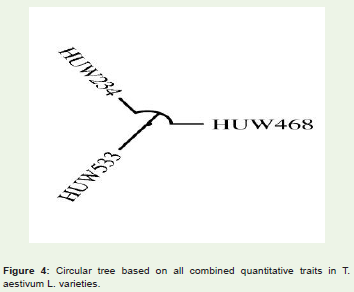
Figure 4: Circular tree based on all combined quantitative traits in T. aestivum L. varieties.
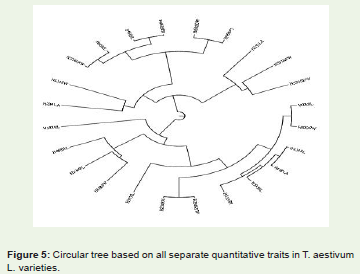
Figure 5: Circular tree based on all separate quantitative traits in T. aestivum L. varieties.
Discussion
Triticum aestivum L. var. HUW 234
The similarity matrix (Table 1) in HUW 234 suggested that Leaf area is negatively correlated with root length (-0.655*) at P≤ 0.05. The internode length is significantly correlated with shoot length (0.930**), seed fresh weight (0.765**), seed dry weight (0.661*) and seeds per inflorescence (0.695*) at (P≤0.05) and (P≤0.01) respectively. Shoot length significantly correlated with Seed dry weight (0.775**) and seeds per inflorescence (0.803**) at P≤0.01. Seed dry weight is significantly correlated with seed per inflorescence (0.985**) at P≤0.01. The positive and highly significant correlation among thetraits indicated that the traits are interdependent to each other fortheir growth and development except the leaf area which is negativelycorrelated and do not dependent on the root length for its increase ordecrease in area.
The distance matrix (Table 2) in HUW 234 suggested that leaf area and shoot length are not correlated with root length with value 1.655 and 1.033 respectively. The seed fresh weight and seed dryweight is not correlated with seed weight with value 1.107 and 1.093respectively. This may be due to the practical error while conductingthe experiment.
The cophenetic correlation coefficient (CP) among the traitsstudied was found 0.064 (Figure 1). The value indicates that the phenotypic relation among the traits studied were very weak. This may be due to the experimental error while collecting the data on the traits studied.
Triticum aestivum L. var. HUW 468
The similarity matrix (Table 3) in HUW 468 suggested that leaf area is significantly correlated with internode length, shoot length and seed fresh weight with values 0.702*, 0.742* and 0.677* respectively at P≤0.05. It suggested the increase in length of internode and shoot with increase in fresh weight of seeds. The internode length showed highly significant values with shoot length, seed fresh weight, seed dry weight and seeds per inflorescence as 0.916**, 0.877**, 0.802** and 0.853** respectively at P≤0.01. The positive and significant values suggested that internode length is directly associated with the growth of shoot length, increase in seeds fresh and dry weight and increase in number of seeds per inflorescence. The shoot length is highly correlated with seed fresh weight (0.984**) at P≤0.01 and seeds per inflorescence (0.661*) at P≤0.05 which indicated the involvement of shoot length to increase the fresh seed weight and number of seeds per inflorescence. The seed dry weight is highly correlated with seeds per inflorescence (0.950**) at P≤0.01 which suggested the direct involvement of seeds dry weight with number of seeds per inflorescence.
The distance matrix (Table 4) in HUW 468 suggested that leaf area, internode length, shoot length, seeds fresh weight, seeds dry weight and seeds per inflorescence are uncorrelated with root length with value 1.133, 1.481, 1.407, 1.325, 1.308 and 1.520 respectively. This may be due to the practical error while conducting the experiment.
The cophenetic correlation coefficient (CP) among the traitsstudied was found 0.436 (Figure 2). The value indicates that the phenotypic relation among the traits studied were good to increase and development of the plant.
Triticum aestivum L. var. HUW 533
The similarity matrix (Table 5) in HUW 533 suggested that internode length showed significant values with shoot length and seeds per inflorescence as 0.656* and 0.684* respectively at P≤0.05. The positive and significant values suggested that internode length is directly associated with the growth of shoot length and increase in number of seeds per inflorescence. The shoot length is highlycorrelated with seeds per inflorescence (0.864**) and seed weight(0.832**) at P≤0.01 which indicated the involvement of shoot lengthto increase number of seeds per inflorescence and weight of the seeds.The seeds per inflorescence is correlated with seed weight (0.806**) atP≤0.01 which suggest that as the number of seeds per inflorescenceincrease the weight of seeds would increase proportionally.
The distance matrix (Table 6) in HUW 533 suggested that leaf area is not correlated with shoot length, seeds fresh weight, seed weight and root length with value 1.247, 1.077, 1.349 and 1.099respectively. The internode length is uncorrelated with seeds perinflorescence with the value 1.185. This may be due to the practicalerror while conducting the experiment.
The cophenetic correlation coefficient (CP) among the traitsstudied was found 0.819 (Figure 3). The value indicates that the phenotypic relation among the traits studied were very good and associated with development of the plant.
The similarity matrix (Table 7) of pooled traits (all the traits combined together) among wheat varieties suggested that all the three varieties were highly correlated with each other on the traits studied and very negligible distances (Table 8) among the wheat varieties were found. Also, CP among the wheat varieties were high with a value of 0.917 which suggested that there may not be morphologically or genetically much differences among the wheat varieties (Figure 4).
The gene differentiation and gene flow was calculated and foundno difference with a value of 0.875 and 0.0714 respectively whilecovariance, total and mean heterozygosity showed some certainvariation among the wheat varieties (Table 9).
Correlation of individual characters in T. aestivum L. var.HUW 234 with HUW 468 and HUW 533
The similarity and disdimilarity matrix of individual characters ortraits of HUW 234, HUW 468 and HUW 533 were presented (Table 10,11). The leaf area of HUW234 is negatively correlated with root length of HUW 468 at P≤0.05 which suggest that increase in the leafarea decreases the root length. The internode length of HUW 234 ispositively correlated with leaf area, internode length, shoot length,seeds fresh weigth at P≤0.01, number of seeds per inflorescence atP ≤0.05 with HUW 468 and shoot length, number of seeds perinflorescence, seed weight with HUW 533 at P≤0.01 which showedthat internode length is an important character for overall growth ofthe plant. The shoot length of HUW 234 has direct effect on the leafarea, shoot length, seed fresh weight at P≤0.01, and internode lengthat P≤0.05 with HUW 468 and shoot length, number of seeds perinflorescence and seed weight at P≤0.01 of HUW 533 which showedthat shoot length is an important character for overall growth of theplant. The seeds fresh weight (HUW234) showed positive correlationwith internode length, shoot length, seed fresh weight, seed dryweight, number of seeds per inflorescence at P≤0.01 of HUW468.The seed dry weight (HUW 234) is directly associated with numberof seeds per inflorescence (HUW533 at P≤0.05), leaf area HUW 468at P≤0.01, shoot length HUW 533 at P≤0.01. The number of seeds per inflorescence (HUW234) may be similar in growth of leaf area(HUW 468 at P≤0.01), shoot length (HUW 533 at P≤0.01) andnumber of seeds per inflorescence(HUW 533 at P≤0.05). The seedweight (HUW234) showed the correlation with number of seeds perinflorescence (HUW468 at P≤0.05) and seed weight (HUW 533 atP≤0.05).
Correlation of individual characters in T. aestivum L. var.HUW 468 with HUW 533 and HUW 234
The leaf area (HUW468) showed association with shoot length,number of seeds per inflorescence and seed weight of HUW 533 atP≤0.01. The internode length (HUW 468) showed similarity withseed weight (HUW 533 at P≤0.01). The shoot length (HUW 468)is associated with shoot length, number of seeds per inflorescence(HUW 533 at P≤0.05) and seed weight (HUW 533 at P≤0.01). Theseed fresh weight (HUW468) showed association with shoot length atP≤0.05 and seed weight at P≤0.01 of HUW533. The number of seedsper inflorescence (HUW 468) showed connection with seed weight ofHUW533 at P≤0.05. The seed weight (HUW 468) is in line with shoot length (HUW533 at P≤0.05) and root length (HUW234 at P≤0.05).
Since the characters influencing the growth parameters withinand among the varieties, it may be suggested that a small part ofgenome contains the genes for other variety (as all are the samespecies) such as HUW 234 contains a part of HUW 468 or HUW 533and vice versa.
The cophenetic correlation coefficient (CP) among the traitsstudied was found 0.576 (Figure 5). The value indicates that the overall phenotypic relation among the traits studied were approximately good for growth and development of the plant.
The degree of variation was high for all the traits studied at P≤0.05and P≤0.01. The results were obtained are in accordance with reportsof others [9-15]. Morphological characters possibly will be used for evaluate genetic diversity but are influenced by the atmosphere. The diverse gene action like additive gene action and partial dominance with additive gene action may be involved in crop shoot length, internode length, leaf area, root length, seed weight, grain yield and most of other yield components in wheat [16]. The deviation of characters in crop might be genetic or environmental but the deviation supposed to be heritable since the competence of plant assortment primarily depends on additive genetic variance, management of the environment and the interface between genotype and environment [17]. Therefore, the evaluation of genetic differences may be critical for varietal improvement and genetic reserve protection [18].
The close kinship was observed among the varieties bothin morphological and genetic characteristics (Table 7-9). Theoccurrence of close resemblance among the varieties may be due tothe gene exchange among them [19]. Inbreeding and genetic drift may influence the crops vigor by increasing the appearance of recessive lethal alleles and enhance the homozygosity among the undersized population of crops. Genetic drift could be anticipated to decrease distinction within small population of crops and causes loss of low frequency alleles which ultimately associated with the fitness of thecrops.
Therefore, it may be concluded that the genetic factors (inbreeding,genetic drift, demography, species life history, biogeography andgene flow) play a significant role in estimating the modern geneticcomposition of crop populations with genetic exchange, geneticdifferentiation, heterozygosity and gene flow among them [20].
References
- DWR (2014) Wheat scenario-A snippet. Issue 2, Directorate of Wheat Research (DWR), India.
- El-Mohsen AA, Hegazy SRA, Taha MH (2012) Genotypic and phenotypic interrelationships among yield and yield components in Egyptian bread wheat genotypes. Journal of Plant breeding and Crop Science 4: 9-16.
- Mekonnon B, Lakew B, Dessalegn T (2015) Morphological diversity and association of traits in ethiopian food barley (Hordeum vulgare L.) landraces in relation to regions of origin and altitudes. Journal of Plant Breeding and Crop Sciences 7: 44-54.
- Zhu Y, Chen H, Fan J, Wang Y, Li Y, et al. (2000) Genetic diversity and disease control in rice. Nature 406: 718-722.
- Salem KFM, El-Zanaty AM, Esmail RM (2008) Assessing wheat (Triticum aestivum L.) genetic diversity using morphological characters and microsattelite markers. World journal of Agricultural Sciences 4: 538-544.
- Sun H, Lu J, Fan Y, Zhao Y, Kong F, et al. (2008) Quantitative trait loci (QTLs) for quality traits related to protein and starch in wheat. Prog Nat Sci 18: 825-831.
- Mohammadi SA, Prasanna BM (2003) Analysis of genetic diversity in crop plants salient statistical tools and considerations- Review and interpretation. Crop Science 43: 1235-1248.
- Talebi R, Fayaz F, Karami E (2012) Morphometric and amplified fragment length polymorphism marker analysis in some landrace wheat (Triticum aestivum) genotypes collected from north-west Iran. Environ Exp Biol 10: 49-56.
- Annicciarico P, Royo C, Bellah F, Moragues M (2009) Relationships among adaptation patterns, morphophysiological traits and molecular markers in durum wheat. Plant Breeding 128: 164-171.
- Altintas S, Toklu F, Kafkas S, Kilian B, Brandolini A, et al. (2008) Estimating genetic diversity in durum and bread wheat cultivars from Turkey using AFLP and SAMPL markers. Plant Breeding 127: 9-14.
- Akar T, Yazar S, Donmez E, Avci M, Dusunceli F (2007) Current status of national winter wheat breeding in Turkey. Journal Agric Res 45: 1-8.
- Mishra R, Baenziger PS, Russell WK, Greybosch RA, Baltensperger DD, et al. (2006) Crossover interactions for grain yield in multienvironmental trials of winter wheat. Crop Sci 46: 1291-1298.
- Bilgin O, Korkut K Z (2005) Determination of some bread quality and grain yield characters in Bread wheat (Triticum aestivum L.). International Journal of Agriculture and Biology 7: 125-128.
- Fufa H, Baenziger PS, Beecher BS, Greybosch RA, Eskridge KM, et al. (2005) Genetic improvement trends in agronomic performances and end use quality characteristics among hard red winter wheat cultivars in Nebraska. Euphytica 144: 187-198.
- Karagoz A, Zencirci N (2005) Variation in wheat landraces from different altitudes of three regions of Turkey. Genetic Resources and Crop Evolution 52: 775-785.
- Savii G, Nedelea G (2012) Estimation of interrelationships among different yield traits in winter wheat. J Horticult For Biotechnol 16: 115-118.
- Gulnaz S, Khan SH, Shahzad M, Ashfaq M, Sajjad M (2012) Genetic evaluation of spring wheat (Triticum aestivum L.) germplasm for yield and seedling vigor traits. Journal Agric Soc Sci 8: 123-128.
- Singh G, Khan MH, Bhan SK (2008) Genetic divergence in wheat (Triticum aestivum L.). New Botanist-Int J Plant Sci Res 35: 81-88.
- Gaskin JF, Shafroth PB (2005) Hybridization of Tamarix ramosissima and T. chinensis with T. aphylla in the south western USA determined from DNA sequence data. Madrono 52: 1-10.
- Ijbari H, Sheidai M, Mehrabian AR, Noormohammadi Z, Ghasemzadeh-Baraki S (2014) K-means clustering and STRUCTURE analysis of genetic diversity in Tamarix L. accessions. Turk J Bot 38: 1080-1094.