Research Article
Separation and Quantification of PhenolicCompounds of Wild Edible Plants
Khalil I Ereifej1,2, Hao Feng2, Taha Rababah3, Muhammad Aludatt2, Sana Gammoh2, Layal I Oweis2 , 4Malek Alkasrawi
1Department of Food Science and Human Nutrition, University of Illinois, Urbana-Champaign, 1304 West PennsylvaniaAvenue, Urbana, IL 61801, USA
2 Department of Nutrition and Food Technology, Jordan University of Science and Technology, Irbid 22110, Jordan
3A visiting Scientist from the Department of Food Science and Human Nutrition, Jordan University of Science and Technology,P.O. Box 3030, Irbid 22110, Jordan
4Engineering Department, Stevens Point University of Wisconsin, Stevens Point, USA
Corresponding author: Khalil I Ereifej, Department of Food Science and Human Nutrition, University of Illinois, Urbana-Champaign, 1304 West Pennsylvania Avenue, Urbana, IL 61801, USA; E-mail: kereifej@illinois.edu or ereifej@just.edu.jo
Citation: Ereifej KI, Feng H, Rababah T, Alu’datt M, Gammoh S, et al. Separation and Quantification of Phenolic Compounds of Wild Edible Plants. JPlant Sci Res. 2015;2(2): 139.
Copyright © 2015 Ereifej KI, et al. This is an open access article distributed under the Creative Commons Attribution License, which permits unrestricted use, distribution, and reproduction in any medium, provided the original work is properly cited.
Journal of Plant Science & Research | ISSN: 2349-2805 | Volume: 2, Issue: 2
Submission: 04/11/2015; Accepted: 03/12/2015; Published: 08/12/2015
Abstract
Ten wild edible plants were subjected to analysis. Individual phenolic compound concentration and the percentage from total phenolic compounds were pursued using RP-HPLC. Results showed that ten phenolic compounds (gallic, protocatechuic, catechin, gentisic, chlorogenic, vanillic, syrnigic, caffeic, epicatechin and benzoic acid) have been identified in the investigated plants. The highest catechin (300.9 mg/100g) (Ruta chalepensisL.) which is equivalent to 27.18% of total phenolic compounds, gallic acid (361.2 mg/100g) (Ruta chalepensis L.) which counts for 33.65% of total phenolics, chlorogenic acid (17.2mg/100g) (Ruta chalepensis L.) (1.29%) and caffeic acid (137.5 mg/100g) (Centaurea iberica Trev.ex.Spreng) (36.3%). The lowest concentrations were found in Ruta chalepensis L. (7.69%). Centaurea iberica Trev.ex.Spreng contains the highest concentrations of protocatechuic acid (32.5 mg/100g) (6.19%). Caffeic acid (105.8 mg/100g) (Ruta chalepensis L.) (7.96%). No vanillic acid, caffeic acid and benzoic acid were detectable in Arum palaestinum Boiss.
Keywords: Wild edible plants; Total phenolics; phenolic compounds; RP-HPLC
Introduction
Fats, oils and lipid-based foods deteriorate through severaldegradation reactions, while the main deterioration processes areoxidation reactions and the decomposition of oxidation products,which result in decreased nutritional value and sensory quality.Retardation of these oxidation processes is important, and can beachieved using specific additives have the ability to inhibit oxidation,known as antioxidants [1].
Natural antioxidants are in high demand because of theirpotential in health promotion and disease prevention, and consumeracceptability [2]. Great efforts have been made in finding naturally occurring antioxidants of plant origin, thus many plant phenoliccompounds exhibiting antioxidant properties have been studied andproposed for protection against oxidation [3].
Wild plants play an important role in the diet of inhabitantsin different parts of the world. The investigated plants tend to bedrought-resistant, gathered both in times of abundance and timesof need and used in every day cooking [4]. Many of these plants arenutritionally important because of their high vitamin, mineral andfiber contents.
In Jordan, large numbers of wild edible plants are widelydistributed and consumed in various ways [5]. The soft pods andseeds of Tetragonolobus palaestinus Boiss. (Jalaton is the local name) which is a wild dry legume species found in the highlands of Jordan,are consumed by Jordanian people before it reaches the dry stage [6].
Wild plants are also used in folk medicine as antiscorbutic,antispasmodic, carminative agents against bronchitis and as diuretics[7]. In Saudi Arabia, the aerial parts of Ruta chalepensisL. are usedas an analgesic, antipyretic and for the treatment of rheumatism andmental disorders [8].
The overall objective of our research was to identify types andconcentrations of these phenolic compounds using RP-HPLC insome wild edible plants from Jordan.
Materials and Methods
Plant Material
About 3 kg of each of wild edible plant (Arum palaestinumBoiss., Centaureaiberica Trev. ex. Spreng., Cichorium intybus L.,Coriandrum sativum L., Gundelia tournefortii L., Malva parviflora L.,Rumex acetosella L., Ruta chalepensis L., Salvia hierosolymitana Boiss.,Salvia hierosolymitana Boiss. and Tetragonolobus palaestinusBoiss.)were purchased from local stores, or has been collected them fromvarious regions in Ajloun region [9]. All plants were obtained at thetime of optimal growing conditions during the months of Marchand April. The scientific and local names were identified accordingto two references [6,10]. The plants were washed and rinsed with tapwater and followed by rinsing with distilled water and left for dryingat room temperature. The dried plants were mined into an average 0.4mm diameter particle. The plants grounded and preserved in ziplocbags and kept at -18 °C, until further use.
Chemicals
Acetonitrile and all chemicals were of HPLC analytical grade.HPLC standards, caffeic acid (3-4-Dihydroxycinnamic acid), benzoicacid, vanillic acid (4-hydroxy-3-methoxybenzoic acid), gentisicacid (2,5-dihydroxybenzoic acid), gallic acid, chlorogenic acid,protocatechuic acid (3,4-dihydroxybenzoic acid), syrnigic acid,(+)-catechin, (-)-epicatechin, and all other chemicals and reagentswere of HPLC grade and were purchased from local agent. Allsolutions were prepared using deionized water.
Phenolic compounds extraction
Phenolic compounds extraction method was done on accordingto previously reported method [11]. Approximately a replicate of 5g of each individual plant were subjected to extraction with 50 ml ofmethanol. The extraction conditions were performed at 60 °C and60 minutes under continuous stirring. A Whatman No. 3 filter paperwas used to filter the extract into a 50 ml volumetric flask and placedin a dark place until analysis.
Determination of total phenolics
The Folin-Ciocalteu procedure was adopted in this work fortotal phenolic content in the extracts [12]. A tow replicates (50 μL of the plant extract) were transferred and mixed into a glass test tube containing 0.4 ml of 10 % Folin-Ciocalteu reagent for three minutes, followed by addition of 0.8 ml of a 10 % sodium carbonate (Na2CO3). The mixture in the tubes were allowed to stand for 1 hour at ambient temperature, and the light absorption was measured at 725 nm using spectrophotometer (CELL, model CE 1020, England) against a blank containing 50 μl methanol in place of plant extract. A gallic acid wasused as calibration standard, and the results were calculated accordingto gallic acid equivalent (GAE) (mg/100g dry weight basis).
RP-HPLC separation and quantification of phenoliccompounds
The content of phenolic compounds in plant samples wasdetermined by High-Performance Liquid Chromatography(HPLC). About five grams of each plant sample were weighed out,and extracted with 50 ml of methanol. Extraction was carried outunder stirring for 60 minutes, at 60 °C. Each extract was filtered outusing Whatman No. 3 filter paper, and filled accordingly in a 50 mlvolumetric flask. Each extract was vacuum-concentrated at 40 °C upto dryness and then re-dissolved in 25 ml of mobile phase solvent B(0.1 % triflouroacetic acid in water). Each solution was centrifuged toget the supernatant. 25 μL aliquot of the supernatant were injectedinto the High Performance Liquid Chromatography (HPLC), and theanalysis was performed after.
The chromatographic equipment consisting of an interfaceD-7000, diode array detector L-7455, autosampler L-7200, PumpL-7150, solvent degasser L-7612 and a reversed phase column (C18RP 0.5 μ column). All of these parts belong to Merck Hitachi. ThermoGOH, 150 × 4.6 mm. The chromatographic conditions were modified[13]. The mobile phase consisted of solvents A and B. Solvent Awas 0.1% triflouroacetic acid in 10 % acetonitrile, solvent B was0.1% triflouroacetic acid in water. Initial solvent conditions and theflow rate were set as follow: time started from zero, 50, 51, 65, 66and 85 minutes. Solvent A started at 100, 100, zero, zero, 100 and100% corresponding to time. Solvent B started at zero, zero, 100,100,zero and zero% corresponding to time. The flow rate (mL/min)started at 1.0, 1.0, 1.5, 1.5, 1.0 and 1.0 mL/min at the correspondingtime. Column temperature was maintained at ambient temperaturethroughout the run. Phenolic compounds peaks were identified bytheir HPLC retention times at 234 nm.
The stock solution of ten phenolic compounds was preparedat 1.0 mg/100 mL in methanol. From this solution, four standardsolutions were prepared by dilution. These were used to preparethe calibration curves. Ten calibration curves were constructedcovering the concentration range from 5-50 ppm, with (r) valuesfor gallic acid amounting 0.9980, protocatechuic acid and syrnigicacid 0.9973, catechin and vanillic acid 0.9975, gentisic acid 0.9979,chlorogenic acid 0.9978, caffeic acid 0.9974, epicatechin 0.9972 andfor benzoic acid 0.9957. The calibration graphs were used to calculatethe phenolic compounds concentrations in plant samples. Phenoliccompounds were identified by comparing their retention time withthat of the standard. For each phenolic compound, the concentrationin mg/100g of dry sample was computed according the following:
Concentration (mg/100g) = Concentration in ppm × (1/1000) ×(F.V/ S. wt.) × 100,
Where: F.V = Final Volume, S. wt. = Sample weight.
Statistical analysis
The statistical analysis was performed in SAS software Version8.2 software package using the general linear model procedure andthe data are presented as means of two replicates [14]. Significant differences were defined at p ≤ 0.05 and the analysis of Variance(ANOVA) was used to compare the means of the presented data.
Results and Discussion
Total phenolics
The total phenolic compounds concentration found in theplants Arum palaestinum Boiss., Centaureaiberica Trev. ex Spreng.,Cichorium intybus L., Coriandrum sativum L., Gundelia tournefortiiL., Malva parviflora L., Rumex acetosella L., Ruta chalepensis L.,Salvia hierosolymitana Boiss. and Tetragonolobus palaestinus Boiss.was 1010.6, 379.8, 598.6, 936.0, 375.5, 204.4, 543.2, 1328.8, 911.1,163.1 mg GAE/100g dry weight, respectively [9].
Ruta chalepensis showed significantly higher concentrations oftotal phenolics (1328.8 mg GAE/100g) as compared with CoriandrumsativumL. (936 mg GAE/100g) and Salvia hierosolymitana (911.1 mgGAE/100g). Arum palaestinum Boiss. contained higher amount oftotal phenolics as compared with Cichorium intybusL., CoriandrumsativumL., Rumex acetosellaL. and Salvia hierosolymitana Boiss.
HPLC identification and quantification of phenoliccompounds
Figure 1,2,3,4 and 5 and 5 show the HPLC chromatograms of theprincipal phenolic compounds for ten wild edible plants from Jordan.The phenolic compounds which were identified were; gallic acid,protocatechuic acid, catechin, gentisic acid, chlorogenic acid, vanillicacid, syrnigic acid, caffeic acid, epicatechin and benzoic acid. Thepeaks of these compounds were recorded at 234 nm and identifiedby comparison with internal standards. Figure 1,2,3,4 and 5 also show the HPLC chromatogram for the standard phenolics and theidentified phenolic compounds in the investigated plants. Table 1shows data on the principal phenolic compounds concentrations.Data shown in Table 1, indicated variability in quantitative andqualitative composition of phenolic compounds in all plants. Totalphenolic compounds concentration was higher in Ruta chalepensisL. as compared with the other plants. As shown in Table 1 gallic acid concentrations ranged between 1.1 and 361.2 mg/100g. The lowest concentration was found in Gundelia tournefortiiL. and the highest in Ruta chalepensisL. Gallic acid was the main component in the extractsof Arum palaestinum Boiss, Malva parvifloraL., Rumex acetosellaL.,Ruta chalepensisL. and Tetragonolobus palaestinusBoiss. These dataagree well with data reported on gallic acid as a major phenoliccompound in Barringtonia racemosa, Cassia auriculata L., Euphorbiahirta L. and Feronia elephantum Correa [15]. Protocatechuic acid concentrations ranged between 0.3 (Salvia hierosolymitanaBoiss) and 23.5 mg/100g (Centaurea ibericaTrev.ex.Spreng). All other plants had intermediate values. These values were lower than those detected in Sumac (Rhus coriaria L.) (40 mg/100g) [16].
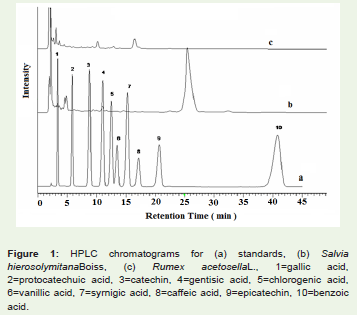
Figure 1: HPLC chromatograms for (a) standards, (b) Salvia hierosolymitanaBoiss, (c) Rumex acetosellaL., 1=gallic acid, 2=protocatechuic acid, 3=catechin, 4=gentisic acid, 5=chlorogenic acid, 6=vanillic acid, 7=syrnigic acid, 8=caffeic acid, 9=epicatechin, 10=benzoic acid.
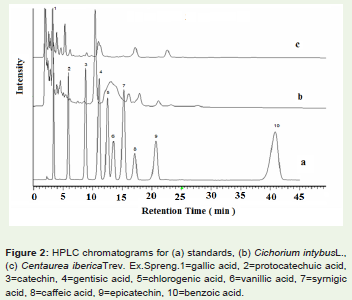
Figure 2: HPLC chromatograms for (a) standards, (b) Cichorium intybusL., (c) Centaurea ibericaTrev. Ex.Spreng.1=gallic acid, 2=protocatechuic acid, 3=catechin, 4=gentisic acid, 5=chlorogenic acid, 6=vanillic acid, 7=syrnigic acid, 8=caffeic acid, 9=epicatechin, 10=benzoic acid.
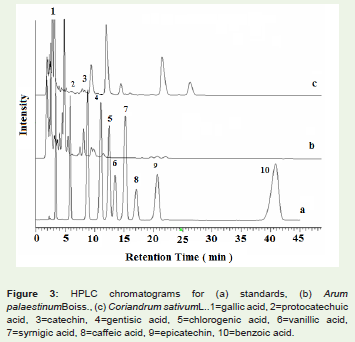
Figure 3: HPLC chromatograms for (a) standards, (b) Arum palaestinumBoiss., (c) Coriandrum sativumL..1=gallic acid, 2=protocatechuic acid, 3=catechin, 4=gentisic acid, 5=chlorogenic acid, 6=vanillic acid, 7=syrnigic acid, 8=caffeic acid, 9=epicatechin, 10=benzoic acid.
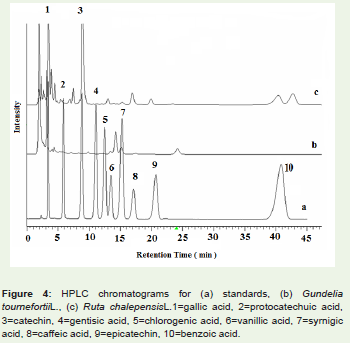
Figure 4: HPLC chromatograms for (a) standards, (b) Gundelia tournefortiiL., (c) Ruta chalepensisL.1=gallic acid, 2=protocatechuic acid, 3=catechin, 4=gentisic acid, 5=chlorogenic acid, 6=vanillic acid, 7=syrnigic acid, 8=caffeic acid, 9=epicatechin, 10=benzoic acid.
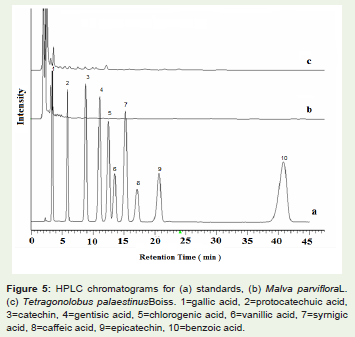
Figure 5: HPLC chromatograms for (a) standards, (b) Malva parvifloraL. (c) Tetragonolobus palaestinusBoiss. 1=gallic acid, 2=protocatechuic acid, 3=catechin, 4=gentisic acid, 5=chlorogenic acid, 6=vanillic acid, 7=syrnigicacid, 8=caffeic acid, 9=epicatechin, 10=benzoic acid.
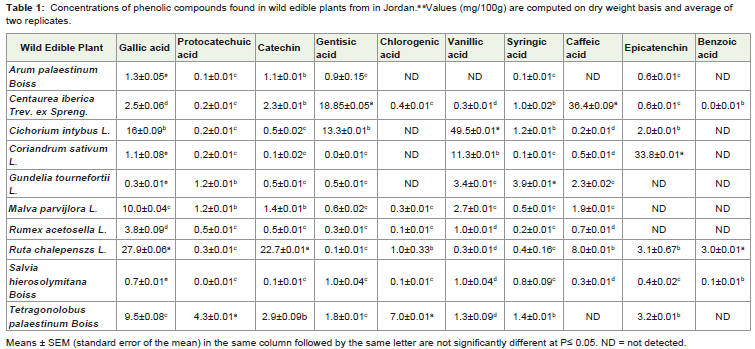
Table 1: Concentrations of phenolic compounds found in wild edible plants from in Jordan.a aValues (mg/100g) are computed on dry weight basis and average of two replicates.
Catechin concentration represented an important share to thephenolic compounds in Ruta chalepensis (300.9 mg/100g) (Table1). Catechin concentration of Ruta chalepensisL. was comparable tothat detected in the leaves of max red bartlett cultivar of pears (Pyruscommunis L.) (305 mg/100g) (17). Chlorogenic acid concentrationsranged between 0.5 (Salvia hierosolymitanaBoiss.) and 17.2 mg/100g(Ruta chalepensisL.). Centaurea iberica Trev.ex.Spreng, MalvaparvifloraL., Rumex acetosellaL. and Salvia hierosolymitana Boiss.concentrations of chlorogenic acid were all higher than those reportedon the peels and flesh of apple fruit (Malus domestica Borkh., cv.Aroma) (6.5 and 15.1 mg/100g, respectively) [18]. Chlorogenic acidwas not detected in Arum palaestinumBoiss., Cichorium intybusL.,Coriandrum sativumL. and Gundelia tournefortiiL.
Vanillic acid was the main constitutive component in Cichoriumintybus L. (296.4 mg/100g), with a value higher than that found insumac (Rhus coriaria L.) (50 mg/100g) [16]. Caffeic acid was the maincomponent in the extract of Centaurea ibericaTrev.ex.Spreng (137.5mg/100g) (Table 1). The concentration of other phenolic compoundsin Centaurea ibericaTrev.ex.Sprengwas not as high as caffeic acid.The content of gentisic acid was 71.6 mg/100 g, protocatechuic acid concentration was 23.5 mg/100g. Ruta chalepensis found to behigh in caffeic acid (105.8 mg/100g) as compared with other plants.Centaurea iberic Trev.ex.Sprenga and Ruta chalepensisL. caffeicacid concentrations were higher than those reported on Silybummarianum, Taraxacum officinale, Archangelica officinalis andHerniara glebra (92.8, 72.6, 85.3 and 78.1 mg/100g, respectively) [19].All other plants contain lower concentrations of caffeic acid (0.9 to8.6 mg/100g) than those detected in different tomatoes (Lycopersiconesculentum Mill.) cultivars (13.9 to 24.1 mg/100g) [20].
Epicatechin was the main phenolic in Coriandrum sativumL.(316.0 mg/100g), a value that is higher than that detected in the leavesof Williams cultivar of pears (Pyrus communis L.) (219 mg/100g)[17]. Epicatechin was not detected in Gundelia tournefortii, MalvaparvifloraL. and Rumex acetosellaL.. Epicatechin concentrationsof Arum palaestinumBoiss, Centaurea iberica Trev.ex.Spreng., Ruta chalepensisL, Salvia hierosolymitanaBoiss and TetragonolobuspalaestinusBoiss were lower than those found in Filipendula vulgaris(35 mg/100g), Aruncus silvester (50 mg/100g), Waldsteinia geoides(54 mg/100g), Potentilla alba (132 mg/100g) and Geum rivale (4mg/100g) [21]. Cichorium intybus L. (11.6 mg/100g) found to havesimilar concentration of epicatechin as that of the Red Globe cultivarof grapes (11.6 mg/100g) [22].
It was found that the highest levels were for gallic acid (27.81%,Ruta chalepensis L.), prutocatechuic acid (6.19 %, Centaurea ibericaTrev.ex.Spreng), Catechin (22.65%, Coriandrum sativum L., gentisicacid (18.85%, Centaurea iberica Trev.ex.Spreng), chlorogenic acid (6.99%, Tetragonolobus palaestinusBoiss), vanillic acid (49.52 %,Cichorium intybus L.), syringic acid (3.84%, Gundelia tournefortiiL.),caffeic acid (36.2%, Centaurea iberica Trev.ex.Spreng), epicateuchinacid (33.76%, Coriandrum sativum L.) and benzoic acid (3.03%,Coriandrum sativum L.). Moreover,Ruta chalepensis L. has thehighest levels of gallic acid, catechin and benzoic acid. These dataagree very well with data reported previously on some Mediterraneanplants [23].
In conclusion, RP-HPLC results showed the plants containedseveral phenolic compounds: gallic acid, protocatechuic acid,catechin, gentisic acid and syrnigic acid presented the predominatingcompounds. Jordanian wild plants are valuable in antioxidantcomponents, which can be applied in food systems and pharmaceuticalproducts. More work should be done to evaluate phenolic compoundsand their antioxidants activity for greater number of plants grown inthe wilderness of Jordan, in order to create nutritional and medicinalreference for these plants and to evaluate their health benefits.
Acknowledgment
The authors would like to acknowledge the financial support ofthe Scientific Research Deanship at Jordan University of Science andTechnology.
References
- Yanishlieva-Maslarova NV, Heinonen IM (2001) Sources of natural antioxidants: vegetables, fruits, herbs, spices and teas. Antioxidants in food-eds. Pokorný J, Yanishlieva N, Gordon M, CRC Press, Boca Raton FL. 210-263.
- Su L, Yin J, Charles D, Zhou K, Moore J, et al. (2007) Total phenolic contents, chelating capacities, and radical-scavenging properties of black peppercorn, nutmeg, rosehip, cinnamon and oregano leaf. Food Chem 100: 990-997.
- Maisuthisakul P, Suttajit M, Pongsawatmanit R (2007) Assessment of phenolic content and free radical-scavenging capacity of some Thai indigenous plants. Food Chem 100: 1409-1418.
- Turan M, Kordali S, Zengin H, Dursun A, Sezen Y (2003) Macro and micro mineral content of some wild edible leaves consumed in eastern Anatolia. Acta Agr Scand 53: 129-137.
- Tukan S, Takuri H, al-Eisawi D (1998) The use of wild edible plants in the Jordanian diet. Int J Food Sci Nutr 49: 225-230.
- Ereifej KI (2004) Seed characteristics of wild legume (Tetragonolobus palaestinus) as compared with Lens culinaris and Pisum sativum. Int J Food P 7: 639-646.
- Koedam A (1986) Volatile oil composition of Greek mountain tea (Sideritis spp.). J Agr Food Chem 36: 681-684.
- Iauk L, Manganoa K, Rapisarda A, Ragusa S, Maiolino L, et al. (2004) Protection against murine endotoxemia by treatment with Ruta chalepensis L., a plant with anti-inflammatory properties. J Ethnopharmacol 90: 267-272.
- Ereifej KI, Feng H, Rababah T, Almajwal A, Alu’datt M, et al. (2015) Chemical composition, phenolics anthocyanins concentration and antioxidant activity of ten wild edible plants. Food Nutr Sci 6: 583-590.
- Al-Eisawi D (1998) Field guide to wild flowers of Jordan and neighboring countries. Jordan Press Foundation. Jordan.
- Perva-Uzunalić A, Škerget M, Knez Z, Weinreich B, Otto F, et al. ((2007) Extraction of active ingredients from green tea (Camellia sinensis): Extraction efficiency of major catechins and caffeine. Food Chem 96: 597-605.
- Singleton V, Rossi J (1965) Colorimetry of total phenolics with phosphomolybdic-phosphotungstic acid reagents. Am J Enol Vitic 16: 144-158.
- Rababah T, Hettiarachchy N, Horax R (2004) Total phenolics and antioxidant activities of fenugreek, green tea, black tea, grape seed, ginger, rosemary, gotu kola, and ginkgo extracts, vitamin E, and tert-Butelhydroquinone. J Agr Food Chem 52: 5183-5186.
- SAS (2002). User’s Guide, Release 8.2 ed., Cary, NC: SAS Institute Inc.
- Surveswaran S, Cai Y, Corke H, Sun M (2007) Systematic evaluation of natural phenolic antioxidants from 133 Indian medicinal plants. Food Chem 102: 938-953.
- Kosar M, Bozan B, Temelli F, Baser K (2007) Antioxidant activity and phenolic composition of sumac (Rhus coriaria L.) extracts. Food Chem 103: 952-959.
- Andreotti C, Costa G, Treutter D (2006) Composition of phenolic compounds in pear leaves as affected by genetics, ontogenesis and the environment. Sci Hortic 109: 130-137.
- Hagen S, Borge G, Bengtsson G, Bilger W, Berge A, et al. (2007) Phenolic contents and other health and sensory related properties of apple fruit (Malus domestica Borkh., cv. Aroma): Effect of postharvest UV-B irradiation. Postharvest Biol Tec 45: 1-10.
- Wojdy A, Oszmianski JM, Czemerys R (2007) Antioxidant activity and phenolic compounds in 32 selected herbs. Food Chem 105: 940-949.
- Luthria D, Mukhopadhyay S, Krizek D (2006) Content of total phenolics and phenolic acids in tomato (Lycopersicon esculentum Mill.) fruits as influenced by cultivar and solar UV radiation. J Food Compos Analy 19: 771-777.
- Oszmianski J, Wojdy A, Lamer-Zarawska E, Swiader K, et al. (2007) Antioxidant tannins from Rosaceae plant roots. Food Chem 100: 579-583.
- Liazid A, Palma M, Brigui J, Barroso C (2007) Investigation on phenolic compounds stability during microwave-assisted extraction. J Chromatogr A 1140: 29-34.
- Rababah TM, Ereifej KI, Esoh RB, Al-udatt MH, Alrababah MA (2011) Antioxodant activities, total phenolics and HPLC analysis of phenolic compounds of extracts from common Mediterranean plants. Nat Prod Res 25: 596-605.