Evaluation of Empirical and Predictive Approach of Selection for Yield Improvement in Wheat
Tejbir Singh*
Corresponding author: Tejbir Singh, Department of Genetics and Plant Breeding, Kisan P. G. College, Simbhaoli 245207(Ghaziabad) U.P.; E-mail: drtejbir@yahoo.com
Department of Genetics and Plant Breeding, Kisan P. G. College, Simbhaoli 245207 (Ghaziabad) U.P.
Citation: Singh T. Evaluation of Empirical and Predictive Approach of Selection for Yield Improvement in Wheat. J Plant Sci Res. 2015;2(2): 135.
Copyright © 2015 Singh T, et al. This is an open access article distributed under the Creative Commons Attribution License, which permits unrestricted use, distribution, and reproduction in any medium, provided the original work is properly cited.
Journal of Plant Science & Research | ISSN: 2349-2805 | Volume: 2, Issue: 2
Submission: 15/08/2015; Accepted: 18/09/2015; Published: 22/09/2015
Abstract
The relative efficiency of empirical and predictive approaches was evaluated in identifying the suitability of early generation (F2) selection criteria for yieldimprovement in wheat. It was concluded that (i) the identification of traits for selection in F2 generation following simple correlation and regression approach isinefficient, (ii) the predictive approach was also poor in comparison to the empirical approach for the identification of traits for selection in F2 generation and (iii)Correlation coefficients of grain yield of F4 bulk progenies with grain yield of parent F2 plants were not significant, making prediction in early generation difficult.
The correlation coefficients of grains per spike (r = 0.54**, 0.54** and 0.52**), tiller number (r = 0.79**, 0.83** and 0.55** and biological yield (r = 0.88**,0.92** and 0.90**) with grain yield in F2 generation were high in all the three crosses. Thus the selection based on one or simultaneously on all three yieldcomponents viz: grain number, high tiller number and higher biological yield would result into high grain yield due to positive correlated response. Use ofstepwise multiple regression approach may quantify and improve the efficiency of selection based on above traits in resulting generation.
Keywords: Coefficient of determination; Empirical approach; Early generation selection; F4 bulk progeny; Stepwise multiple regression
Introduction
In most wheat breeding programmes, the most importantobjective is to enhance the genetic potential for grain yield. A carefulchoice of parents and effective selection in the early segregatinggenerations (F2/F3) are important steps leading to the developmentof superior yielding genotypes. Early generation selection for yield inwheat is desirable because a genotype possessing various desirablegenes in both homozygous and heterozygous conditions do occurmost often in the F2 generation where frequency of heterozygous locidecline in subsequent generations.
In view that selection for yield potential using yield on singleplants in early generations (F2/F3) within crosses has been reportedineffective [1-3], most often, the suggested criteria for earlygeneration selection have been yield components or harvest indexor a combination of the two. Walton using a multiple regressionapproach, reported an increase in yield with the selection for increase in number of heads per plant, kernels per plant and 1000 kernelweight. Despite the preponderance of evidence on the usefulnessof the component approach to breeding, yield components inquantitatively indexed manner have been seldom used as selectioncriteria by plant breeders for improvement of yield. Frey assigns threereasons for this lack of interest: (i) the relationship between yield andyield components is often non-linear, (ii) the environment affects therelationship between yield and yield components, and (iii) collectionof yield component data may be more expensive than collection dataon yield [4].
The concept of early generation testing has been earlier advocatedbut its usefulness have also been questioned. Okolo examined theutility of early generation testing using harvest index concept butdid not found any significant correlation between harvest indexof selected F2 plants and their F3 or F4 bulk yields [5]. The presentinvestigation is an attempt to examine the effectiveness of empirical and predictive approaches in identifying the suitable early generationselection criteria for yield improvement in wheat.
Material and Methods
Two thousand plants of each of the F2 populations derived fromthree different single crosses e.g., CPAN 1866/ HD 2009, CPAN 1866/DL 153-2 and CPAN 1959/ DL 153-2 were raised in an un-replicatedplot in 5 m rows with a plant to plant and row to row distance of 15 cmand 30 cm, respectively, at Research Farm, Department of Geneticsand Plant Breeding, Ch. Charan Singh University, Meerut. Out of2000 plants in each of the three F2 populations, the data on 300 diseasefree plants were recorded on the following seven traits viz., grain yield(g), plant height (cm), grains per spike, 100 grain weight (g), tillernumber, biological yield (g) and harvest index (%). Subsequent torecording of data, the selection in each of the three F2 populations wascarried out as follows: (i) the 20% plants each with high and low valuesfor each of the seven traits were separately selected, (ii) 20% plantswere selected on the basis of an index involving greater values of eachof the seven traits than their means in the respective populations and(iii) 20% plants were randomly selected. Since several plants wereselected based on these three criteria, a total of 272,274 and 275 plantswere selected from out of 300 plants retained in each of the three F2populations of CPAN 1866/ HD 2009, CPAN 1866/ DL 153-2 andCPAN 1959/ DL 153-2, respectively.
The three sets of F3 progenies of the selected F2 plants alongwith their parents and two national check cultivars (WL 711 andSonalika) were evaluated in 1.5 m rows in three simple lattice designexperiments with two replications at two diverse locations i.e. Meerutand Pantnagar. Data on grain yield per plot were recorded on thecentral 1 m row of each progeny after slashing 0.25 m on both ends.On the basis of grain yield data from each of the two locations, theselection of 10 % highest yielding F3 progenies was carried out in eachof the three sets of populations. This resulted in the retention of a total of 40,36 and 37 progenies from CPAN 1866/ HD 2009, CPAN 1866/DL 153-2 and CPAN 1959/ DL 153-2 populations, respectively.
The above selected three sets of F3 progenies were evaluated asF4 bulk progenies along with their parents and two national checkcultivars in three separate randomized block design experimentswith three replications at University Research Farm, Meerut. Eachprogeny was evaluated in plots of 5 rows of 4 m length with a rowto row distance of 23 cm. The seed rate was kept at 100 kg/ha. Dataon grain yield per plot was recorded on 3 central rows of 3 m length.
The three sets of F4 progenies descended from 272, 274 and275 selected F2 plants belonging to CPAN 1866/ HD 2009, CPAN1866/ DL 153-2 and CPAN 1959/ DL 153-2, respectively, were alsoevaluated along with their parents and two national check cultivarsin three separate randomized block design experiments with tworeplications. Each progeny was assigned to a single row plot of 2 mlength with a row to row distance of 23 cm. The seed rate was kept at100 kg/ha. The grain yield data on each progeny was recorded on aplot of 1.5 m length.
The data recorded on individual plants (F2) and plots (F3/F4) aswell as pooled data were analyzed in each population separately asfollows:
(i) The correlation analysis among the seven traits in F2populations.
(ii) The correlation of grain yield of F4 bulk progenies with seventraits of parent F2 plants. (iii) Simple and stepwise multiple regressionanalysis as per Panse and Sukhatme [6] and Draper and Smith [7], respectively.
(iv) Using regression coefficient (b) from above analysis (ii), tenF2 plants with highest grain yield potential estimates were identified.
(v) The F4 bulk progenies selected from 10% highest yielding F3and F4 populations were traced back to the selected parent F2 plantsand the selection patterns of F2 plants were compared to determinethe effectiveness of various selection criteria.
Results and Discussion
Mean values of plants selected for high (H) expression, low (L)expression and randomly selected (R) for the seven traits in the threeF2 populations are given in Table 1 which indicated that the mean ofplants selected for high value (H) were much higher than the mean oflow (L) expression and randomly selected (R) for all the seven traitsin all the three crosses. The increase in H over L as % of H varied51.6 to 58.6% for grain yield, 25.3 to 37.3% for plant height, and upto 58% increase for other traits over three crosses. This increase wasremarkably high for grain/spike (46 to 56%) and tiller number (43-58%), moderate increase for 100 grain weight (27.6 to 35%) and lowfor harvest index (13 to 30%). Similarly, increase of H over meanof randomly selected (R) plants was 16 to 35% for grain yield, 17 to19% for plant height, 21.8 to 43.9% for 100 grain weight 6 to 10% forharvest index and up to 44% for other traits.
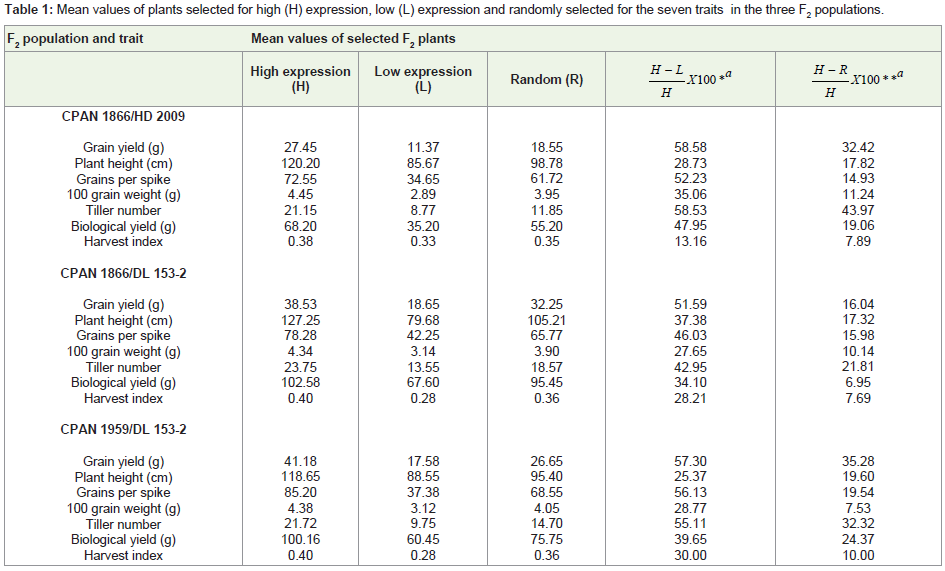
Table 1: Mean values of plants selected for high (H) expression, low (L) expression and randomly selected for the seven traits in the three F2 populations.
However, The magnitude of correlation coefficient of three traitsin F2 viz., grains per spike ( r = 0.54**, 0.54** and 0.52** ), tiller number( r = 0.79**, 0.83** and 0.55** ) and biological yield ( r = 0.88**, 0.92**and 0.90** ) with grain yield was high (Table 2). These are major yieldcomponents found in this study. Thus the selection based on oneor all three traits viz: grain number, high tiller number and higherbiological yield would result into high grain yield due to positivecorrelated response. Similar to the present results, Balyan and Verma[8] and Balyan and Singh [9,10] also reported high co-variability ofgrain yield with tiller number and biological yield in wheat.
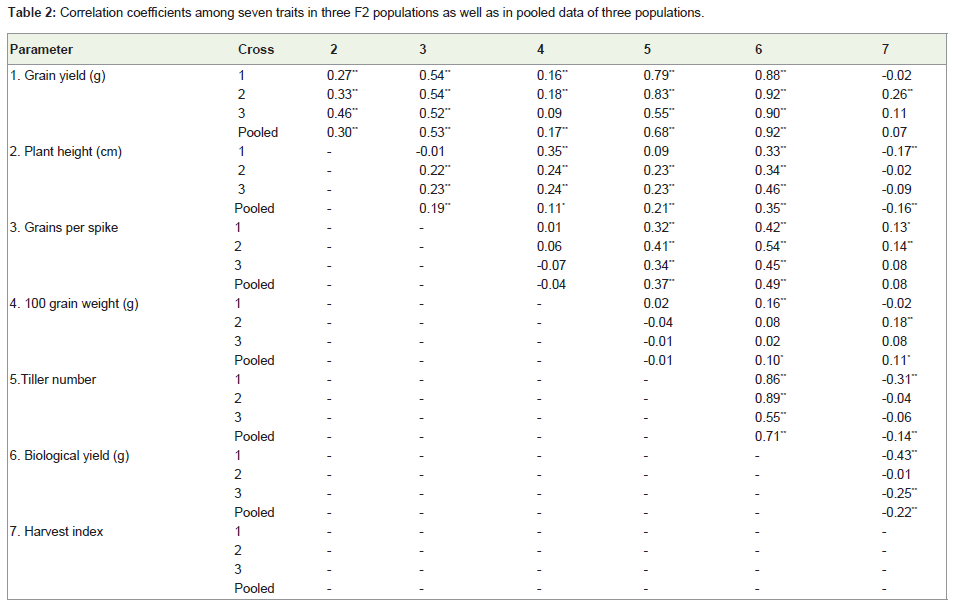
Table 2: Correlation coefficients among seven traits in three F2 populations as well as in pooled data of three populations.
The analysis of correlations and regressions of grain yield ofF4 bulk progenies with different traits of parent F2 plants may behelpful in the identification of selection parameter in F2 generation.Out of the three crosses, the grain yield of F4 bulk progenies of onlyCPAN 1959/ DL 153-2 showed positive and significant associationwith plant height and biological yield and significant and negativeassociation with harvest index (Table 3). However, in the pooledanalysis the grain yield of F4 bulk progenies showed positive andsignificant association with grain yield (0.13**), plant height (0.12**),tiller number (0.14**) and biological yield (0.12**) and significant andnegative association with 100 grain weight (-0.10*) and harvest index(-0.12**) Contrary to the present results, Whan et al., [11] reported thatthe selection for yield by means of harvest index was no more effectivethan selection for yield itself. Similarly, Huel and Graf observed thatspike harvest index was not correlated with either plot harvest index or grain yield [12]. This un-effectiveness of selection based on HI isreported due to presence of genotype x environment interactions thatdecreased the reliability of harvest index as a selection criterion [13].However, increased HI in dwarf wheat has been back bone for yieldimprovement and lodging resistance in wheat programmes in India.The negative correlation of HI with grain yield may happen when thevariability exhaust among dwarf wheat e.g., crosses among 4-genedwarf wheat varieties. Under such situation selection when responseto single yield component plateaus, selection for higher biologicalyield coupled with high HI is used as the advance selection criteriafor improving the grain yield The low magnitude of above significantassociations of grain yield of F4 bulk progenies with other traitsscored on parent F2 plants may be attributed to (i) high degree ofheterozygosity in the F2 populations which will further segregate andwill not breed true as genetic principle, (ii) the high genotype x yearinteraction since selected plants are compared with their progenies indifferent years and (iii) inter-genotypic competition.
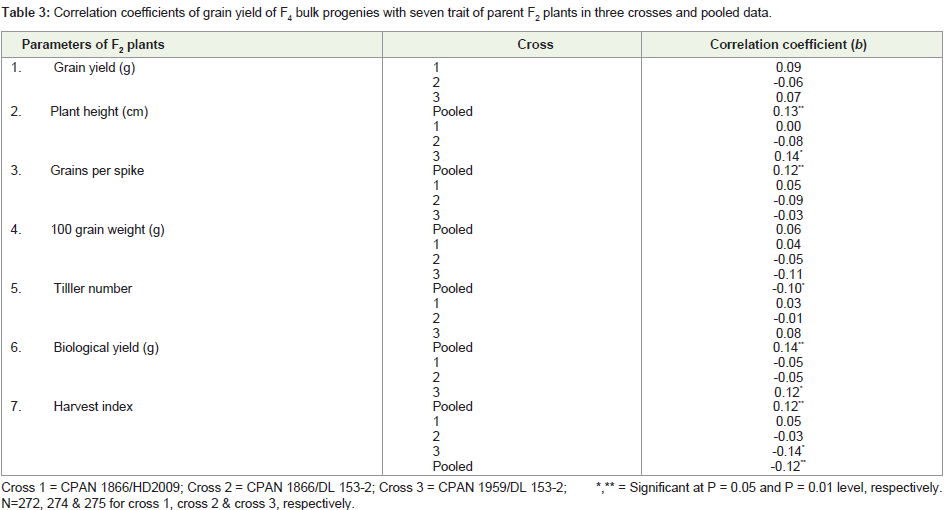
Table 3: Correlation coefficients of grain yield of F4 bulk progenies with seven trait of parent F2 plants in three crosses and pooled data.
The simple regression analysis of the grain yield of F4 bulkprogenies on the seven traits of parent F2 plants confirmed the result of correlation analysis. The grain yield of F4 bulk progenies in onlyone cross: CPAN 1959/ DL 153-2 showed significant regressioncoefficient (b) of F4 bulk progenies over parent F2 plants for plantheight, biological yield and harvest index. In the pooled analysisof data, the grain yield of F4 bulk progenies showed significantassociations for grain yield, plant height, tiller number, 100 grainweight, biological yield and harvest index of parent F2 plants (Table 4). Similar to the correlation analysis, the coefficient of determination(r2) of simple regression analysis of grain yield of F4 bulk progenieson various traits of parent F2 plants ranged from 1.00 to 1.96% whichis very low and so non--reliable for determining performance of F4progenies based on early generation F2 mean due to segregation,depletion of heterosis due to reduction in heterozygosity on selfing,selection in F3 and GxE interactions due to comparison in differentyears Following the use of appropriate regression equations involvingeach of the seven traits of parent F2 plants, ten F2 plants with highestregression coefficient (b) generated F4 bulk grain yield potential wereidentified in each of the three crosses. A comparison of the ten F4bulk progenies derived from the above identified plants with the ten highest yielding F4 bulk progenies in each of the three crosses revealedthat with the help of regression approach only four, five and five highyielding F4 bulk progenies of CPAN1866/HD 2009, CPAN 1866/DL 153-2 and CPAN 1959/DL 153-2, respectively could be retained(Table 5). Among these progenies the maximum number (3) of highyielding F4 bulk progenies (CPAN 1959/DL 153-2) were derived fromF2 plants selected for high grain yield potential estimate on the basisof regression equation involving grain yield per se. Further, two highyielding F4 bulk progenies in each of the three crosses were derived from F2 plants selected for high grain yield potential estimate on thebasis of regression equation involving 100 grain weight. The selectionof F2 plants with high grain yield potential on basis of regressionequations involving plant height, tiller number, biological yield andharvest index either resulted in the retention of two or none of thehigh yielding F4 bulk progenies in any of three crosses (Table 5). Thus,following simple regression approach, none of the trait of parent F2plants showed high effectiveness in terms of selecting high yielding F4bulk progenies.
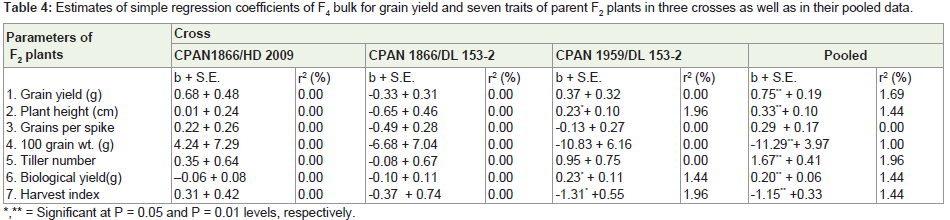
Table 4: Estimates of simple regression coefficients of F4 bulk for grain yield and seven traits of parent F2 plants in three crosses as well as in their pooled data.
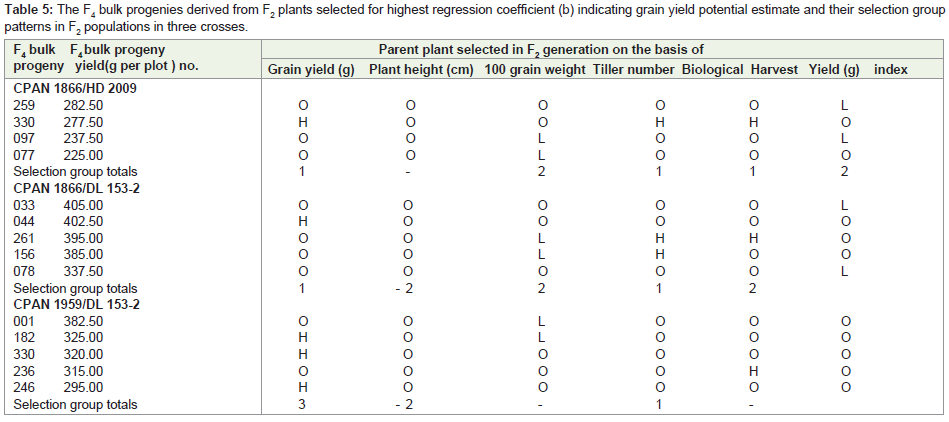
Table 5: The F4 bulk progenies derived from F2 plants selected for highest regression coefficient (b) indicating grain yield potential estimate and their selection grouppatterns in F2 populations in three crosses.
A comparison of the results of regression approach with theresults obtained following empirical approach also revealed a poorrelationship. In the empirical approach, the highest number of highyielding F4 bulk progenies were derived from plants selected for highbiological yield followed by plants selected for high grain yield per se,while the response to selection of F2 plants based on 100 grain weight,harvest index and also the selection at random was poor (Table 6&7) as also reported by Alexander et al., [14]. The poor response ofregression approach in the retention of high number of high yieldingF4 bulk progenies on the basis of biological yield, grain yield per se orany other trait of parent F2 plants was not unexpected due to very lowestimates of coefficients of determination (r2) of simple regressionanalysis (Table 4).
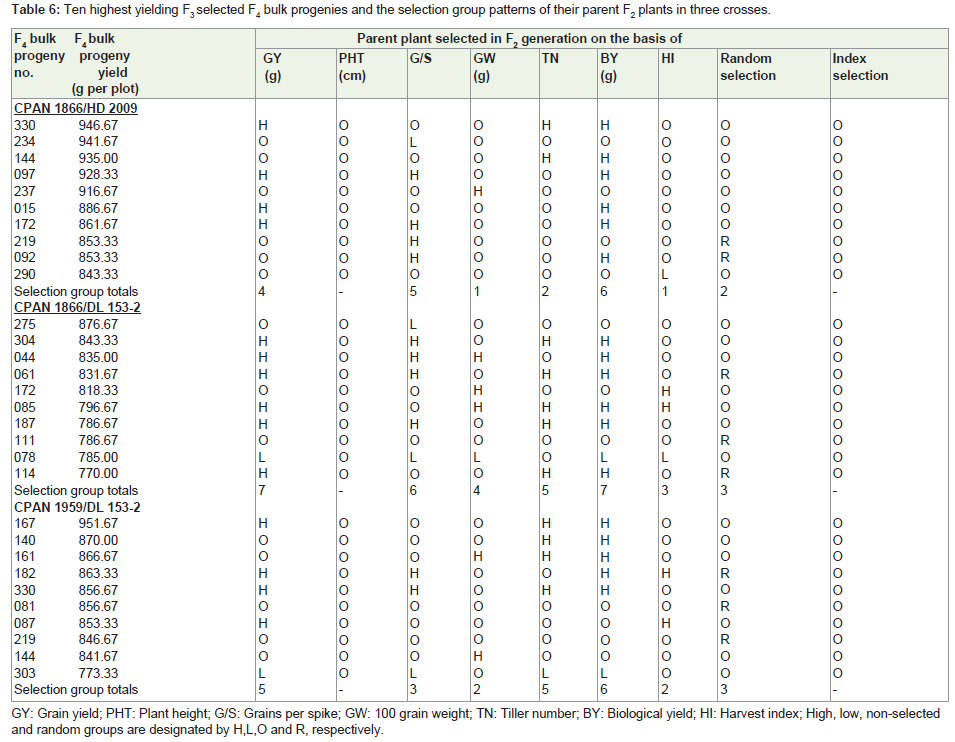
Table 6: Ten highest yielding F3 selected F4 bulk progenies and the selection group patterns of their parent F2 plants in three crosses.
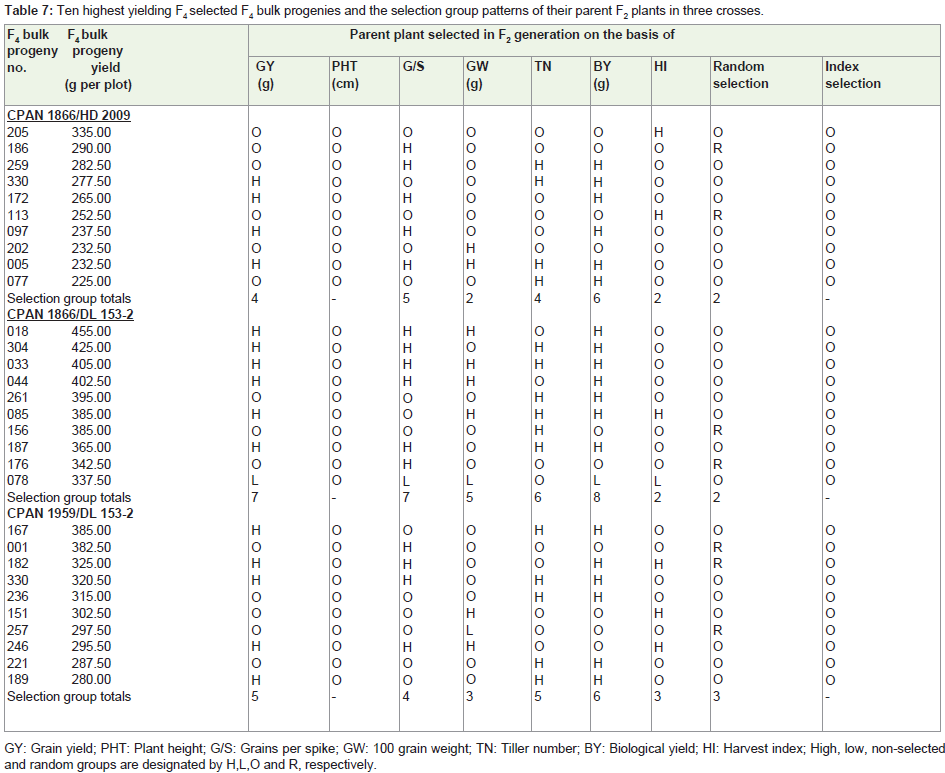
Table 7: Ten highest yielding F4 selected F4 bulk progenies and the selection group patterns of their parent F2 plants in three crosses.
The stepwise multiple regression analysis of the pooled data of thethree crosses indicated an increase in the coefficient of determination(r2) for F4 bulk yield when several variables were fitted (Table 8). TheR2 value was 5.24 percent for the multiple regression analysis whiler2 value varied from 1.00 to 1.96 percent for the simple regressionanalysis. On the basis of the result of multiple regression analysis,it may be argued that potential of grain yield may be improvedfollowing selection in F2 and F3 based on the four traits viz., highergrain yield, higher plant height in dwarf population,100 grain weightand harvest. Mc Vetty and Evans suggested, the biological yield andpeduncle length as the most important trait for selecting F2 plantswith the high grain yield potential. As peduncle length was notrecorded here, the role of other traits which are not the part of thisstudy may also contribute to grain yield. The results of the empiricalapproach of present study also identified biological yield with othertrait combination as the important trait for selecting plants in F2generation for recovering high yielding genotypes in dwarf x dwarfvarietal croes of wheat as reported by Singh and Balyan also [15].
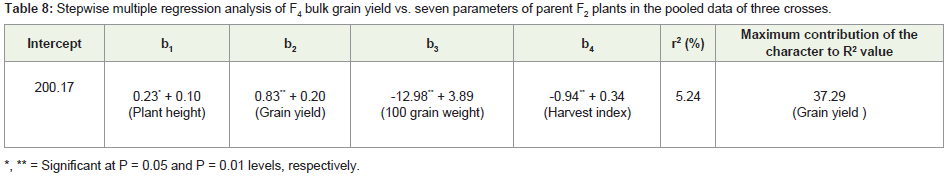
Table 8: Stepwise multiple regression analysis of F4 bulk grain yield vs. seven parameters of parent F2 plants in the pooled data of three crosses.
References
- Shebeski LH (1967) Wheat and breeding. Proc Can Cent Wheat Symp., Saskatoon, Sask., Canada, pp. 249-272.
- Briggs KG, Shebeski LH (1971) Early generation selection for yield and bread making quality of hard red spring wheat (Triticum aestivum L.). Euphytica 20: 453-463.
- Knott DR (1972) Effects for selection for F2 plant yield on subsequent generations in wheat. Can J Pl Sci 52: 721-726.
- Frey KJ (1971). Improving crop yields through plant breeding. In Moving of the Yield Plateau. (Eds. Eastin, J.D. and Munson, R.D.)pp. 15-18 (Special Publ. No. 20, Am. Soc. Agron. Medison, Wis., U.S.A.).
- Okolo EG (1977) Harvest index of single F2 plants as a yield potential estimator in common wheat. M.S. Thesis, Univ of Manitoba, Winnipeg, Canada.
- Panse, Vinayak Govind (1967) Statistical methods for agricultural workers / by VG Panse and PV Sukhatme. New Delhi : Indian Council of Agricultural Research.
- Draper NR, Smith H (1981) Applied Regression Analysis. John Wiley & Sons, New York, 709 pp.
- Balyan HS, Verma AK (1985) Relative efficiency of two mating systems and selection procedures for yield improvement in wheat (Triticum aestivum L.). Theor Appl Genet 71: 111-118.
- Balyan HS, Singh T (1987) Character association analysis in common wheat (Triticum aestivum L.). Genome 29: 392-394.
- Balyan HS, Singh T (1997) The usefulness of biparental matings and geno-phenotypic selection for yield improvement in wheat (Triticum aestivum L.). Indian J Genet 57: 401-410.
- Whan BR, Rathgen AJ, Knight R (1981) The relation between wheat lines derived from the F2, F3, F4 and F5 generations for grain yield and harvest index. Euphytica 30: 419-430.
- Huel P, Graf RJ (1992) Variation in spike harvest index among diverse genotypes of spring wheat and triticale. Can J Pl Sci 72: 257-261
- Allan RE (1983) Harvest index of backcross-derived wheat lines differing in culm height. Crop Sci 23: 1029-1032.
- Alexander WL, Smith EL, Dhanasobhan C (1984) A comparison of yield and yield component selection in winter wheat. Euphytica 33: 953-961.
- Singh T, Balyan HS (2003) Relative efficiency of various single plant selection criteria and F3 generation yield testing in wheat (Triticum aestivum L.). Indian J Genet 63: 24-29.