Studies on Genetic Diversity in Groundnut(Arachis hypogaea L.) Germplasm
Mukesh Bhakal* and G M Lal
Department of Genetics and Plant Breeding Sam Higginbottom Institute of Agriculture Technology and Sciences.(Formerly Allahabad Agricultural Institute) Deemed-to-be University, Allahabad-211007 (U.P.) India
Corresponding author: Dr. Mukesh Bhakal, Department of Genetics and Plant Breeding Sam Higginbottom Instituteof Agriculture Technology and Sciences.(Formerly Allahabad Agricultural Institute) Deemed-to-be University,Allahabad-211007 (U.P.) India;E-mail: mukeshbhakal02@gmail.com
Citation: Bhakal M, Lal GM. Studies on Genetic Diversity in Groundnut (Arachis hypogaea L.) Germplasm. J Plant Sci Res. 2015;2(2): 128.
Copyright © 2015 Bhakal M, et al. This is an open access article distributed under the Creative Commons Attribution License, which permits unrestricted use, distribution, and reproduction in any medium, provided the original work is properly cited.
Journal of Plant Science & Research | ISSN: 2349-2805 | Volume: 2, Issue: 2
25/06/2015; Accepted: 25/07/2015; Published: 03/08/2015
Abstract
Genetics divergence using D2 analysis of 40 genotypes of groundnut (Arachis hypogaea L.) of different geographic origins revealed existence of considerable diversity for eleven quantitative and qualitative characters. The significant treatment mean square indicated adequate variability among the genotype for all characters. The genotypes were grouped into 7 clusters. The clusters VI was the largest containing 12 genotypes each followed by clusterV consisted 7 genotypes, cluster I and cluster VII consisted 6 genotypes, cluster III consisted 4 genotypes, cluster II consisted 3 genotypes and cluster IVconsisted 2 genotypes. The diversity among the genotypes measured by intra-cluster & inter cluster distance was adequate for improvement of Groundnut byhybridization and selection. The genotype included in the diverse clusters can be used as promising parents for hybridization programme for obtaining highheterotic response and thus better sergeants in Groundnut.
Keywords: Genetics divergence; D2 Analysis; genetic variability, Groundnut and Arachis hypogaea L
Introduction
Groundnut has been the main oilseed crop in India and otherdeveloping countries for several decades and will continue to be soin the future. Globally, groundnut (Arachis hypogaea L.) productionand area during 2011-2012 averaged 6.93 million tonnes and 141.1million hectare [1] and production of oil seeds in India 30012.2Thousand tones. In developing countries, the proportion for oilis generally higher than 50%. It is estimated that each 1% increasein oil content would raise the processor’s benefit by 7%. The oilcontent in seed of groundnut cultivars for commercial productionis generally around 50%, while some germplasm accessions havebeen found to contain more than 55% oil. In the western world,most of the groundnut goes into food uses where groundnut butter,roasted groundnut and salted groundnut are preferred food forconsumers [2]. There is an increasing need for high protein and low oil groundnut as these traits add to the confectionary quality ofgroundnuts. High oleate to linoleate (O/L) ratio has been associatedwith prolonged groundnut shelf life and decreased tendency towardrancidity [3]. High oleate groundnut diet lowers total cholesterol anddecreases bad low density lipoprotein (LDL) cholesterol, maintainsbeneficial high density lipoprotein (HDL) cholesterol, and helps tomaintain good flavour [4]. Genetics divergence present in a cropplays an important role in improvement of the crop. It is necessaryto utilize useful quantitative traits from diverse genetic sources. TheD2 Analysis provides the means for grouping of genotypes in distinctclusters in order to their relative distance (inter & intra cluster) fromeach other. Such a study is expected to be useful not only in the choiceof the parents for hybridization but also to serve as an index effectingselection. Genetic diversity is the first and foremost need for any cropimprovement programme. D2 Analysis is performed to identify thediverse genotypes for hybridization programme. However, genetic gain can be expected only if there is adequate genetic diversity in thepresent breeding population. Therefore, a study of genetic diversitywould held in formulating a rational plant improvement programmethrough selection or for developing hybrids in groundnut. Theconcept of D2, as a measure of divergence, was first introducedby Mahalanobis [5] as described by Rao [6]. It is based on thirdmultivariate degree statistical analysis and is self-weighing on thebasis of genetic variability. D2 values between any pair of populationaccount to a measure of genetic divergence than the one which fallinto different clusters.
Materials and Methods
The experimental material for the present investigation consistedof 40 genotypes of groundnut obtained from the International CropResearch Institute of Sami Arid Tropic, (Patancheru) Hyderabad,A.P. (India). The present experiment was conducted in randomizedblock design at Field Experimentation Centre, Department ofGenetics and Plant Breeding, Allahabad during kharif, 2012. In eachreplication consisted of two rows of each genotypes with a 1.5 meterrow length. Row to row and plant to plant distance 40 x 10 cm. Allthe recommended agronomic cultural practices and plant protectionmeasure were followed as and when required.
The following eleven quantitative data were recorded on five randomly selected plants from each genotype in each replication forcharacters were Days to 50% flowering, plant height (cm.), Numberof primary branches per plant, Days to maturity, Pod yield per plant(gm.), Pod yield (q/ha.), Sound matured kernel, Seed index(gm.),Shelling percentage, Kernel yield(q/ha.), Kernel uniformity(%).Except Days to 50% flowering & days to maturity recorded on theplot basis. Replication wise data for each character were subjected foranalysis of variance [7] and then multivariate analysis of D2 statistic[5,6]. The genotypes were grouped into different cluster followingthe ward method. The relative contributions of different characterstowards genetic divergence were also worked out.
Results and Discussion
The significant treatment mean square indicated adequatevariability among the genotype for all character in Table 1. On thebasis of magnitude of D2 value, 40 genetically diverse genotypeswere grouped into 7 clusters [Table 2]. The highest numbers ofgenotypes were presented in cluster VI which contained 12 entriesfollowed by cluster V which contained 7 entries, Cluster I and clusterVII which contained 12 entries (each cluster having 6 entries). Thelow number of genotypes were present in cluster III, and cluster IIwhich contained 4, 3, entries respectively. The minimum numbers ofgenotypes present in cluster number IV which contained 2 entries.
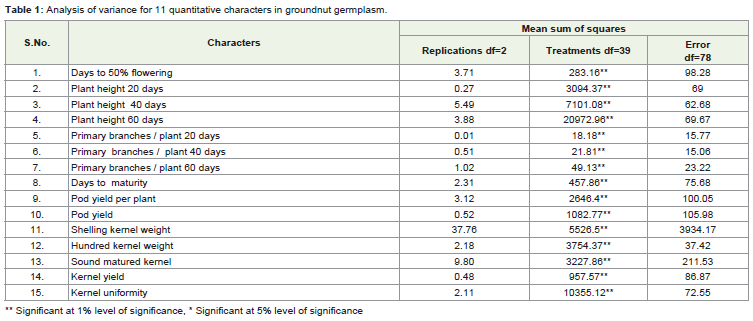
Table 1: Analysis of variance for 11 quantitative characters in groundnut germplasm.
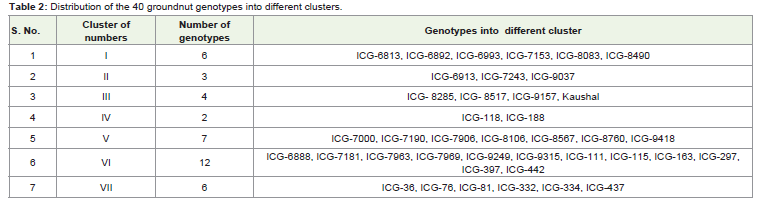
Table 2: Distribution of the 40 groundnut genotypes into different clusters.
On considering cluster mean in respect of these seven clustersTable 3. Highest cluster mean value was recorded in cluster VIfor the characters Days to 50% flowering, plant height 40 days &60 days, kernel uniformity, in cluster V highest cluster mean fornumber of primary branches per plant at 20 days, pod yield, shellingkernel weight and kernel yield, highest cluster mean value for daysto maturity and sound matured kernel in cluster III, highest clustermean for number of primary branches per plant in cluster I.
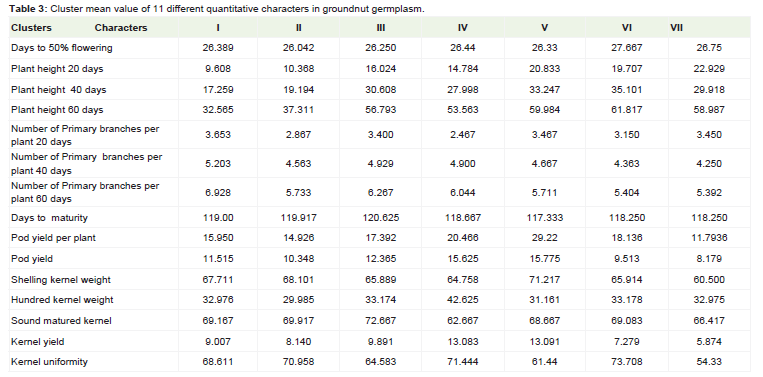
Table 3: Cluster mean value of 11 different quantitative characters in groundnut germplasm.
The intra and inter cluster value are presented in Table 4. Thehighest intra-cluster distance was observed in case of cluster IV(25.353), followed by cluster I and cluster VII. The maximum intercluster distance was found between cluster IV and VII (50.937),followed by cluster I and cluster VII (47.071) and cluster v and VII(43.3701) exhibited very high inter- cluster distance. The corroborativefindings were reported by Singh and Dwivedi [8], Dwevedi and panwar[9], Verma et al. [10] and Peshattiwar et al. [11], Singh et al. [8]. Thus,crossing between the genotypes belonging to cluster pair separated byvery high inter-cluster distances, as mentioned above, mat throughdesirable transgressive segregates which indicated that the genotypebelonging to these cluster pairs, with very high inter-cluster distances,may produce desirable transgressive segregates and an opportunityfor selection better genotypes in succeeding generations. The resultrevealed that different genotypes from different source and state wereincluded in different clusters, indicating that genetic diversity andgeographic diversity are not related. Emphasis may be given in [Table 5] for improving the characters like hundred kernel weight, pod yieldper plant, sound matured kernel and kernel uniformity.
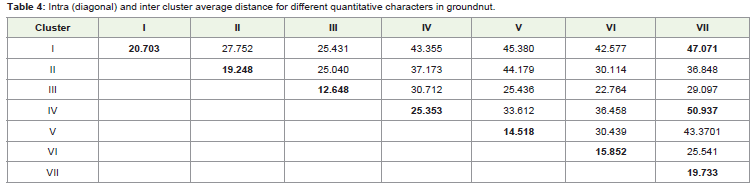
Table 4: Intra (diagonal) and inter cluster average distance for different quantitative characters in groundnut.
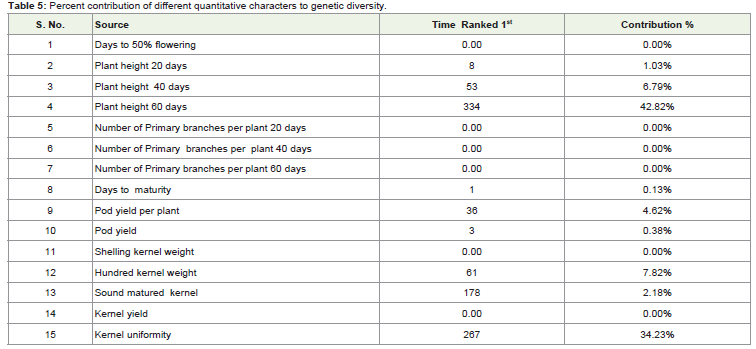
Table 5: Percent contribution of different quantitative characters to genetic diversity.
References
- Agriculture Statistics at glance (2011) Directorate of Economic and Statistic Ministry Government of India.
- Ahmed EH, Young CT (1982) Composition nutrition and flavors of peanut. Peanut Science and Technology: 655-688.
- Braddock JS, Sims CA, O’Keefe SF (1995) Flavor and oxidative stability of roasted high oleic acid peanuts. Journal of Food Science 60: 489-493.
- O’Byrne DJ, Knauft DA, Shireman RB (1997) Low fat monosaturated rich diets containing high oleic peanuts improve serum lipoprotein profiles. Lipids 32: 687-695.
- Mahalanobis PC (1936) On the generalized distance in statistics. Protection Naionatl. Institute Science. India 2: 49-55.
- Rao CR (1952) Advanced Statistical Methods In Biometrical Research., John Wiley And Sons, New York, Pp. 357-369.
- Panse VG, Sukhatme PV (1985) Statistical Method for Agriculture Workers, Indian Council of Agricultural Research. New Delhi, P. 381.
- Singh SP, Dwivedi VK (2002) New agriculturist 13: 2-7.
- Dwevedi AN, Panwar IS (2005) Journal of Research Hisar 34: 35-39.
- Verma AK, Singh PK, Vishwakarma SR, Tripathi RM (2006) Farm Science Journal 15: 32-34.
- Peshattiwar PD, Ghorpade PB, Dandge MS, Thorat A, Gomase DG (2009) Genetic divergence in duram wheat cultivars. International journal of Agricultural Sciences 5: 243-247.