Research Article
An Analysis of Nutrients Accumulation and Heavy Metals in Selected Vegetable Crops Grown in district Sirsa, Haryana
Inder Pal and Anil Kumar Dular
Department of Environmental Science, Maharaja Ganga Singh University, Bikaner, Rajasthan, India
*Corresponding author: Anil Kumar Dular, Department of Environmental Science, Maharaja Ganga Singh University, Bikaner, Rajasthan, India Email: dular_ak@rediffmail.com
Copyright: © Pal I, et al. 2023. This is an open-access article distributed under the Creative Commons Attribution License, which permits unrestricted use, distribution, and reproduction in any medium, provided the original work is properly cited.
Article Information: Submission: 02/05/2023; Accepted: 19/06/2023; Published: 23/06/2023
Abstract
The present study investigated the accumulation of heavy metals in some vegetable crops irrigated with treated wastewater at some sites of District Sirsa of Haryana. The analysis of variance revealed the significant differences among the treatment for all the twelve traits under study, indicating substantial variability in the minerals. Wastewater irrigation can lead to the accumulation of heavy metals in the soil and, consequently, in the vegetables, which can pose health risks when consumed in excessive quantities. Results indicated that T7 is suitable for most of the minerals under the study area.Treatment T7 is ideal for calcium, magnesium, and sodium traits. Calcium exhibited a highly significant and positive association with magnesium and sodium. However, a negative association with potassium was observed. Sodium showed a positive and significant association with magnesium. Chromium also exhibited positive and significant association with sodium, and sodium itself demonstrateda negative and non-significant association with potassium followed by iron and copper. Selenium showed a positive and non-significant correlation with iron and potassium. However, it was exhibited a negative and non-significant correlation with calcium followed by magnesium, copper, zinc, and nickel.
Keywords: Correlation; Minerals; Heavy metals; Wastewater; Vegetable crops
Introduction
The application of treated wastewater into agricultural lands is
standard practice in several countries. Globally, 2 million sq km of
land are irrigated with wastewater [1]. It is most evident in the periurban
and sub-urban areas in developing countries. The long-term
irrigation with treated waste water is known to have a significant
contributor for elements such as Cd, Cu, Zn, Cr, Pb, and Mn in
surface soil of agricultural fields [2], and it also increase the level
of physicochemical properties in soil. Extent of toxic elements
enrichment in irrigated soil depends on concentrations of heavy
metals in irrigation water, period of application of treated wastewater
and texture of soil. The availability of nutrient and various elements
in vegetables depends on soil properties like pH, organic carbon,
cation exchange capacity [3-5]. The accumulation of metals occurs in edible and non-edible parts of vegetables. Wastewater can contribute heavy metal accumulation significantly in soil and crops [2,6].
There are different types of wastewaters. Industrial wastewater
contains a wide variety of inorganic toxicants and synthetic organic
pollutants, which are not biodegradable such as, solvent oils, plastics,
plasticizers, metallic wasters, suspended solids, phenols, and various
other derivatives. Almost all industries (dairy, tannery, cannery,
distillery, oil refinery, textile, coal and coke, synthetic rubber,
steel etc.) produce their own characteristic wastewater. Domestic
wastewater, discarded from houses, contains especially organic
matter. Wastewater has threats to vicious environment, humans,
plants, and animals. It also affects the soil like salinity, alkalinity and
water logging which change the physical, chemical and biological
properties of soil and affect fertility of the soil. It is the rich sources of
both beneficial as well as harmful elements. Since some effluents are a
rich source of plant nutrients, therefore soil provides the logical sink
for their disposal. But many untreated and contaminated wastewater
and industrial effluents may have high concentration of several heavy
metals such Cd, Ni, Pb and Cr [7].
The present study area which is located between Latitude 29032’
11.5’ N and Longitude 750 1’ 31.81’ E in peri urban and sub urban
area of Sirsa District, Haryana, where soil and water samples were
collected to determine and evaluate such impacts due to unscrupulous
use of treated wastewater for growing vegetable crops. Controlled
fields were selected in the same locality, considering the use of tube
well and canal water for irrigation. The study was conducted to know
the accumulation of nutrients and heavy metals in selected vegetable
crop.
Materials and Methods
The following approach was used to bring together the
information to meet the objectives and answer the various research
questions.The research consisted of three phases: preparation, field
data collection, data analysis and documentation. The first activity
was an explorative field visit to appreciate the context of the research
methods and site selection. Following this, questionnaires were
designed, and interviews held to investigate the perceptions among
farmers for calculation cost benefit analysis, study the perception
among customers on the use and cultivation of vegetables cultivated
with wastewater and to collect additional information derived from
key informants and other stakeholders. Third phase of the research
included data entry and statistical analysis of the perception studies
and the cost benefit analysis. Field surveys were carried out in and
around Sirsa city, to collect soil, water, and vegetable samples. Water
samples collected from different sources included wastewater, ground
water and surface water. Soil samples from 0-20, 20-40 and 40-60 cm
depths and leaf and fruit parts samples of vegetables grown on these
fields and irrigated with various water types was collected. The water
samples were collected in plastic bottles and brought to laboratory
for analysis work. The collected soil samples were air dried, grounded
with wooden mortar and pestle, passed through 2 mm sieve, and
kept for further analyses. The collected plant vegetables samples were
washed with distilled water and dried in oven at 60°C till constant
weight. The soil and water samples were analyzed for their physical,
chemical, and biological properties while vegetable samples analyzed
for nutrients and heavy metals contents by standard protocol methods
(IUPAC, 1990). Analysis of soil physicochemical parameters viz., pH,
conductivity, soil organic carbon and heavy metals were carried out
in the laboratory by following protocol of handbook of methods in
environmental studies written by S.K.Maiti.
Vegetables samples available during the various season at study
area collected randomly from both fields (control and treated). It was
washed thoroughly with tap water followed by distilled water to get
rid of dirt and soil, dried at 68°C for 24 hours and then powdered with
mortar pestle. Metal concentration in different vegetables analyzed
by digesting in microwave taking500 mg of dried powdered samples
with di-acid mixture (3:1) of concentrated HNO3 and HClO4 [8]. The
suspension filtered by rinsing with distilled water using Whatman 42
filter paper and made the volume to 50 ml. This was analyzed for lead
(Pb), manganese (Mn), chromium (Cr), cadmium (Cd), zinc (Zn)
and cupper (Cu) by atomic absorption spectrophotometer. The effect
of irrigating wastewater on available N (Kjeldahl method), P (UVVis
Spectro-photometric method), K (Flamephotometer method)
and quantum of enrichment and bioaccumulation of nutrients in soil
and vegetables were observed. All Samples were analyzed at Maharaja
Ganga Singh University, Choudhary Charan Singh Haryana
Agriculture University Hisar and Central Soil Salinity Research
Institute, Karnal.
The values of Pb, Mn, Cr, Cd, Zn and Cu was obtained from
analysis of irrigated water, soil and cultivated different vegetables
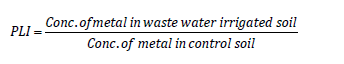
were used to calculate metal transfer factor. The degree of soil
pollution for each metal measured using the pollution load index
(PLI) technique. The following modified equation was used to assess
the PLI level in soils [9].
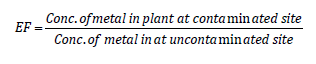
Enrichment factor [10] also calculated to determine the degree of
soil pollution and heavy metal accumulation in vegetable grown in
contaminated soil sites.
After study of such indices the statistical analysis with descriptive
statistics (mean, standard deviation, minimum and maximum) was
calculated. Correlation between the physico-chemical constituents
and heavy metal in soil and metals content of the vegetable was
performed by using the software SAS 9.4 version.
Results and Discussion
Analysis of variance of different minerals:
Analysis of variance revealed significant differences among the
treatment of all the twelve traits under study indicating the presence
of substantial variability in the minerals.However, mean square due
to replication were significant for six minerals namely Mg*, Na*, K**,
Fe*, Mn** and Cr**except Ca, Cu, Zn, Cd and Ni [Table 1] .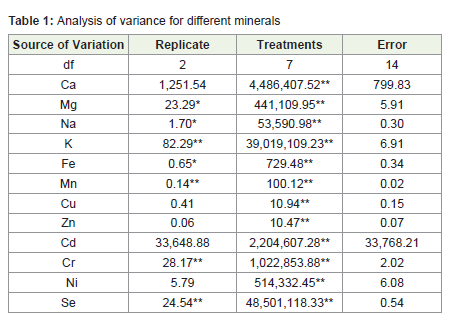
Mean performance of treatments:
For each of the minerals evaluated, the descriptive statistics
including the extreme genotype mean values and the means together
with their standard errors obtained based on average data are
summarized in [Table 2] .In general, treatment showed wide range of
variability for most of the characters and all the traits exhibited broad
spectrum of ranges between the maximum and minimum treatments
mean values. For instance, Ca ranged from 985.33 to 4193.33 with
a mean of 2228.17 and treatment T7 showed maximum mean value
for Ca minerals followed by T3 (4061.67), T8 (2157), T6 (1837.33)
and T5 (1707.33) mean values.Similarly, Mg ranged from 634.67 to
1793.67 with mean value of 1044.042 and CV of 0.23%.Highest mean
value for minerals was expressed in T7 (1793.67) followed by T3
(1451.67), T5 (1009.67) and T6 (925.33%). Sodium (Na) was highest
in T7 (491.33) followed by T3 (246.73), T6 (233.77) and T8 (205) with
range varied from 91.13 to 491.33 and general mean 199.32. Similar
finding [13,14].Potassium (K) ranged from 7581.67 to 16905.33 with mean of
13157.46. T1 (16905.33) exhibited maximum mean value followed
by T6 (16043.67), T5 (15882) and T2 (15382.67). Maximum mean
value for Iron (Fe) T8 (73.83) followed by T1 (64.53), T3 (45.17)
and T2 (43.73). The value varied from 26.90 to 73.83 with mean
value of 46.03.Mn ranged from 3.80 to 21.63 and mean value of 7.70.
Treatment T3 (21.63) was expressed highest mean value followed by
T2 (7.8) and T4 (6.7).
T1 showed maximum mean value of 18.57 followed by T2 (17.73),
T6 (16.83) and T5 (16.50) with ranged varied from 12.57 to 18.57
for Cu. Similarly range of variation for Zn varied from 5.40 to 10.67
with mean value 7.77.T7 (10.67) showed maximum mean value for
these minerals followed by T1 (9.44),T5 (8.60) and T3 (8.47).
Cd range varied from 229.33 to 3002.67 with mean value of
1022.38 and T7 (3002.67) was exhibited maximum mean value
followed by T8 (1342.00), T5 (837) and T4 (797.33). Maximum mean
value was expressed in T1 (5539.33), T6 (5104.33), T3 (4749.00) and
T4 (4485) with ranged varied from 3561.33 to 5539.33 for Cr. Ni range
varied from 754.00 to 1752.67 with mean value of 1338.92. T2 was
exhibited maximum mean value (1752.66) followed by T1 (1732.33),
T5 (1619.00) and T6 (1604.67).Similar finding reported by [9-14]
For Se range varied from 1518.00 to 13352.00 with mean value of
8491.29 and T8 showed maximum mean value 13352.00 followed by
T4 (12951.67), T5 (10426.67) and T1 (9345.00).
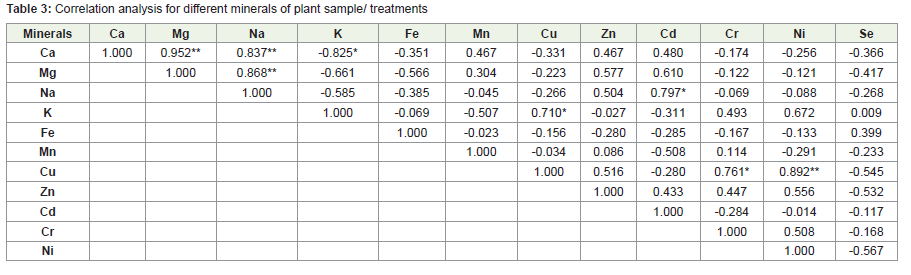
Correlation between different minerals:
[Table 3] indicated that Calcium (Ca) exhibited highly significant and positive association with Mg (0.952**) and Na (0.837**). However, it was exhibited negative association with K (-0.825*). Sodium (Na) showed positive and significant association with Mg
(0.868**). Cd also exhibited positive and significant association
with sodium (0.797*) while sodium also showed negative and nonsignificant
association with K (-0.585) followed by Fe (-0.385) and
Cu (-0.266). Similar reported by [15,16], Gupta and Mitra (2002).
Potassium (K) exhibited positive and significant correlation with
Cu (0.710*) and exhibited non-significant and positive association
with Cr (0.493), Ni (0.672) and Se (0.009). Cu showed positive and
significant correlation with Cr (0.761*) and Ni (0.892**), while Zn
showed non-significant and positive correlation with Cu (0.516).
Similarly, Se showed positive and non-significant correlation with
Fe (0.399) and by K (0.009).However, it was exhibited negative and
non-significant correlation with Ca (-0.366) followed by Mg (-0.417),
Cu (-0.545), Zn (-0.532) and Ni (-0.567). [17,18,6] reported similar
results [19-28].
Conclusion
Wastewater irrigation can lead to accumulation of heavy metals
in the soil and, consequently, in the vegetables, which when consumed
in excessive quantities can pose health risks. The results found that
T7 is good for most of minerals under the study. Treatment T7 was
good for these traits namely Ca, Mg, and Na. Calcium (Ca) exhibited
highly significant and positive association with Mg and Na. However,
it was exhibited negative association with K. Sodium (Na) showed
positive and significant association with Mg. Cadmium (Cd) also
exhibited positive and significant association with sodium, while
sodium also showed negative and non-significant association with
K followed by Fe and Cu. Se showed positive and non-significant
correlation with Fe and K. However, it was exhibited negative and
non-significant correlation with Ca followed by Mg, Cu, Zn and Ni.
References
Citation
Pal I, Dular AK. An Analysis of Nutrients Accumulation and Heavy Metals in Selected Vegetable Crops Grown in district Sirsa, Haryana. J Plant Sci Res. 2023;10(2): 248