Correlation, Path and Diversity Analysis of Oat (Avena Sativa L.) Genotypes for Grain and Fodder Yield
Abhishek Krishna1* Shahid Ahmed2 , H.C. Pandey2 and Vikas Kumar2
Corresponding author: Abhishek Krishna, Bundelkhand University, Jhansi-284003, UP, India,; E-mail: abk.kr13@gmail.com
1Bundelkhand University, Jhansi-284003, UP, India
2Indian Grassland and Fodder Research Institute, Jhansi-284003, UP, India
Citation: Krishna A, Ahmed S, Pandey HC, Kumar V. Correlation, Path and Diversity Analysis of Oat (Avena Sativa L.) Genotypes for Grain and Fodder Yield. J Plant Sci Res. 2014;1(2): 110.
Copyright © 2014 Abhishek Krishna. This is an open access article distributed under the Creative Commons Attribution License, which permits unrestricted use, distribution, and reproduction in any medium, provided the original work is properly cited.
Journal of Plant Science & Research | ISSN: 2349-2805 | Volume: 1, Issue: 2
Submission: 11/08/2014; Accepted: 01/10/2014; Published: 07/10/2014
Abstract
Fifty genotypes of fodder oat (Avena sativa L.) were evaluated to measure the Correlation, Path and Diversity during Rabi-2011-12. Path coefficient analyses determine the cause & effect relationships and partitions the correlation into direct and indirect effects wascarried out. Maximum positive direct effect on green fodder yield was contributed by leaf stem ratio, dry matter, spike length and number of spikelet’s/panicle. However indirect effect on improvement in green fodder yield was exerted by most of the traits studied. So a direct selection for all these traits will helps in improvement of green fodder yield. Green fodder yield was positively correlated with most of the traits studied except number of leaves and stem girth. Among different traits, plant height and leaf length showed positive correlation with maximum number of traits studied.
The D2 analysis on morphological traits grouped the fifty genotypes into ten clusters based on distance ranges. Cluster I includes 37 numbers of lines, Cluster IV and IX includes three lines and Cluster II, III, V, VI, VII, VIII and X includes one line in each. The Cluster with higher number of lines means had low genetic diversity and they are more closely related. Highest intra cluster distance was observed for cluster IX and maximum inter cluster distance was observed between cluster VIII and III. The inter cluster distances were higher thanintra cluster distances suggesting presence of high genetic diversity between lines of any two cluster than the lines present within the cluster. Cluster II is characterized by line having maximum number of prominent traits studied and contributed more towards divergence,so the direct selection for these would be helpful. The study provided the opportunity to identify genotypes to be used in future breeding programme.
Keywords: Oats; Correlation; Path analysis; Genetic Diversity; Green fodder yield; Grain yield
Introduction
Oats (Avena sativa L.) is an annual forage crop which belongs to family Gramineae. It believed that oats is grown in Mediterranean region about 4000 years old in Egypt and its origin is Asia Minor concerted from latitudes 35-650 N and 20-460 S. which is mostlygrown in clay loam soil with adequate drainage pH ranging up-to 5.3-5.7. The crop is known by different names in India, Jai, Ganer, Ganerji, and Toqekoddi, in different languages [1]. The genus Avena is large and diverse containing both wild and cultivated polyploidy series with a basic chromosome number of n=7. Oats is an important winter season crop in India and on the world scene it ranks sixth in production among all cereal crops next to wheat, maize, rice, barley and sorghum.
Oat has been used as fodder and grain as it’s a good source of protein, fibre and minerals. It is used as green crop, hay and silage for animal feed alone or in mixture feed to dairy cattle, horses, mules and turkeys, with lesser quantities feed to hogs, beef cattle and sheep.India is increasing on a fast scale as oat meal, oat granola, baby food and breakfast cereal. Oats have adequate soluble carbohydrates to make good silage. Oat straw is good, palatable roughage and also excellent bedding. Oat in small bags is very popular in hilly areas.Oat forages comprise the largest component of the supplementary cereal forage markets. Oat grain is rich in some important nutrients including silicon, manganese, zinc, calcium, phosphorus and vitamin A, B1, B2 and E.
For further improvement in any breeding programme, always there is need to evaluate the material available to find out the good lines for breeding and hybridization purpose. Different agronomic traits have been used as prime objective to evolve new breeding materials.Determination of correlation helps in taking the decision related to selection strategies. In this path analysis further helps by determining the direct and indirect affect on the traits of interest. All these traitsare affected by genetic and environmental factors [2]. The choice of breeding programme depends mainly on variability available in the basic material or available with breeder. Genetic variation within andbetween population crops species is major interest of Plant Breeders. An estimate of the extent of variation within and between populations of a species is useful for analyzing the genetic structure of germplasm [3] studied clustering pattern in seventy five germplasm lines of oatfor yield and contributing traits using D2 analyses. Singh and Singh [4] studied the D2 analyses in 70 oat genotypes and grouped into seven clusters. Besides this there need to explore new technologies to meet out the emerging demands of the market. Looking into all theseaspects an attempt was made to study the diversity analysis among the lines in semi arid conditions in prevailing in central part of India.
Materials and Methods
The present study was carried out at the Central Research Farm of Indian Grassland and Fodder Research Institute (IGFRI), Jhansi, India during Rabi-2011-12. The material was evaluated in RBD withfifty numbers of genotypes in three replications with row to row spacing of 30cm. The genotypes used in the present study consist of 24 exotic collections, 20 local materials and 6 released varieties. Normal package of practices were followed with recommended dose of fertilizers.
Observations for all the traits were recorded on five randomly selected plants in each replication. Data was recorded on days to plant height, number of leaves, leaf length, leaf breath, stem girth, panicle length, spike length, number of spikelet’s /panicle, 1000 seed wt,groat yield, days to 50% flowering, leaf/stem ratio, dry weight, grain weight, dry matter yield, and green fodder yield traits.
For analysis work computer software windostat was used which uses the following for further detailed analysis.
The correlation coefficient at phenotypic and genotypic level was calculated from the variance and covariance according to Johnson et al. [5].
Direct and indirect effect of various contributing traits towards green fodder yield and dry matter yield was calculated using the path coefficients analysis (Dewey and Lu, 1959).
Genetic diversity arises due to geographical separation or due to genetic barriers to cross ability or due to different patterns of evolution. To measure this extent of diversity, the idea of D2 statistics was used to measure group distance based on multiple characters, wasoriginally developed by Mahalanobis in 1928 [6] and it becomes one of the important technique to assess genetic divergence on the basis of multiple traits. Rao [7] suggested the application of these techniquesfor the assessment of genetic diversity in plant breeding. The data was subjected to statistical analysis and results were described accordingly.
Genotypic correlation coefficients were calculated between green fodder yield and its related traits used for the analysis. Green fodder yield was kept as dependent variable and other traits as independent variable as they determine the basic relationship between pathcoefficients, were interpreted to estimate the direct and indirect effects [8].
Results and Discussion
Correlation and path analysis
Relationship between various morphological traits and green fodder yield was also worked out and presented in (Table 1). It is clear from the table that high positive correlation for green fodder yieldwas shown by leaf stem ratio (0.433) followed by plant height (0.427), grain weight (0.357), leaf length (0.320), groat yield (0.268), days to flowering (0.211), number of spikelet/panicle (0.192), 1000 seed weight (0.154), spike length (0.137) and panicle length (0.127) (Figure 1). The highest positive correlation for green fodder yield was shown by dry matter yield (0.957) and dry weight (0.635) as obviously related to green fodder. So, direct selection for the positively correlated traits will be helpful in improvement of green fodder yield. High positive contribution shown by various traits might have a direct impact on fodder yield improvement [9]. Negative correlation with green fodder yield was observed in leaf length (-0.399) and stem girth (-0.036) that mean a genotype with less number of leaves and thin stem girth will be of not much use in case of green fodder yield. We have to select lines with high leaf numbers and thick stem girth [3].
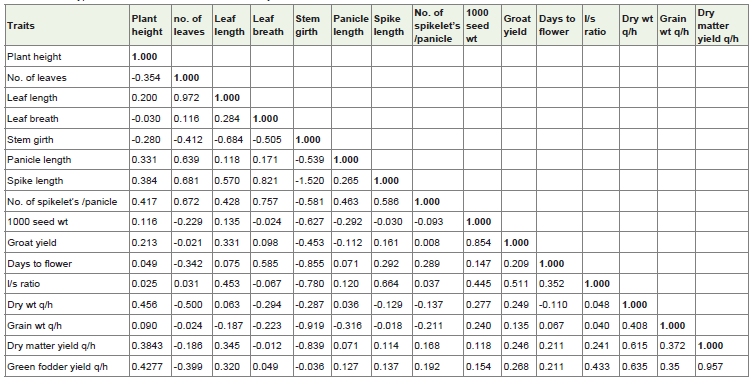
Table 1: Genotypical Correlation Matrix for Green fodder yield and related traits.
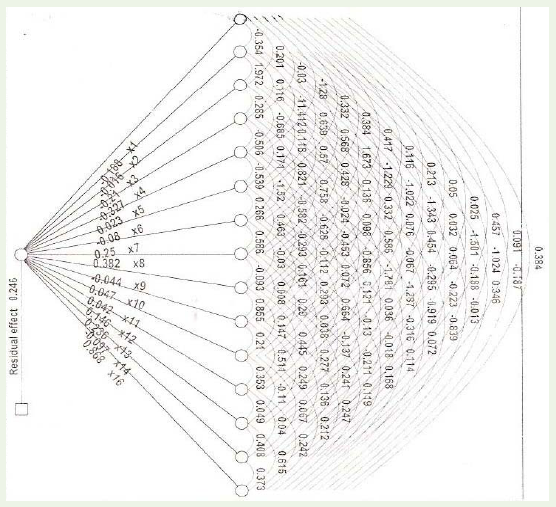
Figure 1: Genotypic path diagram for Green fodder yield.
The table also provides the information about the traits which are positively correlated with each other and might have contributed a lot in improvement of green fodder yield. Among the different traits,high positive correlation was observed between plant height and leaf length (0.200), plant height and panicle length (0.331), plant height and spike length (0.384), plant height and number of spikelet’s/panicle (0.417), plant height and 1000 seed weight (0.116), plantheight and groat yield (0.213), plant height and dry weight (0.456), plant height and dry matter yield (0.384), number of leaves and leaf length (0.972), number of leaves and leaf breadth (0.116), number of leaves and panicle length (0.639), number of leaves and spikelength (0.681), number of leaves and number of spikelet’s/panicle (0.672), leaf breadth and panicle length (0.171), leaf breadth and spike length (0.821), leaf breadth and number of spikelet’s/panicle(0.757), leaf breadth and days to flower (0.585), panicle length and spike length (0.265), panicle length and number of spikelet’s/panicle (0.463), panicle length and l/s ratio (0.120), spike length and number of spikelet’s/panicle (0.586), spike length and days to flower (0.292), spike length and l/s ratio (0.664), number of spikelet’s/panicle and days to flower (0.289).
Similarly among the different traits negative correlation was observed between plant height and number of leaves (-0.354), plant height and stem girth(-0.280), number of leaves and stem girth (-0.412), number of leaves and groat yield (-0.021), number of leaves and dry weight (-0.500), number of leaves and dry matter yield(-0.186), leaf length and stem girth (-0.684), leaf length and green weight (-0.187), leaf breadth and stem girth (-0.505), leaf breadth and leaf stem ratio (-0.067), leaf breadth and dry weight (-0.294), leaf breadth and grain weight (-0.223), leaf breadth and dry matteryield (-0.011), stem girth and panicle length (-0.539), stem girth and number of spikelet’s/panicle (-0.581), stem girth and 1000 seed weight (-0.627), stem girth and groat yield (-0.453), stem girth and days to flower (-0.855), stem girth and leaf stem ratio (-0.780), stemgirth and dry weight (-0.287), panicle length and 1000 seed weight (-0.292), panicle length and groat yield (-0.112), panicle length and grain weight (-0.316), spike length and 1000 seed weight (-0.030), spike length and dry weight (-0.129), spike length and grain weight(-0.018), number of spikelet’s/panicle and 1000 seed weight (-0.093), number of spikelet’s/panicle and dry weight (-0.137), number of spikelet’s/panicle and grain weight (-0.211), days to flower and dry weight (-0.110). Efforts should be made to reduce the affect ofnegative correlations where green fodder is involved while going for direct selection [10].
Positive correlation of a particular character with green fodder yield does not necessarily mean a direct, positive effect of that trait on yield. To overcome this, Path coefficient analysis measures the direct and indirect influence of a variable on the dependent trait andis an effective device for selecting meritorious characters to be used in selection programmed to get maximum yield. Therefore, path coefficient analyses which analyses cause & effect relationships and partitions the correlation into direct and indirect effects were carriedout.
Path analysis (Table 2) showed that maximum amount of positive direct effect was exerted by dry matter yield (0.867), number of spikelet’s/panicle (0.382), dry weight (0.235), spike length (0.250) and leaf stem ratio (0.145), High positive effect on green fodder yield was shown by dry matter yield (0.957), dry weight (0.635) followed by leaf stem ratio (0.433), plant height (0.427), leaf length (0.320), groat yield (0.268), days to flower (0.211). This positive affect on green fodder yield as shown by above traits is supplemented further by the indirect affect of other traits..
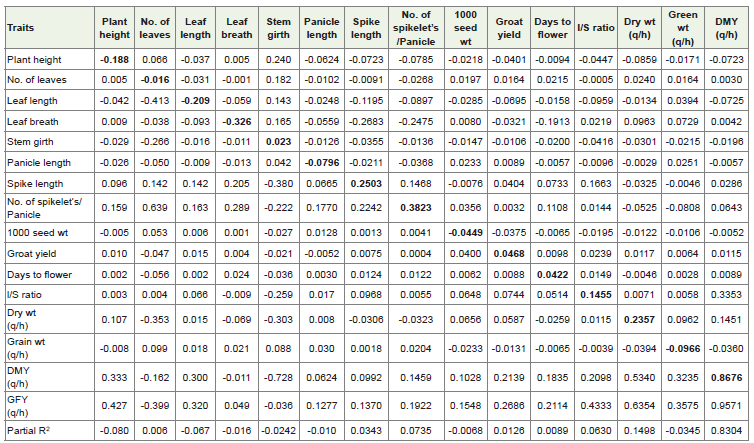
Table 2: Estimates of direct and indirect effects on green fodder yield and related traits.
Negative direct effect of green fodder yield were exerted by plant height (-0.188), leaf length (-0.209), leaf breadth (-0.326), panicle length (-0.079), 1000 seed weight (-0.044). However there were indirect affect on green fodder yield which ultimately contributesto direct affect on yield. The positive direct affect of leaf stem ratio (0.145) is due to contribution from dry matter (0.209) and spike length (0.166). Similarly for days to flower (0.042) it is due to indirectaffect of number of spikelets/panicle (0.110) and number of leaves (0.021). Indirect effect on improvement in green fodder yield was exerted by almost all the traits except number of leaves and stem girth. So a selection for all these traits will helps in improvement ofgreen fodder yield. For spike length (0.250) it is due to number of spikelets/panicle (0.224). For the traits like leaf length has negative direct affect (-0.209) but with the contribution from indirectly affecting traits like spike length (0.142), number of spikelets/panicle(0.163) it gives positive affect on green fodder yield (0.320). Results are in accordance with earlier findings of Ahmed et al. (2013). Likewise for plant height which has negative direct affect (-0.188) and positive affect from indirectly affecting traits like number of spikelets/ panicle (0.159) it gives positive affect on green fodder yield (0.427). This means that positive affect on green fodder yield has come from indirectly affecting traits (Table 1). Similar results were reported by Bibi et al. [11], Buerstmayr et al. [12], Moradi et al. [13]. Choubey et al. [14] reported that green fodder yield exhibited a significant positive association with tiller number (0.61), plant height (0.43 cm), leaf width (0.43 cm), and dry fodder yield (0.80 g). In path and regression analysis, number of tillers (0.66) and leaf width (0.41) showed high positive direct effects on green fodder yield. Internodes length behaved as an independent trait, while dry matter percentage was negatively associated with green fodder yield. Flag leaf length (0.33 cm) and leaf length (0.33 cm) influenced the green fodder yield in the same proportion.
Diversity analysis
The importance of genetic divergence for improving yield potential through hybridization has been emphasized and reviewed by Frey [15]. Although, it has been appreciated by breeders, the basic difficulty has always been reliable estimation of such diversity without making actual crosses [16]. Ahmed et al. [3] studied clustering pattern in seventy five germplasm lines of oat for yield and contributing traits using D2 analyses. Analysis of variance revealed the significant differences among the lines studied indicating the sufficient geneticvariation among the lines for all the traits used in the study. The D2 analysis on morphological traits grouped the fifty lines into ten clusters based on distance ranges for the tree shown in (Figure 2).
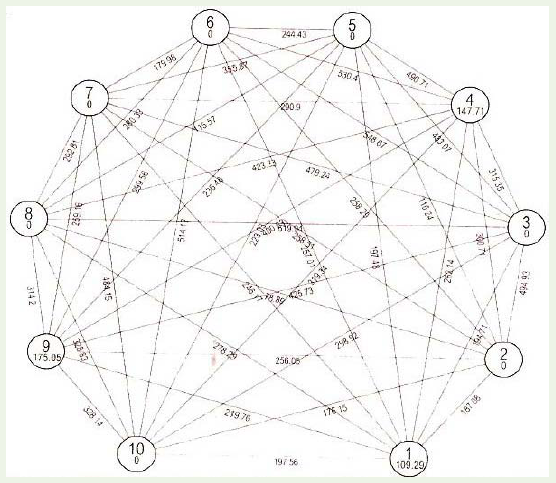
Figure 2: Cluster analysis for XVI different traits.
Cluster I includes 37 numbers of lines, Cluster IV and IX includes three lines and Cluster II, III, V, VI, VII, VIII and X includes one line each (Table 3). Maximum numbers of lines were observed in Cluster I. The Cluster with higher number of lines means had narrowgenetic diversity and they are more closely related. A crossing within this cluster will be of less use in improvement programme. Results of cluster analysis indicated that the highest intra cluster distancewas observed for cluster IX (175.05) followed by cluster IV (147.71), cluster I (109.29), indicating that lines in these cluster are relatively more diverse among themselves. The maximum inter cluster distanceobserved was (619.94) between cluster VIII and III followed by cluster VI and III (548.67), cluster VI and IV (530.40), cluster X and VI (514.17), cluster III and II (494.93), cluster V and IV (490.71), clusterX and VII (484.15), cluster VII and III (479.24), suggesting significant diversity among lines of these clusters (Figure 2). The inter cluster distances were higher than intra cluster distances suggesting presenceof high genetic diversity between the lines of any two cluster than the lines present within the cluster (Table 3). So crossing between lines belonging to these clusters may result into high heterosis, which could be exploited in oat improvement. The least inter cluster distance was observed between clusters VIII & II (78.8), Cluster V& II(110.24), cluster VIII & V (115.57), cluster X & II(176.15) and cluster VII & VI (179.8) indicating the narrow genetic diversity and close relationship for many traits of the lines in these clusters. Singh andSingh [4] studied the D2 analyses in 70 oat genotypes and grouped into seven clusters and two ungrouped clusters. Cluster I was the largest and contained 16 genotypes.
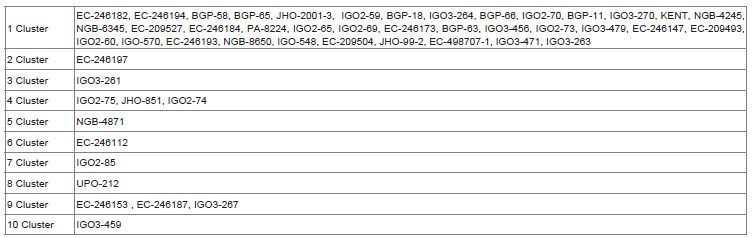
Table 3: Clustering pattern analysis for 50 lines based on D2 analysis.
Cluster means for different traits are presented in (Table 4). Cluster II, cluster VI and cluster X showed maximum number of prominent traits followed by cluster IV and cluster V. Cluster II is characterized by line having maximum number of prominent traits like plant height (143.8), number of leaves (5.67), leaf length (45.77),stem girth (1.63), panicle length (66.63), number of spikelet’s/panicle (81.56), dry weight (526.14), grain weight (89.91), green fodder yield (765.9), dry matter yield (289.9). Cluster VI characterized byline having prominent traits for number of leaves 5.33, leaf length 57.26, leaf breadth 2.12, stem girth 1.51, 1000 seed weight 45.00, groat yield 30.00, dry weight 542.79, grain weight 154.01, green fodder yield685.98, and dry matter yield 325.45 and Cluster X is characterized by line having prominent traits for number leaf length 46.91, leaf breadth 2.11, panicle length 62.98, spike length 33.58, 1000 seed weight 41.67,groat yield 31.67, days to flower 107.67, leaf stem ratio 0.81.
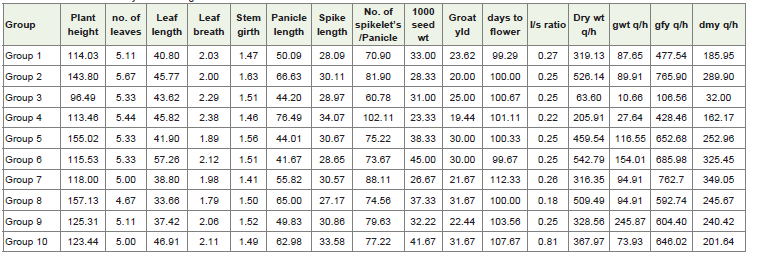
Table 4: Means of different yield affecting traits in different clusters.
Such clustering helps in selecting desirable individuals with specific traits for crossing program. Plant height, number of leaves, leaf length, stem girth, panicle length, number of spikelet’s/panicle,dry weight, grain weight, green fodder yield, dry matter yield has contributed more towards divergence, so the direct selection for these traits would be helpful. Similar results were reported by Ahmed et al.[3].
The highest contribution to total diversity (Table 5) was exerted by dry matter yield (22.61%) and it appeared as first for 277 times followed by plant height (15.92%) and it appeared first for 195 times; similarly panicle length (15.67%) and it appeared first for 192 times; dry weight (13.88%) and it appeared first for 170 times; number of spikelet (10.04%) and it appeared first for123 times; grain weight (8.65%) and it appeared first for106 times; days to flower (8.08%) and it appeared first for 99 times; green fodder yield (3.67%) and it appeared first for 45 times; 1000 seed wt. (0.90%) and it appeared first for11 times; spike length (0.41%) and it appeared first for 5 times; groat yield (0.16%) and it appeared first for 2 times (Table 6). Plant height, panicle length, number of spikelet’s/panicle, days to flower, dry weight, grain weight , green fodder yield, dry matter yield havecontributed more towards divergence, so the direct selection for these traits would be helpful. Similar results were reported by Ahmed et al. [3], Achleitner et al. [2], Choubey et al. [17] and Krishna et al.[18] They reported diversity among the genotypes measured by inter cluster distance was adequate for improvement of forage oat by hybridization and selection. Tiller number, number of leaves and flag leaf length were the main traits for selection of high yielding types. The cultivars included in the diverse clusters can be used as promisingparents for hybridization to obtain high heterotic response and thus better segregants in forage oat.
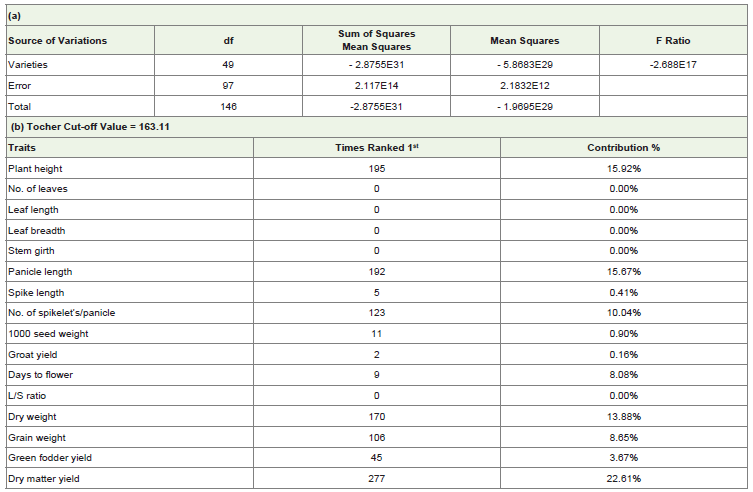
Table 5: ANOVA for dispersion (a) and contribution made by individual trait in total diversity (b).
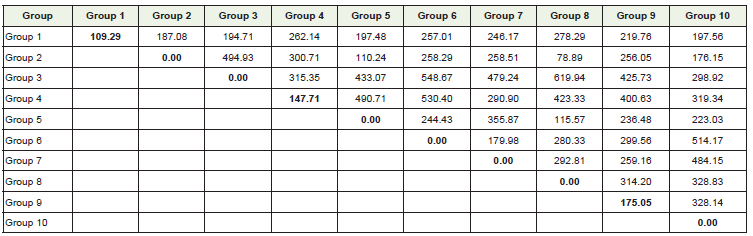
Table 6: Inter and Intra cluster distances for various traits.
Principal component analysis revealed (Table 7) that first 6 most informative components accounted for 84.95% variance. Traits were determined on the basis of factor loadings and traits with higher weighting were plant height 0.49, panicle length 0.32, number of spikelet’s/panicle 0.21, days to flower 0.13, dry weight 0.46, grain weight 0.14, green fodder yield 0.14, dry matter yield 0.53 in PC 1; plant height 0.07, number of leaves 0.03, leaf length 0.03, leaf breadth0.04, panicle length 0.65, spike length 0.02, number of spikelet’s/ panicle 0.47 in PC 2; plant height 0.46, number of leaves 0.01, stem girth 0.02, 1000 seed weight 0.24, dry weight 0.33, in PC 3; plant height 0.30, number of leaves 0.04, leaf length 0.09, leaf breadth0.03, spike length 0.19, number of spikelet’s/panicle 0.46, 1000 seed weight 0.17, groat yield 0.14, days to flower 0.31, grain weight 0.20, dry matter yield 0.03 in PC4, plant height 0.32, number of leaves 0.06,leaf length 0.09, 1000 seed weight 0.04, groat yield 0.03, dry matter yield 0.21 in PC 5, plant height 0.26, number of leaves 0.05, panicle length 0.10, grain weight 0.59, dry matter yield 0.06 in PC 6 (Table 7). Results are in accordance with earlier findings of Singh and Singh [4],Ahmed et al. [10]. The principal component analysis (PCA) in general confirmed the groupings obtained through cluster analysis. In some cases, individuals in different cluster pair with lines of different clusters. This shows those clusters appears to be homogeneous from outside but actually are heterogeneous within the cluster. This willprovide opportunity to identify best genotypes to be used in breeding.
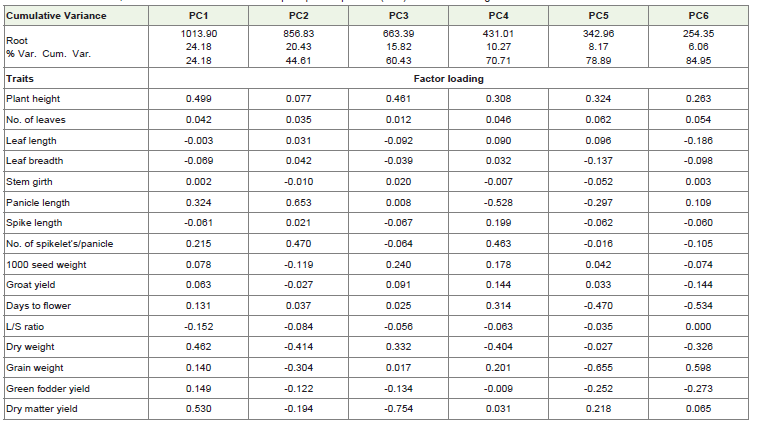
Table 7: Canonical Roots, cumulative variance of the first six principal components (PCs) and factor loading between PCs and traits studied.
Conclusions
The study helps in determining the positive and negative correlations among different traits and traits which can utilized directly for selection of best performing genotypes for high green fodder yield. Path coefficient analysis measures the direct and indirect influence of variables on the green fodder yield and helps in selecting meritorious characters to be used in selection programme to get maximum yield. The relationships must be taken into considerationas a change on one during selection might lead to change in other performing traits. The study also helps in understanding the diversity available in the genotypes selected and helps in selection and improvement of desirable traits to be used or transferred duringcrossing program.
References
- Chatterjee B N, Das PK (1989) Forage crop production. pp 484.
- Achleitner A, Tinker NA, Zechner E, Buerstmayr H (2008) Genetic diversity among oat varieties of worldwide origin and associations of AFLP markers with quantitative traits. Theor Appl Genet 117: 1041-1053.
- Ahmed S, Roy AK, Majumdar A B (2011) Genetic diversity and variability analysis in oat (Avena sativa L.). Range Mgmt. & Agroforestry. 32: 96-99.
- Singh SB, Singh AK (2011) Genetic variability and divergence analysis in oat (Avena sativa) under rainfed environment of intermediate Himalayan Hills. Indian J Plant Genet Resour 24: 57-62.
- Johnson HW, Robinson HF, Comstock RE (1955b) Genotypic and phenotypic correlation in soybeans andtheir implication in selection. Agron J 47: 477-482.
- Mahalanobis PC (1928) A statistical study at Chinese head measurement. J Asiatic Soc Bengal 25: 301-377.
- Rao CR (1952) Advanced biometrical methods in biometric research. John Wiley and Sons Inc. New York. 357-363.
- Mahalanobis PC (1936) On the generalized distance in statistics. Proc Nat Acad Sci India 12: 49-55.
- Ahmed S, Roy AK, Majumdar AB (2013) Correlation and path coefficient analysis for fodder and grain yield related taits in oats (Avena sativa). Annals of Biology 29: 75-78.
- Ahmed S, Kamaluddin (2013) Correlation and path analysis for agro-morphological traits in Rajmashbeans under Baramulla-Kashmir region. Afric J Agric Res 8: 2027-2032.
- Bibi A, Shahzad AN, Sadaqat HA, Tahir MHN, Fatima B (2012) Genetic characterization and inheritancestudies of oats (avena Sativa l.) For green fodder yield. Int J Bio Pharmacy and Food Sci 1: 450-460.
- Buerstmayr H, Krenn N, Stephan U, Grausgruber H, Zechner E (2007) Agronomic performance and quality of oat (Avena sativa L.) genotypes of worldwide origin produced under central European growing conditions. Field Crops Res : 341-351.
- Moradi M, Rezai A, Arzani A (2005) Path analysis for yield and related traits in oats. Journal of Science and Technology of Agriculture and Natural Resources 9: 173-180.
- Choubey R N, Sai Prasad S V, Zadoo S N and Roy A K (2001) Assessment of genetic diversity and inter-relationships among yield contributing traits in forage oat germplasm. Forage Res. 27: 149-154.
- Frey R J (1971) Improving crop yields through plant breeding in moving of yield plateau. American Society of Agron 20: 15-58.
- Bhatt GM (1970) Multivariate analysis approach to selection of parents for hybridization aiming at yield improvement in self pollinated crop. Australian J of Agric Res 21: 1-7.
- Choubey RN, Sai Parsad S V and Roy A K (2001) Study on variability, associations and path analysis in forage oat. Range Mgmt. & Agroforestry. 22: 188-192.
- Krishna A, Shahid A, Pandey HC, Bahukhandi D (2013) Estimates of Genetic variability, heritability and genetic advance of oat (Avena sativa L.) genotypes for grain and fodder yield. Agricultural Science Research Journals 3: 56-61.