Assessment of Enzyme Activity and Functional Microbial Diversity in Coastal and Desert SoilEcosystems of Gujarat
Purvi Zaveri, Rushika Patel, Pooja Rana, Bhruvi Shah, Neelam Mahto and Nasreen S Munshi*
Institute of Science, Nirma University, Sarkhej-Gandhinagar Highway, Ahmedabad 382 481, Gujarat, India
Corresponding author: Dr. Nasreen S Munshi, Institute of Science, Nirma University, Sarkhej - Gandhinagar Highway,Ahmedabad 382 481, Gujarat, India; Phone: +91-2717-241900-04, Ext.: 755, Mobile: 09898598296, Fax: +91-2717-24191617; E-mail: nasreen.munshi@nirmauni.ac.in, nasreenhaque@hotmail.com
Citation: Zaveri P, Patel R, Rana P, Shah B, Mahto N, Munshi NS. Assessment of Enzyme Activity and Functional Microbial Diversity in Coastal and Desert Soil Ecosystems of Gujarat. J Enzymol Metabol. 2016;2(1): 107.
Copyright © 2016 Nasreen S Munshi, et al. This is an open access article distributed under the Creative Commons Attribution License, which permits unrestricted use, distribution, and reproduction in any medium, provided the original work is properly cited.
Journal of Enzymology and Metabolism | Volume: 2, Issue: 1
Submission: Submission: 03/06/2016; Accepted: 21/06/2016; Published: 27/06/2016
Abstract
All living beings of various trophic levels in ecosystem depend on the soil as a source of nutrients and depend on soil organisms torelease and recycle key nutrient elements by decomposing organic residues. Microbiota of soil plays critical role in the maintenance ofsoil health and quality by secreting important enzymes, which are capable of function even after being released by the cell. Comparingvarious types of soils, salinity is profoundly observed in coastal and desert region. Study of such type of soil may give insights forunderstanding the variations in microbial community and effect of various abiotic factors like, salt concentrations on the same. Studyingdiversity at the ecosystem level is important to understand range of processes and complexity of interactions. Polyphasic approachof studying microbial community by C source utilization profiling and soil enzyme activity measurement was employed in this study tocompare desert and costal ecosystems. Functional diversity was studied by CLPP method using Ecoplate®. Six different soil enzymeactivities were investigated. In some samples protease, urease and L-asparaginase activity were not detected at all. β-glucosidase andL-asparaginase showed significant positive correlation with all functional diversity indices, most of the microbial groups and temperaturewhile negatively correlated with moisture and pH respectively. Alkaline phosphatase activity negatively correlated with temperature. PCAanalysis based on enzyme activity showed that samples were grouped together geographically or according to the source of origin.
Keywords: Coastal and desert soil; Community Level Physiological Profiling (CLPP); Soil enzyme activity; Principle ComponentAnalysis (PCA)
Introduction
Soil is fundamental and irreplaceable; it governs plant productivityof terrestrial ecosystems and it maintains biogeochemical cycles [1].Members of all trophic levels in ecosystem depend on the soil as asource of nutrients and also depend on soil organisms to release andrecycle key nutrient elements by decomposing organic residue [2]. Soil is a structured, heterogeneous and discontinuous system with microorganisms living in discrete microhabitats. Composition and activity of such habitat depends on soil texture, concentrations ofvarious salts, moisture, pH and temperature of soil. Out of variouscategories of soil, desert and costal ecosystems are comparable intheir salinity but they differ significantly in various other factors.Microbiota of soil plays critical role in the maintenance of soilhealth and quality by secreting important enzymes like, degradativeenzymes, which even function after being released by the cell. Suchmicroorganisms are involved in important soil ecological functionslike nutrient cycling and environmental detoxification. Each species displays variety of morphological, physiological, and behaviouraltraits, many of which might influence the abundance of species andecosystem functioning [3].
Such enormous number of organisms requires set of specifictechniques to evaluate them. Studying diversity at the ecosystemlevel is important to understand range of processes and complexityof interactions. To reveal such complex interdependent system ofmicrobial flora and their function, culture dependent and independentmethods like, FISH, qPCR, DGGE and CLPP have been developed.Community Level Physiological Profiling has been widely used forcharacterizing various ecosystems like water, wastewater, varioussoil types and even biofilms. The contribution of microorganism insuch system indirectly also is determined in terms of quantitativemeasurements of soil enzyme activity.
Enzyme activities are essential for energy transformation andnutrient cycling [2]. From an ecological perspective, extracellular enzymes are the mediators of decomposition, dissolved organic carbon(C) production, as well as nitrogen (N), and phosphorous (P) mineralization. According to location of the enzymes, they may be (1)Intracellular enzymes, (2)Periplasmic enzymes, (3) Enzymes attachedto outer surface of cell membranes, (4) Enzymes released duringcell growth and division, (5) Enzymes within non proliferating cells(spores, cysts, seeds, endospores), (6) Enzymes attaches to dead cellsand cell debris, (7) Enzymes leaking from intact cells or released fromlysed cells, (8) Enzymes temporarily associated in E-S complex and(10) Enzymes adsorbed to surfaces of clay minerals. Extracellularenzymes are the proximate agents of organic matter transformationin soils, however all of the above mentioned are important fornormal functioning of ecological niche. Due to the effects of externaldisturbances on their activity, enzymes can serve as sensitiveindicators of soil quality [4]. Soil enzyme activities have been related to soil physico-chemical characters, microbial community structure, vegetation, disturbance and succession.
Earlier studies have shown use of substrate utilisation profiles andenzyme activities along with the culture methods of functional groupsof organisms as a Polyphasic approach to be useful for characterisingcoastal microbial communities [5]. Hence this study was undertaken to understand the functional diversity and their correlation with all functionally relevant enzyme activities in salt affected ecosystems. In India, state of Gujarat has the longest coastal belt of the country. Here coastal areas where salinity is contributed by sea water and inland desert areas where inherent salinity is present were expected to have similar microbial activities. Soil enzyme activities are considered as a measure of soil functional diversity, and are contributed by both the types of microbes, cultivable as well as uncultivable. Hence, this study is focused on the objective of determining any correlation between the enzyme activities of various salt affected lands of the state with functional diversity determined using community level physiological profiling. Among the different enzymes involved in nutrient cycling, β-glucosidase, protease, urease, cellulase, L-asparginase and phosphomonoesterase and dehydrogenase were studied [6].
Materials and Methods
Composite soil samples were collected from various coastal and desert regions of Gujarat (Table 1) [1]. Samples were stored at lower temperatures until they were processed for various physico chemical and microbial analysis. Table 1 enlists the sites of sampling and codes used here.
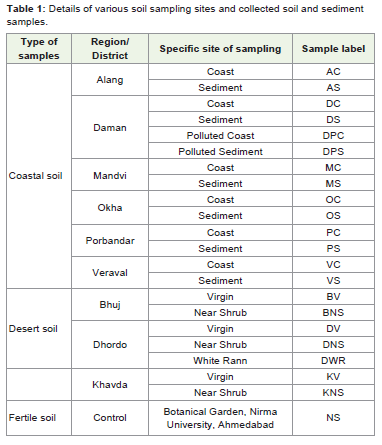
Table 1: Details of various soil sampling sites and collected soil and sedimentsamples.
Determination of abiotic parameters
Various physico-chemical parameters like pH, temperature,moisture, water holding capacity, salinity, chloride, conductivity,organic carbon and total nitrogen were determined from soil andsediment samples [1,7,8].
Community level physiological profiling
Ecoplates® (Biolog® Inc., Hayward, California) containing 31different C substrates in triplicates were inoculated with 100 μl of appropriately diluted soil suspensions [9]. Plates were incubatedat 30 ± 2 °C. Thirty one environmentally important substrates(Carbohydrates (10), Carboxylic and acetic acid (9), Amino Acids(6), Polymer (4) and Amine/ amides (2)) were analysed for theirusability by microbial communities present in the whole soil samples.The dye tetrazolium in wells was reduced to produce violet colour dueto microbial degradative activity and colour intensity was measuredspectrophotometrically at regular time intervals in a microplatereader (Bio-Rad Laboratories Inc., Elisa Plate reader Model no. 680,Japan) [10].
Various diversity indices values were calculated using collecteddata of average well colour development and following formula [11].

Where,
S = Number of species or Number of carbon substrates used inEcoplate®.
n = Number of individuals in all species or sum of responses inall the wells or C substrates.
H’ = Shannon diversity index.
The Margalef (1958) equation is based on the assumption that arelationship exists between S and n, total number of individual.
Where,
S = Number of species present or Number of C sources utilized
n = Number of individuals in all species or Sum of response of allthe wells containing C sources.
The other component of species diversity indices is speciesevenness, which indicates the distribution of the individuals withinspecies designations. This index group includes species abundancesin its calculation. The evenness index that is most widely used is theratio of the Shannon index [11,12]. Out of various described evennessvalues, EPielou was calculated using following formula,
Where,
H’= Shannon-Wiener diversity value
S = Number of species present or Number of Carbon sourceutilized.
Quantitative measurement of various enzyme activities
Various enzymes having important functional roles in ecosystemcan be categorised according to biogeochemical cycles they contributeto [6].
Enzymes involved in Nitrogen cycling
(i) Urease and L-asparaginase activity
For estimation of urease and L- asparaginase activity, beforeproceeding for actual procedure, 5 g soil was treated with 0.2 mltoluene and 9 ml of Tris buffer (50 mM, pH 9), the content was mixedproperly. Treated soil samples were added with 1 ml urea or 1 ml 0.5M L- asparagine solution and incubated for few seconds. After theincubation of 2 hour at 37 °C, approximately 35 ml of KCl-Ag2SO4(100 mg-1) solution was added. Content was brought up to 50 mlby addition of KCl-Ag2SO4 solution and it was mixed thoroughly.The resulting solution was used to estimate released ammonia usingmethods described by Bremner and Keeney (1966). Calibration curvewas prepared using standard ammonia solution (50 μg NH4-N ml-1)[14].
Urease activity (μg NH4-N g-1 dwt 2h-1)
Where,
C = measured NH4-N concentration (μg NH4-N ml-1 soilsuspension),
dwt = dry weight of 1 g moist soil
(ii) Protease activity
It was performed using methods described by Ladd and Butler(1972). One gram of moist, sieved soil (2mm) was placed in a test tube, and 5 ml of Tris buffer (50 mM pH 8.1) and 5 ml of sodiumcaseinate solution (2%) were added to it. Contents were mixedand incubated for 2 h at 50 °C on a water bath. Five ml of TCAsolution (15%) was added and mixed thoroughly. The resulting soilsuspension was centrifuged at 12,000 rpm for 10 min. Five ml ofthe clear supernatant was mixed with 7.5 ml of the alkaline reagentand incubated for 15 min at room temperature. After addition of5 ml of the Folin reagent, mixture was filtered through Whatmanfilter. Absorbance was measured after 1 h of incubation at 700 nm.Calibration curve was prepared using standard tyrosine solution 500μg ml-1. The measured absorbance was corrected for the controls andwas calculated as follows,
Proteae activity (μg tyrosine g-1dwt 2h-1)
Where,
C = measured tyrosine concentration (μg ml-1 supernatant),dwt = dry weight of the 1 g of moist soil
Enzymes involved in Phosphorous cycling
(iii) Phosphomonoesterase has been reported to be involved inhydrolysis of organic phosphomonoester to inorganic phosphorousand makes it available for plants. Activity of this enzyme wasdetermined by Tabatabai and Bremner (1969). One gram of moist, sieved soil was treated with 0.25 ml toluene and 4 ml of ModifiedUniversal buffer (pH 6.5 in assay of acid phosphatase, and pH 11)with 1 ml of p-Nitrophenyl phosphatase (15 mM) made in samebuffer. The content was mixed and incubated for 1 h at 37 °C, afterincubation 1ml of CaCl2 (0.5 M) and 4 ml of NaOH (0.5 M) wereadded to the prepared mixture. The content was mixed and soilsuspension was filtered through Whatman filter paper and number2v absorbance was measured at 400 nm. P- nirophenol solution (15mM) was used to prepare standard curve and activity was calculatedusing following formula. The result was corrected for the blank andwas calculated according to the following relationship:
p- Nitrophenol (μg g-1dwth-1)
Where,
C= measured phenol concentration (μg phenol ml-1 filtrate) , v =total volume of the soil suspension in ml
dwt = dry weight of 1 g of moist soil
t = incubation period
SW = Weight of soil sample
Enzymes involved in Carbon cycling
(iv) β- Glucosidase
Activityof β- glucosidase was measured using 1 g of moist sievedsoil treated with 0.25 ml of toluene and 4 ml of MUB solution. 1 ml ofp- nitrophenol β-glucoside (PNG) (25 mM) was allowed to react withsoil and mixture was incubated for 1 h at 37 °C. After the incubation,1 ml of CaCl2 solution (0.5 M), 4 ml of TRIS buffer (0.1 M, pH 10)were added, the flask was swirled and soil suspension was filteredimmediately. Colour intensity was measured at 400 nm using UVVisiblespectrophotometer [16,17]. Calibration curve was preparedby using standard p-nitrophenol solution (25 mM). The result wascorrected for the blank and was calculated according to the followingrelationship:
p- nitrophenol (μg g-1dwth-1)
Where,
C= measured phenol concentration (μg phenol ml-1 filtrate)
dwt = dry weight of 1 g of moist soil
t = incubation period
SW = Weight of soil sample
(v) Cellulase activity
For cellulase activity, 1 g of moist soil was treated with 5 ml ofacetate buffer (0.1 M) and 0.5 g of Avicel were added. Tubes wereincubated for 16 h at 40 °C in shaking conditions. Reaction was stoppedby centrifugation (2500 g, 10 min.). One ml of supernatant was addedwith 1 ml of Copper reagent and were kept in a boiling water bath for20 min. After cooling 1 ml of diluted Arsenate-molybdate solutionwas added and mixed thoroughly. The mixture was diluted with 3ml of distilled water and optical density was measured at 520 nm.Calibration curve was prepared using glucose monohydrate solution(28 μg ml-1). Following formula was used to determine activity.
Glucose (μg g-1 dwt 16 h-1)
Where,
C= measured glucose concentration (μg ml-1 supernatant)
v= volume of the soil suspension (5.5 ml)
dwt = dry weight of 1 g of moist soil
Dehydrogenase activity
(vi) Dehydrogenase activity
It was performed by methods described by Thalmann [18]. Fivegram of moist soil was treated with 5 ml of Triphenyltetrazolium chloride (TTC) (1%) and was incubated for 24 h at 30 °C in dark.Controls contained 5 ml of Tris buffer and treated as samples up toend of the process. After incubation, 40 ml of acetone was addedto each flask and the flasks were shaken thoroughly and furtherincubated at room temperature for 2 h in dark. The soil suspensionwas then filtered in dark and the colour optical density of the clearsupernatant was measured at 546 nm (red colour). Calibration curvewas prepared using Triphenylformazan (500 μg TPF ml-1) and resultswere calculated using following formula.
Dehydrogenase activity TPF (μg)/dwt (g)
Formula
Where,
dwt = dry weight of 1 g of moist soil
5 = moist soil used (g)
45= volume of the solution added in soil for assay
Results and Discussion
Physico-chemical analysis
Table 2 Physico-chemical characteristics of soil and sediment samples.
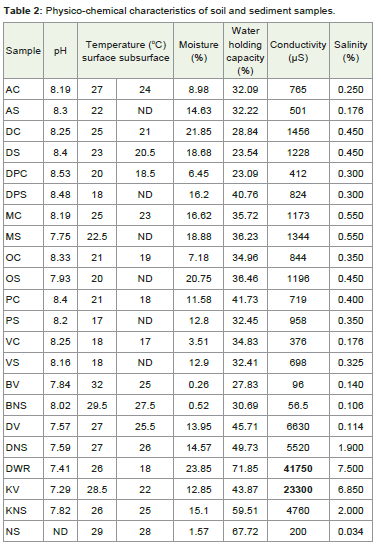
Table 2: Classification of Enterovirus along with their serotypes.
Highest pH was found to be in Daman Polluted coast (8.53)and lowest was found to be in Khavda Virgin soil (7.29). The coastalsamples were more alkaline than dessert samples. Soil pH also affectsthe activity of enzymes due to the pH sensitivity of amino acidfunctional groups that alter conformational and chemical changesof amino acids essential for binding and catalysis. The pH can alsoaffect enzyme activity by influencing the concentration of inhibitorsor activators in the soil solution and the effective concentration of thesubstrate [19].
The electrical conductivity (EC) in various soil samples of coastand desert regions of Gujarat ranged between 56-41750 mS/cm.Temperature was found below 30 oC at all the sampling sites due towinter being the season of sample collection. Significant differencebetween temperature of surface and subsurface of sampling sites werenoted and was found that dessert samples showed higher differencethan coastal samples.
Highest salinity in coastal samples was found in Mandvi regionand lowest in Veraval Coast and Alang soil Sediment. In desert sampleshighest salinity was in soil sample of Dhordo White Rann (7.5%) and lowest was found in soil collected from Bhuj near shrub (0.106%).The studies by Moradi et al.[20], have shown that the heterotrophicbacterial population in each soil sample was significantly less in thepresence of salt. Soil salinity is a stress factor relating to microbialselection process and can reduce bacterial diversity and controlmicrobial abundance, composition and functions. A directcorrelation was seen between salinity and electrical conductivity in allsoil samples (r = 0.95**). The highest EC was found in Dhordo WhiteRann (41750 mS/cm) and lowest was found in Bhuj Near Shrubsample (56.5 mS/cm).
Overall moisture content was found to be high by varying in therange of 3-24%. The moisture content of the soil causes the soil tocompact. Studies had shown that the compact soil had significantlylower biomass C (38% decrease) and lower enzyme activities (decreasein range from 41-75%) than the un-compacted soil [21-23].
Microbial diversity analysis
Functional Diversity based on CLPP was first analysed bycomparing AWCD (Average Well Colour Development) patternsdisplayed by all samples along the incubation time till 137 h (datanot presented) and based on that, for calculation of diversity indices,the data of 98 h was selected. The C-source utilization by microbialcommunities of coastal soils was very poor as only two to threesubstrates were utilized by these communities, whereas among thedesert soils maximum 11 substrates out of 31 were utilized by Bhujsamples.
The total activity and AWCD was obtained in the followingdecreasing order, BNS > KNS > DPC > MC >DNS> PC > AC > DC> OC > VC (data of AWCD not shown). Higher total activity (n),richness and H, indices indicates a greater rate of substrate utilization(catabolic potential) by the microbial community and greaterfunctional diversity [24], however low total activity (n), substraterichness (S), diversity (H’) was observed in coastal and desert samples(Table 3). Highest H’ value was obtained in soil samples of Bhuj andlowest was obtained in Dhordo near shrub sample.
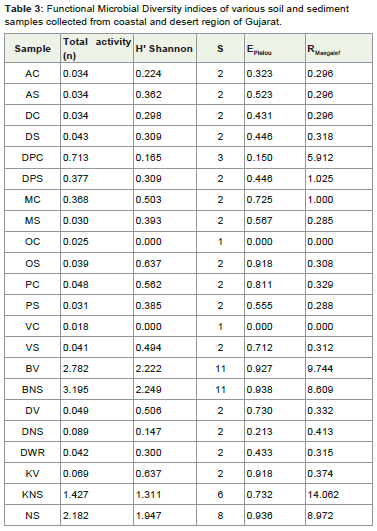
Table 3: Classification of Enterovirus along with their serotypes.
Table 4 presents the ‘r’ values for significant correlation betweendiversity indices and abiotic parameters. Pearsons’ correlation werecalculated between diversity indices and abiotic parameters and onlysignificant correlation values are presented. The coastal samples werehaving low richness as compared to desert samples, but microbialcommunity present were able to utilize more C sources.
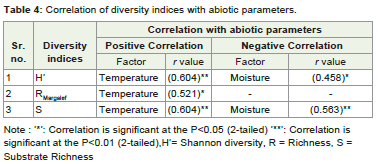
Table 4: Classification of Enterovirus along with their serotypes.
Diversity indices showed significant positive correlationwith temperature and negative correlation with moisture. i.e. astemperature increases, H’, richness and substrate utilized (S) alsoincrease while as moisture increases H’ and substrate utilized (S)decrease due to increased compactness of the soil.
Enzyme Activity
Nitrogen cycle enzymes
Nitrogen cycling is one of the most important nutrient cycles ofthe ecosystem. Soil becomes one of the largest return site of nitrogendue to tremendous involvement of nitrifiers and denitrifiers. Beforefunctions of such autotrophs come in picture, there is cascade ofenzyme functioning e.g. urease, asparaginase, protease etc.
(i) Urease Activity
Among various soil enzymes, urease (urea amidohydrolase,EC 3.5.1.5) is closely associated with the transformation, biologicalturnover and bioavailability of nitrogen and is a key enzyme [25,26].Since the relationship between increased salinity (or/and sodicity)and reduced urease activity appears to be highly predictable, it maybe used as indicator of soil quality [27].
However, coastal soil urease activity was falling in the range of0-5457 μg NH4-N g-1 dwt (Figure 1) which was found to be higherin some cases than desert region. Highest activity was observed inOkha sediment and lowest in Daman polluted sediment. In Mandvi,Veraval coast, and Daman coast soil samples urease activity was notdetected at all. In desert samples urease activity was found in therange of 0-758 μg NH4-N g-1 dwt 2h-1.
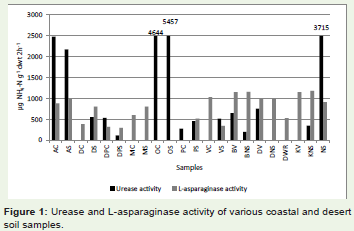
Figure 1: Classification of Enterovirus along with their serotypes.
Less enzyme secretion in most of desert soil may be explained bythe high salinity/sodicity of the soil. In addition, urease is extracellular,stable and form complexes with the organic and mineral colloids[28,29], while salinity may induce degradation in arid or semiaridsoils.
(ii) L-Asparaginase Activity
In general, L-Asparaginase activity was found to be quite highin all samples except Okha and Porbandar samples where it wasnot detected (Figure 2). In coastal samples, L-asparaginase activityfound was in the range of 300-1040 μg NH4-N g-1 dwt 2h-1. Highestactivity was observed in Veraval coast and lowest in Daman pollutedsediment. In desert samples L-Asparaginase activity was found in therange of 345-1200 μg NH4-N g-1 dwt 2h-1.
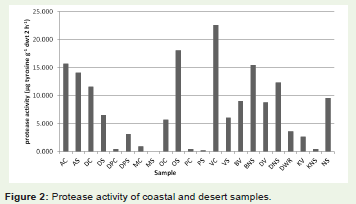
Figure 2: Classification of Enterovirus along with their serotypes.
(iii) Protease Activity
Daman, Mandvi and Porbandar among coastal samples had verylow protease activity while desert samples showed average activity(Figure 2). All the samples showed protease activity except Mandvisediment.
In coastal soil samples, protease activity was found in the rangeof 0-23 μg tyrosine g-1 dwt 2h-1. In desert samples protease activitywas found in the range of 0.4-16 μg tyrosine g-1 dwt 2h-1. Highest wasobserved in Bhuj near shrub and lowest in Khavda near shrub.
Carbon cycle enzymes
(i) β-Glucosidase Activity
The order of average β-glucosidase in costal soil was, MC> AC>OS> AS> OC> VC> PS> DS> DPS> VS> PC> DC (Figure 3). Analysisshowed that activity in soil collected from coast of Daman region wassignificantly lower than other samples (Activity being 0.50 μg g-1dwth-1). In desert samples, β-glucosidase activity was found in the rangeof 4.8-300 (μg g-1 dwt h-1). Highest activity was observed in Bhujsamples and lowest in Dhordo virgin soil sample.The specific activityof β-glucosidase has been correlated with monounsaturated fattyacids, typical of Gram-negative bacteria [30].
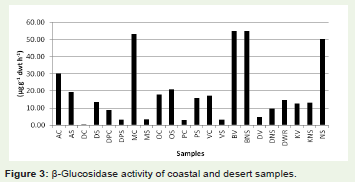
Figure 3: Classification of Enterovirus along with their serotypes.
The differences in the sources of substrate availability andcomposition may lead to the changed behaviours of the activity ofhydrolytic enzymes, such as phosphomonoesterase, urease andβ-glucosidase in soils. Soil organic carbon (SOC) and microbialbiomass have been reported to be negatively correlated in case ofwasteland soil ecosystem and β-glucosidase activity [31].
(ii) Cellulase activity
Cellulase activity was detected in all the coastal and desertsamples analyzed (Figure 4). In coastal samples, cellulase activity wasfound in the range of 1-72 (μg g-1 dwt 16 h-1). Highest activity wasobserved in OS (Okha sediment) and lowest in OC (Okha coast). Indesert samples, cellulase activity was found in the range of 7-44 (μgg-1 dwt 16 h-1).
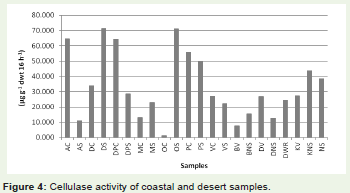
Figure 4: Classification of Enterovirus along with their serotypes.
Highest activity was observed in Khavda soil near shrub (KNS)and lowest in virgin soil of Bhuj. This may be due to the positiveeffect of plant organic matter present in soil near shrub. In general,coastal soils displayed higher cellulase activity as compared to desertsamples. In a field study conducted in the Negev Desert over threeseasons, concentration of cellulase in the soil was determined bymonitoring the rate of solubilization of chromophoric moleculescovalently linked to artificial insoluble cellulose (cellulose-azure). Itwas observed that, when cellulose of plant or paper origin was addedto the study soils it was influenced by the cellulose source. It was alsomarkedly affected by seasonal changes over the year [32].
P cycle enzymes
Phosphomonoesterase Activity
In coastal soil, alkaline phosphatase activity was found in therange of 88-443 p-nitrophenol μg g-1 dwt h-1 (Figure 5).
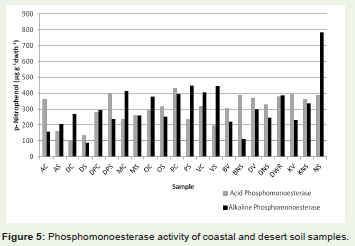
Figure 5: Classification of Enterovirus along with their serotypes.
All the samples tested from various region displayedPhosphomonoesterase activity. Highest activity was observed inVeraval sediment and lowest in Daman sediment. As reported byDick et. al.[21], low alkaline phosphatase activity was observed indesert samples as compared to acid phosphatase activity as the soilsalinity inhibited the enzyme activity of alkaline phosphatase.
Dehydrogenase Activity
Dehydrogenase activity in soil has been used as a measure foroverall microbial activity. Estimation of dehydrogenase activity in all coastal and desert soil samples indicates the presence ofmicroorganisms active in metabolism. Figure 6 displays the results ofdehydrogenase activity of samples.
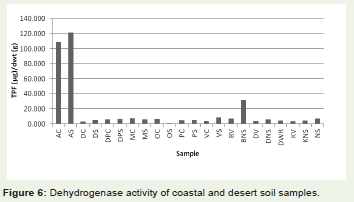
Figure 6: Classification of Enterovirus along with their serotypes.
In coastal soil samples, dehydrogenase activity was found in therange of 1-121 μg Triphenylformazan (TPF) /dwt (g), where as indesert soil samples, dehydrogenase activity was found in the range of3-31 TPF (μg)/dwt (g). Highest activity was observed in soil sample ofBhuj region collected around shrub and lowest activity was observedin Khavda soil sample unaffected by manual disturbances as well ashaving no plant growth.
Microorganisms growing under water-logged conditions havebeen shown to have lower TTC dehydrogenase activity [33]. However,only in Mandvi and Okha sediment soil, lower dehydrogenaseactivity than in coastal soil sample was observed. Studies have shownthat dehydrogenase activity can be severely inhibited by salinity [34],hence it was assumed that dehydrogenase activity was low due toinhibition by high salinity.
Principal Component Analysis of various enzyme activity
Enzyme activities of all the samples were analysed using PrincipalComponent Analysis (SPSS, ver. 17.0). Principle component analysisof enzyme activity data of coastal and desert samples is presented inFigure 7. On the basis of enzyme activity, soil samples were found tocluster together in 8 different groups according to regions except OS(Okha sediment). Coastal and sediment soil samples were groupedtogether while virgin and near shrub soil of desert samples weregrouped together, except for Bhuj samples which formed a differentcluster (as shown in blue colour).
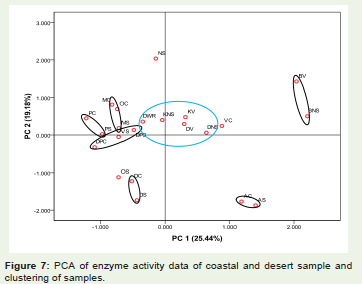
Figure 7: Classification of Enterovirus along with their serotypes.
Here total 3 principal components were extracted. The varianceexplained by PC1 was 25.44%, PC 2 was 19.18% and PC3 explained16.02% variance present in the data.
The correlation coefficient values were calculated from enzymeactivity data and various abiotic factors, where temperature wasobserved to be important factor affecting enzyme activity (Table 5).Pearsons’ correlation values were calculated between enzyme activityand abiotic parameters for analysis of positive and negative impact ofabiotic factors on enzyme functioning.
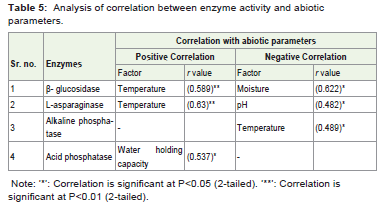
Table 5: Classification of Enterovirus along with their serotypes.
Enzyme activities of β-glucosidase and L-Asparaginase showeda significant positive correlation with temperature i.e. activity ofthese enzyme increases with the increase in temperature while theyshowed negative correlation with pH and moisture respectively i.e.activity of β-glucosidase decreases with increase in pH and activityof L-Asparaginase decreases with increase in moisture. Moisture wasseen to affect microbial activity and enzyme activity and a significantnegative correlation was observed in Pearsons’ bivariate correlationanalysis. Alkaline phosphatase showed negative correlation withtemperature and acid phosphatase showered positive correlationwith water holding capacity. Other enzyme activities didn’t show any significant correlation with abiotic parameters.
Diversity indices showed positive correlation with most of themicrobial groups (data not shown). When the enzyme activities werecorrelated with functional diversity indices values, significant positivecorrelation was found only for two enzyme assays (Table 6). Pearsons’ correlation coefficient values between functional diversity indices andsoil enzyme activity were analysed and only significant correlationcoefficient values are presented.
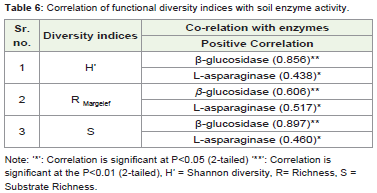
Table 6: Classification of Enterovirus along with their serotypes.
Diversity indices showed significant positive correlation withβ glucosidase and L-asparaginase. When enzyme activities werecorrelated with quantitative values of diversity indices, very highsignificant correlation values (r>0.8) were observed. Such highvalues were not obtained in other cases. Hence it can be concludedthat functional diversity deduced by CLPP could be correlated withthe soil enzyme activity and can give insight of ecosystems havingfunctionally active microbial systems.
Conclusion
Combination of two approaches, CLPP and enzyme activityquantification proved to be good tool to analyse functional microbialdiversity of coastal and desert regions of the state. One of the majorobservations of the study indicates that although being almost nearin salinity values, samples differed a lot in the functionality of themicrobial flora. Abiotic factors as reported have definite correlationwith enzyme activity and diversity indices. Looking to the valuesof diversity indices, microbial diversity was found to be low dueto effect of salinity of soil. However enzyme activity and diversityindices could be correlated very well, indicating strong influence ofmicrobial presence on nutrient cycling of such versatile ecosystem.Further analysis of community structure may help in dissecting theinteractions and identification of the type of microbes but CLPPand soil enzyme activity study hold the importance for evaluation offunctions of salinity affected soil systems.
References
- Alef K and Nannipieri P (1995) Methods in Applied Soil Microbiology and Biochemistry. Academic Press Ltd., London.
- Kandeler E (1996) Nitrate. In: Schinner F, Ohlinger R, Kandeler E, Margesin R (eds) Methods in soil biology. Springer, Berlin.
- Tilman D (2001) Functional Diversity. In:Encyclopedia of Biodiversity, St. Paul (ed.), vol 3, Elsevier, Germany.
- Baldrian P (2009) Microbial enzyme-catalyzed processes in soils and their analysis. Plant Soil Environ 55: 370-378.
- Biswas D, Mandal A, Akbari H, Munshi N (2013) Investigation of functional microbial diversity and related abiotic factors in coastal and desert ecosystem of gujarat. In: Prospects in Bioscience: Addressing the Issues, Springer, India.
- Tripathi S, Chakraborty A, Chakrabartia K, Bandyopadhyay BK (2007) Enzyme activities and microbial biomass in coastal soils of India. Soil Biol. Biochem 39: 2840-2848.
- Forster JC (1995) Ch 3 Soil sampling, handling, storage and analysis, In: methods in applied soil microbiology and biochemistry. Alef K. and Nannipieri P. (eds) Academic press limited, London.
- Gupta PK (2007) Methods in environmental analysis water, soil and air. (2ndedn), Agrobios, India.
- Preston-Mafham J, Boddy L, Randerson PF (2002) Analysis of microbial community functional diversity using sole-carbon-source utilisation profiles - a critique. FEMS Microbiol Ecol 42: 1-14.
- Zaveri P, Munshi N, Vaidya A, Jha S, Kumar GN (2015) Functional microbial diversity dynamics in common effluent treatment plants of South Gujarat and hydrocarbon degradation. Can J Microbiol 61: 389-397.
- ZakJC, Willig MR, Moorhead DL, Wildman HG (1994) Functional diversity of microbial communities: A quantitative approach. Soil Biol Biochem 26: 1101-1108.
- Pielou EC (1975) Ecological diversity. Wiley, New York.
- Bremner JM, Keeney DR (1966) Determination and isotope-ratio analysis of different forms of nitrogen in soils: 4. Exchangeable ammonium, nitrate, and nitrite by direct-distillation methods. Soil Sci Soc Am Proc 30: 583-587.
- Tabatabai MA, Bremner JM (1972) Assay of urease activity in soils. Soil Biol Biochem 4: 479-487.
- Tabatabai MA and Bremner JM (1969) Use of p-nitrophenyl phosphate for assay of soil phosphatase activity. Soil Biol Biochem 1: 301-307.
- Tabatabai MA (1982) Soil enzymes. In: Methods of soil analysis part 2, chemical and microbiological properties. Page A. L., Miller E. M., Keeney D. R. (eds). American society of agronomy, Madison, WI.
- Eivazi F, Tabatabai MA (1988) Glucosidases and galactosidases in soils. Soil Biol Biochem 20: 601-606.
- Thalmann A (1968) ZurMethodik der Bestimmung der Dehydrogenaseaktivität im Boden mittels Triphenyltetrazoliumchlorid (TTC). Landwirtsch Forsch 21: 249-258.
- Dick WA, Chenga L, Wang P (2000) Soil acid and alkaline phosphatase activity as pH adjustment indicators. Soil Biol Biochem 32: 1915-1919.
- Moradi A, Tahmourespour A, Hoodaji M, Khorsand F (2011) Effect of salinity on free living - diazotroph and total bacterial populations of two saline soils. African J Microbiol Res 5: 144-148.
- Dick RP, Myrold DD, Kerle EA (1987) Microbial Biomass and Soil Enzyme Activities in Compacted and Rehabilitated Skid Trail Soils. Soil Sci Soc America J 52: 512-516.
- Torbert HA, Wood CW (1992) Effects of soil compaction and water-filled pore space on soil microbial activity and losses. Commun. Soil Sci Plant Anal 23: 1321-1331.
- Orchard VA, Cook FJ (2002) Relationship between soil respiration and soil moisture. Soil Biol Biochem 15: 447-453.
- Frac M, Oszust K,Lipiec J (2012) Community level physiological profiling, characterization and microbial activity of soil amended with dairy sewage sludge. Sensors 12: 3253-3268.
- Liang YC, Yang YF, Yang CG, Shen QR, Zhou JM, et al. (2003) Soil enzymatic activity and growth of rice and barley as influenced by organic manure in an anthropogenic soil. Geoderma 115: 149-160.
- Yuan L, Huang J, Yu S (1997) Responses of nitrogen and related enzyme activities to fertilization in rhizosphere of wheat. Pedosphere 7: 141-148.
- Zhang YL, Chena LJ, Chenb XH, Tanb ML, Duan ZH, et al. (2015) Response of soil enzyme activity to long-term restoration of desertified land. Catena 133: 64-70.
- Garcia C, Hernandez T, Costa F (1997) Potential use of dehydrogenase activity as an index of microbial activity in degraded soils. Commu. Soil Sci Plant Anal 28: 123-134.
- Tripathi S, Kumari S, Chakraborty A, Gupta A, Chakrabarti K, et al. (2006) Microbial biomass and its activities in salt-affected coastal soils. Biol Fertil Soils 42: 273-277.
- Atlas RM, Bartha R (1993) Microbial ecology-fundamentals and applications. Benjamin-Cummings, Redwood City, CA.
- Shao X, Yang W, Wu M (2015) Seasonal Dynamics of Soil Labile Organic Carbon and Enzyme Activities in Relation to Vegetation Types in Hangzhou Bay Tidal Flat Wetland. PLoS One :e0142677.
- Doyle J, Pavel R, Barness G, Steinberger Y (2006) Cellulase dynamics in a desert soil. Soil Biol Biochem 38: 371-376.
- RothG (1965) The biochemical activity of soils: a new method of assessment. Proceedings of South African Sugar Technol. Assoc.
- Frankerberger WT, Bingham FT (1981) Influence of salinity on soil enzyme activities. Soil Sci Soc America J 46: 1173-1177.