Research Article
Targeted Screening of Macular Edema by Spectral Domain Optical Coherence Tomography for Progression of Diabetic Retinopathy
Sandeep Saxena*, Surabhi Ruia
Corresponding author: Dr. Sandeep Saxena, Department of Ophthalmology, King George's Medical UniversityLucknow, India, 226003, Phone: +91-9415160528; E-mail: sandeepsaxena2020@yahoo.com
Citation: Ruia S, Saxena S. Targeted Screening of Macular Edema by Spectral Domain Optical Coherence Tomography for Progression of Diabetic 02 Retinopathy. Indian J Ocular Biol. 2016;1(1): 102.
Copyright © Saxena S 2016. This is an open access article distributed under the Creative Commons Attribution License, which permits unrestricted use, distribution, and reproduction in any medium, provided the original work is properly cited.
Submission: 06/11/2015; Accepted: 04/02/2016; Published: 11/02/2016
Abstract
Background
Spectral domain optical coherence tomography (SD-OCT) is a highly sensitive, reliable, non invasive imaging tool. It is widely prevalent for application in diagnosis and management of various vitreoretinal diseases including diabetic retinopathy. This study aims to establish target screening of macular edema by SD-OCT for progression of diabetic retinopathy.
Methods
One hundred and seventy seven consecutive cases of type 2 diabetes mellitus were divided into three groups: diabetes without retinopathy(No DR; n=59), non-proliferative diabetic retinopathy (NPDR; n=59), and proliferative diabetic retinopathy (PDR; n=59). Fifty nine healthy controls were included. Central subfield thickness (CST) and cube average thickness (CAT) were analyzed using SD-OCT. Statistical analysis was done using independent t test, Pearson correlation and univariate regression analysis. CST and CAT were compared between controls and No DR groups, No DR and NPDR groups, No DR and PDR groups and NPDR and PDR groups. Correlation of CST and CAT was also analyzed.
Results
No significant difference was observed on comparing CAT and CST between No DR group and controls (t=1.95; p=0.34, t= 0.5; p=0.85respectively). A statistically significant difference was observed in CAT and CST on comparing No DR with NPDR (t=4.17, p<0.001; t=2.85, p=0.01respectively) and No DR with PDR (t=7.45, t=6.17 respectively; p<0.001). Statistically significant difference in CAT and CST was also observed between NPDR and PDR groups (t= 2.37; p=0.03, t=2.98; p<0.001 respectively). Pearson correlation revealed a positive correlation between CAT and CST (r=0.58; p<0.001). Univariate regression analysis revealed that both CST and CAT affect each other (p<0.001).
Conclusion
SD-OCT based macular central subfield thickness and cube average thickness provide reliable objective standard estimates for targetedscreening of diabetic macular edema for progression of disease.
Keywords: Diabetic retinopathy; Spectral domain optical coherence tomography; Central subfield thickness, Cube average thickness, Screening, Diabetic macular edema
Introduction
Diabetic retinopathy (DR), is the leading cause of visualimpairment in the working age population. Total number of people with diabetes is expected to rise to an estimated 300 million by the year 2025, with the most significant increases in developing countries[1]. Approximately 25% of people with diabetes have some form of diabetic retinopathy (DR). Diabetic macular edema, a common cause of central visual loss in patients with diabetic retinopathy, usually results from the breakdown of the blood-retinal barrier, which leads to abnormal fluid accumulation in the retinal layers and increasedretinal thickness. Diabetic macular edema increases with the durationof diabetes and its prevalence is 5% within the first five years afterdiagnosis and 15% at 15 years [2].
Slit lamp biomicroscopic examination of the macula provides only a subjective evaluation of retinal thickness and is not a reliable quantitative indicator of fluid accumulation. Spectral domain optical coherence tomography (SD-OCT) provides a highly reproducible and reliable quantitative measurement of macular thickness [3]. SD-OCT based macular thickness analysis of diabetic individuals at the time of screening would give a reliable baseline evaluation for planning the management and follow up. Central subfield thickness (CST) is defined as thickness of the central circle of diameter 1mm in the circular early treatment diabetic retinopathy study (ETDRS) grid map. Figure 1 Cube average thickness (CAT) is defined as an overall average thickness for the internal limiting membrane-retinal pigment epithelium tissue layer over the entire 6 x 6 mm square scanned area.
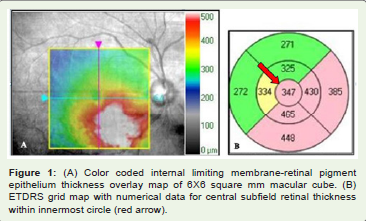
Figure 1: (A) Color coded internal limiting membrane-retinal pigment epithelium thickness overlay map of 6X6 square mm macular cube. (B) ETDRS grid map with numerical data for central subfield retinal thickness within innermost circle (red arrow).
The ETDRS definition of Clinically Significant Macular Edema(CSME) includes: central and non-central types. Central type accounts for retinal thickening within 500 μm of the center of the macula or, hard exudates within 500 μm from the center of the macula with thickening of the adjacent retina. The noncentral type of CSME is defined as a zone of retinal thickening, 1 disc area or larger, any portion of which is located within 1 disc diameter from the center of the macula [4]. On SD-OCT, CST incorporates the central 1mm area as recognized on the ETDRS map, whereas cube average thickness CAT would also include non-central type of CSME. In the present study, we evaluate screening of macular edema by SD-OCT for progression of retinopathy.
Material and Methods
Our study had institutional review board clearance and wasperformed in accordance to the tenets of the Helsinki declaration. In this tertiary care center based prospective cross sectional study, consecutive cases of type 2 diabetes mellitus were divided into three groups: no diabetic retinopathy (No DR; n=59); non-proliferative diabetic retinopathy (NPDR; n=59) and proliferative diabetic retinopathy (PDR; n=59) on the basis of ETDRS classification [5]. Fifty nine healthy age and gender matched controls were also included. Informed consent was obtained from each subject before enrollment into study. The right eye of controls and No DR group and the worse of the two eyes in NPDR and PDR groups were included for statistical analysis. Cases with ocular or systemic disease affecting retinal vascular pathology, previous ophthalmic surgical or laser interventions; and with signal strength 5 or below on SD-OCT were excluded. The best corrected visual acuity was documented on logMAR scale. Information regarding age, gender, disease duration were documented. Slit lamp biomicroscopic examination and fluorescein angiography were performed. Five milliliters of blood sample was drawn and analyzed for glycosylated haemoglobin usingstandard protocol.
All the study subjects underwent macular thickness analysisusing macular cube (512x128 scans) feature of SD-OCT [Cirrus HighDefinition OCT (Carl Zeiss Meditec Inc., CA, U.S.A)]. CST (μm) andCAT (μm) were documented.
Data has been summarized and presented as Mean ± SE. Difference in CST and CAT between controls and No DR groups, No DR and NPDR, No DR and PDR, and NPDR and PDR were assessed by independent t test. Correlation of CST and CAT was analyzed using Pearson correlation and univariate regression analysis. p value less than 0.05 was considered statistically significant. All analyses were performed using STATISTICA 6.0 software package (StatSoft, 2001).
Results
The mean age in years was 50.25 ± 7.5 in controls, 53.35 ± 6.73 in No DR group, 57.65 ± 9.32 in NPDR and 61.55 ± 8.32 in PDR group. The gender distribution among study groups was found to be 31 males and 28 females in control group, 36 males and 23 females in No DR group, 26 males and 33 females in NPDR and 34 males and 25 females in PDR group. Chi square revealed similar gender distribution among the groups (χ2=3.87; p=0.28). LogMAR visual acuity, glycosylated hemoglobin, CAT and CST among the study groups have been summarized in Table 1]. CSME was observed in 46 cases with NPDR (77.9%) and in all 59 cases of PDR.
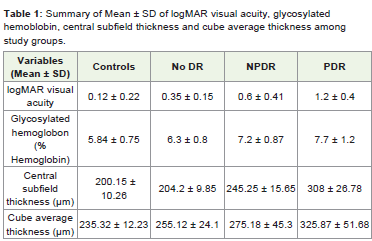
Table 1: Summary of Mean ± SD of logMAR visual acuity, glycosylated hemoblobin, central subfield thickness and cube average thickness among study groups.
No significant difference was observed on comparing CAT and CST between No DR group and controls (t=1.95; p=0.34, t=0.5; p=0.85 respectively). A statistically significant difference was observed in CAT and CST on comparing No DR with NPDR (t= 4.17; p<0.01, t= 2.85; p=0.01 respectively), No DR with PDR (t=7.45, t= 6.17 respectively, p<0.001) and NPDR with PDR (t=2.37; p=0.03, t=2.98; p<0.001 respectively). Pearson correlation revealed a positive correlation between CAT and CST (r=0.58; p<0.001). Log-antilog values were taken to adjust for skewing of data. Taking CST as dependent variable, univariate regression analysis revealed 32 percent variability in increase in CST with increase in CAT(r2=0.32; p<0.001). Similarly, taking CAT as dependent variable, 28% variability in increase in CAT with increase in CST was observed(r2=0.28; p<0.001)[Figure 2].
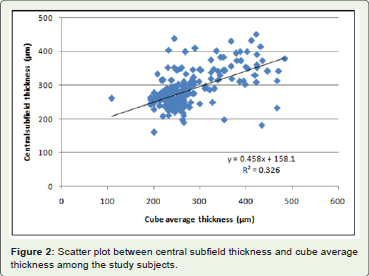
Figure 2: Scatter plot between central subfield thickness and cube average thickness among the study subjects.
Discussion
In the present study, a significant increase was observed in CST and CAT between the study groups. No significant difference wasobserved in CST and CAT in No DR on comparison to controls.
Studies have documented OCT as a sensitive tool for detectionof early retinal thickening [6]. Slit lamp examination correlates with findings on OCT except in few cases where OCT is instrumental in detecting thickening in absence of hard exudates in the central macula. Further, OCT is also useful in cases with diffuse rather than focal macular thickening with minimal variation in retinal surface contour [7]. The ability of OCT in detection of the small variation in macular thickness among normal eyes as well as variation between right and left eye is suggestive of its high precision and sensitivity [8].
A sensitivity value of 0.81 (95% CI 0.74 to 0.86) and a specificity of 0.85 (95% CI 0.75 to 0.91) was observed in a meta-analysisstudy which evaluated the presence of CSME with a central retinalthickness above a median cut off range of 250 μm (230 to 300 μm)[9]. The probability of subclinical edema rises with progression to non proliferative and proliferative diabetic retinopathy. Earlier studies have observed that besides individual baseline measurement, OCT is useful in detecting subclinical retinal thickening in advanced retinopathy without CSME. Such cases of subclinical macular edema should be followed more closely as they are at increased risk ofprogression to CSME [10].
In our study, we observed a significant difference in CST and CAT in No DR, NPDR and PDR study groups. An increase in CST andCAT on SD-OCT was observed with increased severity of retinopathy.CST and CAT serve as surrogate markers for prognosticating the disease severity. Our limited clinical data can be interpolated onto a population of diabetes mellitus with diabetic retinopathy. Targeted screening of diabetic macular edema in such a population, serves as a significant indicator for progression of disease process within the grade of retinopathy, which may not be clinically evident.
We also observed a positive correlation between CST and CAT. Both CST and CAT were observed to affect each other. Variability of increase in CST due to CAT was observed to be more predictablewhich substantiates the ability of OCT to detect increase in macularthickness in cases with diffuse extrafoveal retinal thickening.
With the wider availability of the patient friendly imaging tool, SD-OCT based central subfield thickness and cube averagethickness provide reliable objective standard estimates for targetedscreening of diabetic macular edema for progression of retinopathy.Obtaining a precise baseline evaluation will be useful for detection ofsubtle variations in retinal thickening on follow up for progression of disease. With advent of anti-vascular endothelial growth factor pharmacotherapy, the role of OCT for monitoring treatment in diabetic retinopathy has gained popularity. Screening with OCT will hence provide cost effective timely intervention and better prognosis. Several studies have correlated OCT based retinal thickness with visual acuity in diabetic macular edema [11-13]. Screening with OCT would provide effective tool for rationalizing decrease in visual acuity on follow up with no change in clinically evident diabetic retinopathy. With the development of Telemedicine, SD-OCT based targetedscreening of macular edema would serve as an appropriate tool formonitoring the progression of diabetic retinopathy [14].
References
- King H, Aubert RE, Herman WH (1998) Global burden of diabetes, 1995-2025: prevalence, numerical estimates, and projections. Diabetes care 21: 1414-1431.
- Aiello LP, Gardner TW, King GL, Blankenship G, Cavallerano JD, et al. (1998) Diabetic retinopathy. Diabetes Care 21: 143-156.
- Goebel W, Kretzchmar-Gross T (2002) Retinal thickness in diabetic retinopathy: a study using optical coherence tomography (OCT). Retina 22: 759-767.
- Early Treatment Diabetic Retinopathy Study Research Group (1985) Photocoagulation treatment for Diabetic Macular Edema. ETDRS Report Number 1. Arch Ophthalmol 103: 1796-1806.
- ETDRS Research Group (1991) Grading Diabetic Retinopathy from Stereoscopic Color Fundus photograph: ETDRS report number 10. Ophthalmology 98: 786-706..
- Massin P, Erginay A, Haouchine B, Mehidi AB, Paques M, et al. (2001) Retinal thickness in healthy and diabetic subjects measured using optical coherence tomography mapping software. Eur J Ophthalmol 12: 102-108.
- Hee MR, Puliafito CA, Duker JS, Reichel E, Coker JG, et al. (1998) Topography of diabetic macular edema with optical coherence tomography. Ophthalmology 105: 360-370.
- Diabetic Retinopathy Clinical Research Network. Krzystolik MG, Strauber SF, Aiello LP, Beck RW, Berger BB (2007) Reproducibility of macular thickness and volume using Zeiss optical coherence tomography in patients with diabetic macular edema. Ophthalmology 114: 1520-1525.
- Virgili G, Menchini F, Murro V, Peluso E, Rosa F, et al. (2011) Optical coherence tomography (OCT) for detection of macular oedema in patients with diabetic retinopathy. Cochrane Database Syst Rev.
- Browning DJ, Fraser CM, Clark S (2008) The relationship of macular thickness to clinically graded diabetic retinopathy severity in eyes without clinically detected diabetic macular edema. Ophthalmology 115: 533-539.
- Diabetic Retinopathy Clinical Research Network, Browning DJ, Glassman AR, Aiello LP, Beck RW, Brown DM (2007) Relationship between optical coherence tomography-measured central retinal thickness and visual acuity in diabetic macular edema. Ophthalmology 114: 525-536.
- Pelosini L, Hull C, Boyce JF, McHugh D, Stanford MR, et al. (2011) Optical coherence tomography may be used to predict visual acuity in patients with macular edema. Invest Ophthalmol Vis Sci 52: 2741-2748.
- Alkuraya H, Kangave D, El-Asrar AMA (2005) The correlation between optical coherence tomographic features and severity of retinopathy, macular thickness and visual acuity in diabetic macular edema. Int Ophthalmol 26: 93-99.
- Olson J, Sharp P, Goatman K, Prescott G, Scotland G, et al. (2013) Improving the economic value of photographic screening for optical coherence tomography-detectable macular oedema: a prospective, multicentre, UK study. Health Technol Assess 17: 1-142.