Research Article
Dietary Patterns and its Association with Premenstrual Tension Syndrome in Adult Women in Mumbai City: An Exploratory Study
Goyal A1*, Thorat A2, Udipi SA1 and Vaidya RA3
1Division of Integrative Nutrition & Ayurceuticals, Kasturba Health Society’s Medical Research Centre, India
2Department of Food, Nutrition & Dietetics, SNDT Women’s University, India
3Division of Endocrine & Metabolic Disorders, Kasturba Health Society’s Medical Research Centre, India
Article Information: Submission: 01/10/2021; Accepted: 03/11/2021; Published: 06/11/2021
Copyright: © 2021 Goyal A, et al. This is an open access article distributed under the Creative Commons Attribution License, which
permits unrestricted use, distribution, and reproduction in any medium, provided the original work is properly cited.
Abstract
Background: Premenstrual syndrome often disturbs daily activities and reduces productivity in women of reproductive age. The exact etiological cause
of PMS is unknown and theories associating nutrition with PMS exist. Studies focusing on dietary patterns and PMS are few. There is meagre evidence on this
topic in the Indian scenario, therefore, the present study was undertaken to explore the association of PMS with dietary patterns.
Aim: To assess the presence of PMS in young women, 19-40 years of age, in Mumbai city; and its association with dietary patterns, BMI, and sleep.
Methods: One hundred women with regular menses were recruited, but only 54 women completed the study. PSST-A was used to confirm PMS, the
dietary pattern was determined with a semi- quantitative FFQ and sleeping patterns were assessed using a 14-day sleep diary. Out of 54 women, 31 completed
the sleep component of the study.
Results: Thirty-seven women had no/mild PMS (Group 1), and 17 women had moderate-severe PMS (Group 2). No participant had PMDD. The mean
total PMS score of Group 2 women was significantly higher than that of Group 1 women. More number of Group 2 women tended to be overweight/obese.
Group 1 reported fewer symptoms and less severe experiences than Group 2. No significant difference was found between dietary and sleep patterns of
women with and without PMS.
Conclusion: The results of this study suggest that PMS may be associated with weight status. The role of obesity, diet and sleep patterns in PMS needs
to be further evaluated.
Keywords
Premenstrual syndrome; PMDD; Diet; Sleep; BMI
Abbreviations
PMS: Premenstrual Syndrome; PMDD: Premenstrual Dysphoric
Disorder; DRSP: Daily Record of Severity of Problems; BMI:
Body Mass Index; WHO: World Health Organization; PSST-A:
Premenstrual Symptoms Screening Tool for adolescents; FFQ: Food
Frequency Questionnaire; SD: Standard Deviation; SOL: Sleep Onset
Latency; TNFα: Tumor Necrosis Factor-α; GMSCF: Granulocyte Macrophage Colony Stimulating Factor; IFN-γ: Interferon-γ; hs-
CRP: High-Sensitivity C-Reactive Protein; GI: Glycemic Index;
PUFA: Polyunsaturated Fatty Acids; SFA: Saturated Fatty Acids;
TFA: Trans Fatty Acids
Introduction
Since it was first identified in the 1930s, premenstrual syndrome
(PMS) has presented clinicians and researchers with challenges in terms of its aetiology as well as its treatment. PMS is a cyclic repetition
of more than 100 psychological and physical symptoms observed in
women in the late luteal phase of the menstrual cycle caused by a
complex interplay between hormones, nutrients, neurotransmitters,
and psychosocial factors [1]. Common complaints include anger,
irritability, increased emotional sensitivity, bloating, insomnia, aches
and pains [2]. Approximately 75% of women of reproductive age are
said to suffer from at least one of these symptoms. A more severe
form of the disorder, known as Premenstrual Dysphoric Disorder
(PMDD) has also been described [3]. The International Classification
of Diseases-11 (2018) [4] has recognised PMDD as a largely
gynaecological problem ‘severe enough to cause significant distress
or impairment personal, family, social, educational, occupational
or other important areas of functioning and do not represent the
exacerbation of a mental disorder.’
The aetiological factors of PMS are not understood completely
and continue to remain under investigation. Various pathways have
been proposed to explain the aetiology of PMS and various nutrients
have been implicated in the same. Some isolated studies have been
conducted to examine the effect of carbohydrates, fatty acids and
proteins on PMS symptoms [5-7]. This is because of their complex
involvement in neuronal pathways, neurotransmitter function and
the maintenance of the hormone milieu. Supplementation studies
have been conducted with minerals such as calcium, magnesium, and
some vitamins like pyridoxine, thiamine [8-11]. The results of these
studies highlight the potentially important role of nutrition in PMS.
However, there is meagre evidence on the role of diet and dietary
patterns in PMS, particularly in the Indian scenario. Therefore,
the present study was undertaken with the aim of assessing dietary
patterns to determine whether there is any association with
premenstrual tension syndrome in adult women aged 19 – 40 years
in Mumbai city.
Materials and Methods
Ethics Approval:
The study was approved by the Intersystem Biomedical Ethics
Committee (ISBEC) (Approval No. ISBEC/ NR-20/ KM-VM/ 2018)
(October 18, 2018).Sample Selection:
For this exploratory study, subjects were recruited by snowball
sampling after obtaining written informed consent using the
following inclusion and exclusion criteria.Inclusion criteria: Women between 19-40 years of age, from
upper and middle-upper socio-economic status, in seemingly good
health and having a regular menstrual cycle.
Exclusion criteria: Pregnant and/or lactating women, women
with chronic health problems such as diabetes, hypertension, acute
respiratory distress syndrome, chronic obstructive pulmonary
disorder, cancer and asthma, women from the lower socio-economic
group, women having irregular menstrual cycle and women who
had been on hormone therapy of any kind for two-three months
preceding the study.
The study was conducted between October 2018 and February
2019. One hundred young women were recruited. Of these, 20
participants returned incomplete forms, 20 did not respond and 6
participants lost the recording formats provided to them. Therefore,
data for the 54 participants who completed the study were analysed.
Data Collection:
Information was collected regarding (a) General health,
menstrual history and anthropometric measurements i.e., weight and
height, (b) Symptoms related to PMS experienced by the participants,
(c)Daily Record of Severity of Problems (DRSP), (d) Food Frequency
Questionnaire and (e) Sleep Diary [12].a. General information about family, marital status, sexual
activity and menstrual history was obtained from the participants.
Self-reported heights and weights were used to calculate body mass
index (BMI). The subjects were classified into BMI categories as per
WHO criteria for Asians [13].
b. The Premenstrual Symptoms Screening Tool for adolescents
(PSST-A), developed by Steiner et al., (2011) [14], was used for the
diagnosis of PMS. This consists of a 4-point scale to evaluate the
presence/severity of 14 symptoms commonly observed in PMS,
where 0 represents the absence of symptoms and 3 represents the
presence of debilitating symptoms. As part of the tool, the disturbance
caused by the symptoms on daily activities was also recorded. The
participants were then categorized as no/mild PMS - designated as
group 1 (n = 37), moderate- severe PMS - designated as group 2 (n
= 17). No participant in this study qualified the criteria for PMDD.
c. A prospective two-month diary, the Daily Record of Severity
of Problems (DRSP) was given to the participants as a diagnostic
tool. The participants were explained that they were required to
record their daily symptoms as well as the severity of symptoms
experienced by them from the list of symptoms commonly associated
with PMS and was provided to them in the recording format. They
were requested to do so for duration of 2 months (starting from
the 1st day of menstruation of the 1st menstrual cycle to the start
of the 3rd menstrual cycle) along with measuring and noting down
body temperature every day. The women were asked to separately
mark the days on which they menstruated to determine the premenstrual
phase. Only 18 participants satisfactorily provided data
for daily symptoms and daily temperatures were provided by only 6
participants. Hence, due to an insufficient number of responses, this
data was not analysed.
d. Dietary pattern was assessed using a Food Frequency
Questionnaire (FFQ) consisting of 223 foods that are commonly
available and consumed in Mumbai city. The food items were
grouped ingredient-wise: cereals and cereal products; pulses and
pulse products; milk and dairy products (i.e. milk, curd, cheese,
paneer, khoa and cream); milk-based beverages; other beverages;
sweets and bakery products; snacks /namkeens that are shelf-stable,
generally energy-dense/ high fat and often contain high amounts of
sodium, both Indian and other snack products like chips or wafers;
freshly prepared snacks such as kachori, samosa, and vadas which are
also high fat/ high sodium and energy-dense; nuts and oilseeds; food
adjuncts like ketchup, pickles and papads; chicken/ meat and their products; seafood i.e. shellfish, fish, crabs and prawns; fruits; dark
green leafy vegetables; yellow, red and orange coloured vegetables;
other vegetables; and roots and tubers. In addition, the foods were
classified as high fat, high salt, low fat, whole grain products i.e.,
whole cereals and millets foods/ products, milled and polished rice
foods/ products, and refined flour products. Information about the
consumption of the foods in terms of frequency i.e., number of days
per week and number of portions consumed per time were recorded.
From this, the weekly frequency of consumption and the number of
portions consumed per week were calculated.
e. Participants were asked to maintain a sleep diary from the
American Academy of Sleep Medicine for a fortnight (any 2 weeks
during the two months) [12]. The information recorded included
self-reported hours of sleep, time taken to fall asleep, hours spent
exercising and the consumption of tea, coffee or cola to estimate
caffeine consumption. Thirty-one out of the 54 participants completed
the sleep diary and the data for these participants were analyzed.
Data Analysis:
Data was coded in MS Excel and SPSS version 25 was used for
statistical analysis. Independent t-test, paired t-test, and chi-square
test were applied.Results
Profile of participants:
The demographic profiles of participants from both groups
were similar. Participants from both groups were similar in age,
age at menarche, duration of last period and the interval between
two periods (days) (Table 1). Among the 54 women, only two were
sexually active and both of them belonged to group 2.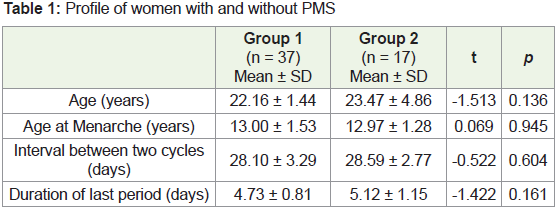
Symptoms of Pre-Menstrual Syndrome:
The mean total PMS score for severity of 14 symptoms was
significantly higher in group 2 compared to group 1 (p = 0.000). A
significantly higher percentage of women in group 2 experienced
tension/anxiety, tearfulness, decreased interest in home and social
activities, fatigue, difficulty in concentrating, insomnia and feeling
overwhelmed compared to group 1 (Table 2) PMS is characterized
by the presence of physical and/or psychological symptoms in the
week preceding menstruation that causes some disturbance in the
day-to-day activities of women. In the present study, all participants
from group 2 complained of moderate disturbance in daily activities
due to the presence of symptoms, in contrast to group 1, where only
70.3% of participants reported being disturbed by the symptoms (p =
0.000). A significantly higher percentage of group 2 women reported
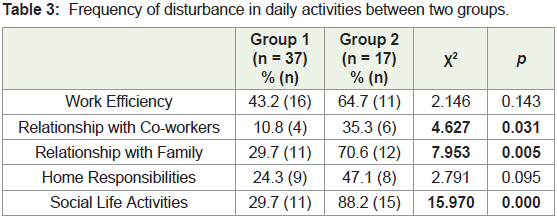
a disturbance in relationship with co-workers, family and social life
activities due to the symptoms experienced (Table 3).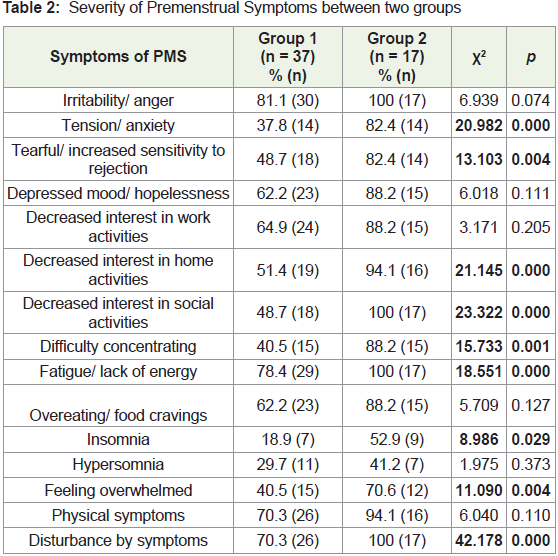
Anthropometry:
Mean body weight for group 2 women (59.31 ± 13.18 kg) tended
to be higher than group 1 women (57.35 ± 9.48 kg) although there
was no statistically significant difference between the two groups (t=
-0.622, p = 0.537). Although mean BMI was higher for group 2, there
was no statistically significant difference between the groups (Group 1 – 22.58 ± 3.07 kg/m2, Group 2 – 22.72 ± 4.34 kg/m2) (t =-0.144, p
= 0.886). In group 2, 11.8% women were underweight compared to
only 2.7% women from group 1, 41.2% in group 2 had normal BMI,
which was much lower than the 62.2% of group 1 women who had
normal BMI. In group 2, 23.5% women were overweight compared
to 18.9% from group 1, 17.6% of group 2 were in the obese I category
and 5.9% women were in the obese II category. In contrast, among
the group 1 women 13.5% were categorized as obese I and 2.7% were
in the obese II category (WHO, 2004). However, the results of the
chi-square analysis indicated that the differences between the two
groups were not significant (χ2 = 3.219, p = 0.522). Self-reported premenstrual
weight gain appeared to be significantly higher in group
2 women (0.52 ± 0.79 kg) compared to group 1 (0.08 ± 0.40 kg) (t =
2.702, p = 0.016).Dietary Patterns:
More women from group 2 skipped breakfast thrice a week
(17.6%) and daily (11.8%) compared to group 1 (8.1%, respectively).
A higher percentage of group 2 women (11.8%) consumed breakfast
items purchased from outside every day in contrast to group 1 (5.4%).
Significantly more women from group 2 were vegan (5.9%), lactoovo-
vegetarian (23.5%) and ovo-vegetarian (11.8%) compared to
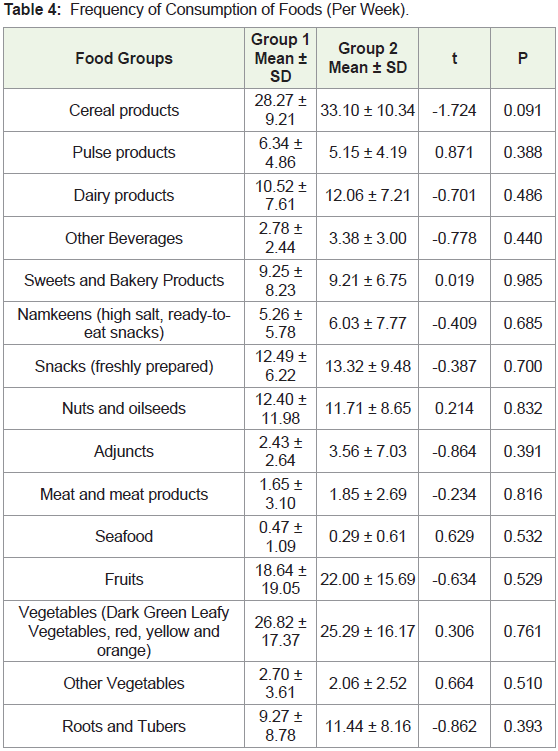
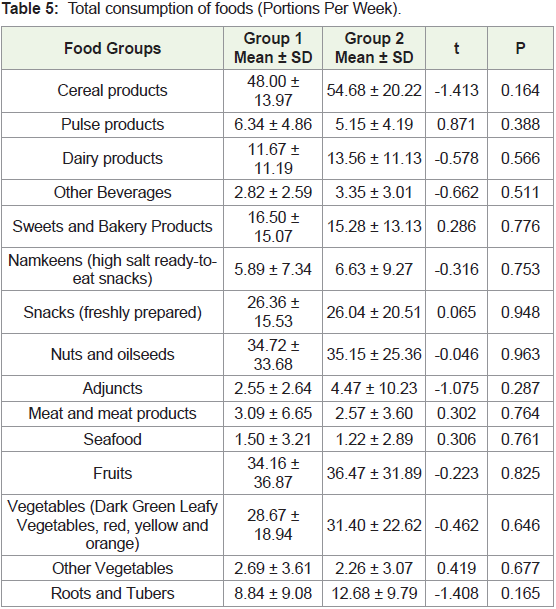
group 1 (5.4%, 2.7% and 0% respectively) (χ2 = 11.465, p = 0.022)The frequency of consumption per week for the 16 food groups
was compared between the two groups. The frequency of consumption
in group 2 tended to be more than group 1 for cereal products, dairy
products, beverages, namkeens, adjuncts, snacks, fruits, and root and
tubers (Table 4). Similarly, women in group 2 consumed a higher
number of portions of cereal products, dairy products, beverages,
namkeens, adjuncts, fruits, vegetables, and roots and tubers than
women in group 1 per week (Table 5).
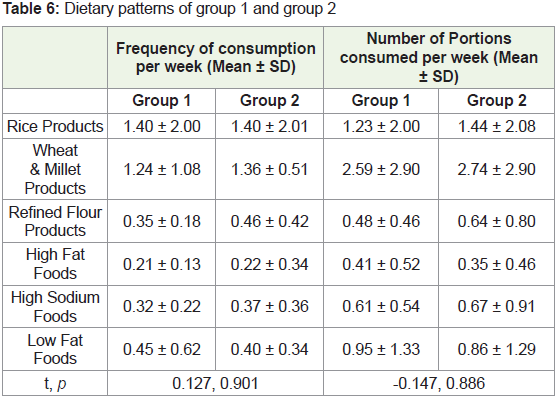
However, the frequency of consumption of whole wheat and
millet products, refined flour products, high fat and high sodiumcontaining
foods appeared to be higher in group 2 than in group 1.
In contrast, group 1 consumed low-fat foods more frequently than
group 2 participants. Group 2 also consumed a greater number of
portions of rice and rice products, whole wheat and millet products,
refined flour products and high sodium foods than group 1 per week
(Table 6).
Sleep Patterns:
Sleep patterns of the 31 participants who completed the sleep
diary (Group 1 = 23, Group 2 = 8), indicated that 87% (n = 20) of the
participants in group 1 generally slept after midnight compared to
a lower percentage of women in group 2 (50%, n = 4). Only 13% (n
= 3) of the women from group 1 slept between 11pm and midnight
compared to 50% (n = 4) of the women from Group 2 (χ2 = 4.637, p
= 0.031).Sleep onset latency (SOL) was seen in a slightly but not
significantly higher percentage of women in group 2 (87.5%, n = 7)
as compared to group 1 (69.6%, n = 16). Group 1 had a mean SOL of
47.4 ± 38.4 minutes that was lower as compared to the SOL of 61.2 ±
31.8 minutes for group 2. Women from group 2 reported SOL for 12 out of 14 days when they maintained the sleep diary whereas in group
1 SOL was reported for only 9 out 14 days.
Further, as part of the sleep diary, the participants were asked
about their consumption of caffeine beverages (cola, coffee, tea). The
average frequency of caffeine consumption (number of times per
day) during the two weeks when they maintained records for Group
1 women (n = 23) was 1.00 ± 0.54 and that of Group 2 women (n =
8) was slightly higher (1.19 ± 0.69). The two groups did not differ
significantly in their frequency of caffeine consumption (t = -0.794,
p = 0.434).
Discussion
“Premenstrual Syndrome is the occurrence of cyclical somatic,
psychological and emotional symptoms that occur in the luteal
(premenstrual) phase of the menstrual cycle and resolve by the
time menstruation ceases.” [15]. Out of the 54 participants in the
age group of 20-36 years who participated in our study, 47 women
(87%) had premenstrual syndrome with a majority of them reporting
experiencing at least one symptom associated with PMS. A metaanalysis
of 17 prevalence studies conducted in different countries
[16] found the overall prevalence of PMS to be 47.8% in the years
1996-2011. The highest prevalence was seen in Iran (98.2%),
followed by Nigeria (85%). India ranked fifth highest in prevalence
with 67% while the lowest prevalence was found in France (10%).
Nationwide/ State wise/ regional data for the prevalence of PMS in
India is not available, although some investigators have reported their
observations from different parts of the country [17], found a total
prevalence of 53% in their study conducted at Peshawar, Pakistan
among college girls and Rezaeian (2015) [18] found 63% prevalence
of PMS in a group of 18-26 years old women at Tehran, Iran. There
are few reports in the literature from India, but an observational study
from Andhra Pradesh found 55% of their participants to be suffering
from PMS [19]. In the present study, women who experienced PMS
symptoms appeared to gain more weight. This is in line with reports
in the literature that weight gain/bloating is a common symptom
of PMS [20]. The relationship between obesity and PMS could be
attributed to the fluctuation of female hormones (low oestrogen) seen
in women with a high BMI. Reduced oestrogen levels may be in turn
be associated with decreased serotonin function which is one of the
established etiological pathways for PMS [21].
Obesity has repeatedly been shown as a risk factor for PMS.
A cross-sectional study of 847 women (18-44 years) found PMS
to be higher in women who were overweight i.e., high BMI than
in underweight women i.e., low BMI [22]. The same study found
obese women thrice as likely to have PMS compared to underweight
women. A similar observation relating adiposity to PMS was seen in a
nested study of the Nurses’ Health Study II, where women free from
PMS at baseline were observed over 10 years. The risk of PMS was
significantly higher in women with BMI ≥ 27.5 kg/m2 with each 1
kg/m2 increase in BMI being associated with a 3% increase in PMS
risk [21]. In India, Akbari et al., (2017) [23], studied 270 girls in the
Chitradurga district of Karnataka. Among the girls with PMS (n =
84), 67.8% had normal BMI, 18% were pre-obese and 10.8% were
underweight. Ashfaq and Jabeen (2017) [24] found that of the 118
girls with PMS, 92.9% were overweight, 89.3% were obese and 82.8% were underweight suggesting that both extremes of weight status seem
to affect the severity and existence of PMS symptoms. Similar trends
were observed in the present study, where more women with a high
BMI tended to suffer from moderate-severe PMS compared to women
with normal BMI. However, the anthropometric measurements here
were self-reported and a more careful examination is warranted
to elucidate the extent to which overweight/obesity increases the
risk of PMS in Indian women. Studies focusing on diet patterns
and anthropometric measurements such as body mass, adiposity
concerning PMS in the published literature are limited. Larger and
well-designed studies with these factors in mind would be helpful.
Larger and more detailed studies with these factors in mind are
pertinent.
PMS commonly consists of several affective symptoms such as
depression and anxiety for which inflammation is often implicated
as one of the etiological factors. Inflammation is also implicated in
several other symptoms commonly seen in PMS such as lethargy,
cognitive impairment, decreased social interaction [25]. Bertone-
Johnson et al., (2014) [26] compared f inflammatory biomarkers
in PMS and control participants, i.e., IL-1β (interleukins), IL-2,
IL-4, IL-5, IL-6, IL-7, IL-8, Il-10, IL-12, IL-13, Tumor necrosis
factor-α (TNFα), granulocyte macrophage colony stimulating factor
(GMSCF) and Interferon-γ (IFN-γ). Total symptom score was
positively associated with IL-2, IL-4, IL-10, and IL-12 (p < 0.05) with
the strongest relation with IL-4, IL-10, IL-12 and IFN-γ. Depression
and other psychological disorders can be attributed to an increase
in cytokines via cytokine effect on neurogenesis, neurotransmitter
functions, and stress response pathways [26]. Gold, Wells & Rasor,
(2016) [27], in their cross-sectional study, found most symptoms of
PMS in obese women. hs-CRP (C-reactive protein) levels > 3mg/L
were associated with abdominal cramps, cravings/weight gain/
bloating and mood symptoms.
Inflammation also has a well-documented close relationship
with diet and multiple indicators of inflammation like IL-2, -6, -4,
and hs-CRP have been studied. High glycemic index (GI) foods
have been shown to increase hs-CRP levels. In a Dutch study,
every 10-unit increase in GI leads to a 29% increase in hs-CRP [28]
whereas, diets rich in dietary fibre have shown an inverse relation
with hs- CRP [29]. Clarke et al., (2008) [30] have shown that high
serum saturated fatty acids (SFA) are positively correlated with hs-
CRP and fibrinogen and polyunsaturated fatty acids (PUFA) are
inversely correlated with hs-CRP [31] found every 1% decrease
in energy from SFA causes hs-CRP to decrease by 0.14 mg/L. The
Nurses’ Health Study found trans-fatty acids (TFA) to be associated
with IL-6 and hs-CRP in women with high BMI indicating systemic
inflammation [32]. These works and observations indicate the role of
diet in both creating and relieving an inflammatory environment in
the body. Obesity and/or obesity-induced inflammation could also
be associated with the severity of PMS symptoms. Although intakes
of fibre or fat and fatty acids could not be calculated in the present
study, we attempted to examine the intakes of such foods using an
FFQ. The present study saw Group 2 consuming a higher number
of portions of high salt and processed foods such as namkeens, and
adjuncts (papads, pickles) more frequently in terms of number times
per week compared to group 1. This can also be a contributing factor to systemic inflammation. Animal studies have shown that high salt
intake can lead to inflammation and exacerbated autoimmunity
apart from being an independent factor for obesity. [33] found a
positive association between high sodium intake, and adiposity and
inflammation. Subcutaneous abdomen adipose tissue and TNF-α
were significantly higher in adolescents with high dietary sodium
intake. A similar association may exist in women with PMS where
the severity of symptoms could be exacerbated due to high salt intake
and/or inflammation.
One other finding seen commonly in PMS is sleep disturbance.
Sleep is an integral part of health and sleep-related disturbances
can affect the functional ability and increase the risk of psychiatric
disorders [34], found that people with sleep insufficiency were more
likely than people with sufficient sleep to report fair/poor general
health, frequent physical and mental distress, frequent activity
limitations, and frequent symptoms of depression, pain and anxiety.
They were also more likely to have health-risk behaviours including
smoking, obesity, physical inactivity and heavy drinking (in men).
Sleep onset latency (SOL) is the duration of time between when
the lights are turned off until the time person falls asleep [35]. It is the
time taken to accomplish the transition from complete wakefulness to
sleep. Sleep debt may be accumulated by sleep-deprived individuals,
exhibited by an increased need to recover lost sleep which leads to
shorter sleep latency, and greater total sleep time [36].
The present study found women with moderate-severe PMS
experiencing SOL more than women with no/mild PMS. Group 2
women also showed more frequent consumption of caffeine compared
to group 1. The late hours of going to sleep and caffeine consumption
that are attributable to the occupational and personal life demands
among millennials can be associated with disturbed sleep and the
accumulation of sleep debt. Findings related to sleep disturbance in
PMS have been demonstrated by [37]. They found daytime sleepiness
to progressively decrease with a decrease in the severity of symptoms
(PMDD> moderate-severe PMS> no/mild PMS; p = 0.000). Caffeine
consumption may also be associated with sleep disturbances. It is an
adenosine receptor antagonist and can modulate physiological and
mental state via mechanisms related to sleep, arousal and cognitive
performance. It has been known to increase SOL by attenuating the
readiness to fall asleep (sleep propensity) [38]. However, further work
is required to study the association between PMS and sleep health.
Despite the absence of significant results, the trends for an
association between diet patterns, BMI and the PMS were observed
in the present study. While all these factors could affect the presence
and severity of PMS, one of the major limitations was the sample size.
A larger and more diverse sample would be helpful to conclusively
establish the trends seen here. The present study was an exploratory
study and was restricted to diet patterns. The relationship between
vitamin B6 and other nutrients with PMS was not explored. It may
be worthwhile to also include a study of nutrient intakes and their
association with PMS. The relationship between dietary factors and
PMS needs to be explored to gain a better understanding of the role
nutrition plays in premenstrual syndrome. We also did not include
participants with other endocrine disorders in this study which could
be a determinant in PMS and should be better understood. It might also be of consequence that the tedious nature of the diagnostic tool
proved to be discouraging for a large number of participants in the
present study and prevented the use of a more detailed diet recall. A
simpler and easier-to-use tool may be helpful in future studies aimed
at studying PMS. This study was also not conducted in a clinical
setting which would have allowed a case-control methodology of the
study.
Conclusion
In conclusion, the present study sheds some light on how diet
and lifestyle may affect the severity of symptoms seen in premenstrual
tension syndrome. The number of women suffering from PMS in the
present study confirms that it is a common problem amongst women
of reproductive age and affects their productivity, ability to participate
in work and household activities and day-to-day life.
Despite its limitations, the present study was able to find trends
between the two groups in terms of the relationship of PMS and
weight status, dietary patterns and sleep patterns. This is a testimony
to the fact that nutrition does have a role to play in the management
of premenstrual syndrome. Further studies are required to confirm
the findings of this study in a larger sample.
Acknowledgement
We extend our sincere gratitude to the women who spared their
valuable time to participate in this study.
References
Citation
Goyal A, Thorat A, Udipi SA, Vaidya RA. Dietary Patterns and its Association with Premenstrual Tension Syndrome in Adult Women in Mumbai City: An Exploratory Study. Indian J Nutri. 2021;8(3): 242.