Research Article
Otayf A*, Mohan R, AL Khairat M, Bakerain A, Sarkhi A and Jammali A
Jazan University, Applied Medical Sciences College, Kingdom of Saudi Arabia
*Corresponding author: Otayf A, Jazan University, Applied Medical Sciences College, Kingdom of Saudi Arabia, Email: oteef2009@hotmail.com
Article Information: Submission: 27/08/2020; Accepted: 15/09/2020; Published: 19/09/2020
Copyright: © 2020 Otayf A, et al. This is an open access article distributed under the Creative Commons Attribution License, which permits unrestricted use, distribution, and reproduction in any medium, provided the original work is properly cited.
Abstract
Objectives: Present study aimed to find the prevalence of eating disorders (EDs) among the undergraduate students, Jazan University, Kingdom of Saudi Arabia, and find the relationship between EDs and normal weight obesity (NWO) and its factors.
Methods: A cross-sectional study was conducted among undergraduate students at Jazan University from November 18, 2019, to May 30, 2020. The subjects were 158 students aged 18 and over, and Body Mass Index (BMI) between18.5 to 24.9 were recruited from two groups according to the degree programs: health and non-health related programs. Eating Attitudes Test 26 (EAT-26) questionnaire was distributed among the students to assess eating
attitudes. Weight, height, and % fat mass were measured, and BMI was calculated.
Results: The prevalence of EDs was significantly high in the non-health program (25%) compared to health program students (14%) P-value<0.05, females (25%) had high prevalence compared to male students (10%) P-value<0.05, married (35%) students had high prevalence compared to single students (13%) P-value<0.05. Female students in the non-health program had a significantly higher bulimia and food preoccupation score in EAT-26 subscale P-value<0.05 compared to the others that showed a higher in the dieting score in EAT-26 subscale. Regarding NWO, female students had a higher EAT-26 score than male students but statistically not significant.
Conclusion: Among undergraduate students, NWO students had a higher prevalence of EDs. The present study found a high prevalence of EDs in nonhealth programs married female undergraduate students at Jazan University. Nutrition education and counseling are essential to establishing and maintaining healthy body fat composition and eating behavior.
Keywords
Normal Weight Obesity (NWO); Eating Disorders (EDs)
Introduction
College students are at risk of developing eating disorders (EDs),
resulting from practicing abnormal eating behaviors, such as skipping
meals, taking diet pills, and restricting or eating the minimal amount
of food to lose weight. EDs are a group of psychiatric problems
characterized by changes in eating or absorption food, such as
anorexia and bulimia nervosa. Body image dissatisfaction, stress, and
marital status are some factors that increase the risk of EDs among
college students’. The prevalence of increasing body fat has been
noted among college students. According [1] college students are at
high risk of gaining fat mass due to the transition from high school
to college, which is a critical period for establishing abnormal eating
behaviors. In Saudi Arabia, the prevalence of overweight and obesity
has increased and become trended among the populations [2]. That
may lead to an increase in abnormal eating behavior, trying to lose
weight.
Typically, obesity has been identified by means of the body mass
index (BMI), a person with a BMI of ≥30.00 kg/m2 is indicated
obese (WHO) associated with obese people, such as diabetes, and
cardiovascular diseases [3-6]. However, BMI does not differentiate
between body fat mass and lean body mass on the body [7-9].
Individuals may have a high body fat mass percentage but having a healthy or normal BMI. This concept is known as normal weight
obesity (NWO). It describes a person who has a normal body weight
when defined by BMI (18.50 – 24.99 kg/m2) and has a high amount
of body fat (≥ 25 in males & ≥32 in females, respectively) [10].
People with NWO have increased risks of metabolic syndrome [11].
Abnormal eating behaviors to lose weight through unhealthy weight
control methods lead to an increase in the prevalence NWO among
the students [12] found an association between the prevalence
of NWO and diet behavior among students, high body fat mass
linked to diet behavior. However, the prevalence and relationship
between NWO, marital status and EDs among students at Jazan
University have not studied. Conduction of screening studies for the
prevalence and association between NWO, and EDs will contribute
to an early detection between these components, which may be
useful in decreasing the risk of prevalence of EDs and NWO among
students. Therefore, the objectives of the study were to investigate the
prevalence of EDs, and NWO among Jazan University students; and
to identify the relationship between NWO, associated factors, and
EDs among Jazan University students.
Methods
A cross-sectional study was undertaken from November 18, 2019
to May 30, 2020 at Jazan University. The study included 158 students
from both genders (60 females & 98 males) adult students who were
age 18 and over and Body Mass Index (BMI) between18.5 to 24.9
were recruited from the university with different programs. Students
younger than 18 years, pregnant, and BMI were <18.50 or ≥ 25 were
excluded from the study.
Students were asked to fill out a demographic questionnaire to
collect information about age, gender, study year or level, marital
status, and study major. Students were also asked to complete Eating
Attitudes Test 26 (EAT-26) questionnaires.
The EAT-26 scale measure is used to identify EDs, but this
questionnaire is not designed to make a diagnosis of EDs. The EAT-26
scale has three subscales: Dieting, Bulimia, and Food Preoccupation,
and Oral Control. Each question in this questionnaire contains six
options with a corresponding point value: always (3), usually (2),
often (1), sometimes (0), rarely (0), and never (0). Getting score
equal to or more than 20 is determined as having a characteristic of
EDs [1<3/a>]. EAT-26 scale is a validated questionnaire and was used in
several studies to assess EDs [14-16].
Anthropometric measurements were assessed by using a
calibrated scale for the measurement of weight to the nearest 0.1
kg, and height without shoes was measured using a wall-mounted
stadiometer to the nearest 0.5 cm. BMI was calculated as kg/m2.
Bioelectrical impedance analyzer (Omron HBF-306C Handheld) was
used to assess fat percentage.
This study was approved by the Scientific Research Ethics
Committee at Jazan University. Participants informed of the nature
and scope of the study then signed an informed consent form. The
participants were informed that participation in this study was
voluntary, that they may stop participating at any time, and that their
names would not be disclosed when the study findings were reported.
Data analysis was performed using Statistical Package for Social
Sciences (SPSS) 21.0 version for windows. The results for continuous
variables were expressed in descriptive statics mean, and standard
deviations and student-t test for two independent variables were
applied for testing the significant difference. Logistic regression (Odds
ratio) and 95% confidence interval of odds ratio were calculated for
finding the strength of relation, and the chi-square test was applied for
testing the association between categorical variables. The differences
were considered statistically significant at P value < 0.05.
Results
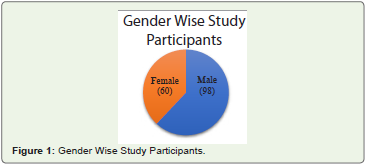
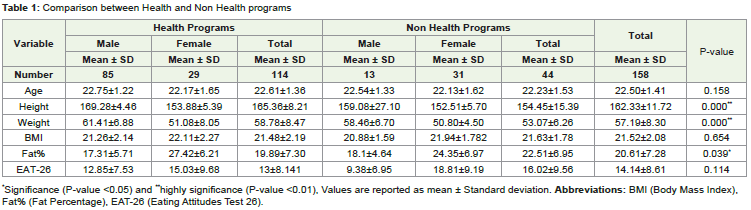
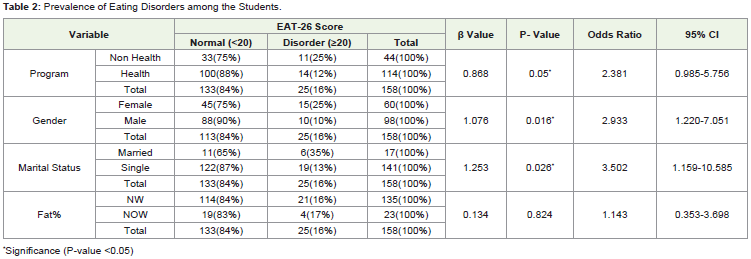
Among 158 participants, 98 were male students, and 60 were female students (FIgure 1). Comparison of mean and standard deviations for different variables between health and non health programs are reported in Table 1. Male students were found taller than the female students in both programs, health programs (169.28 ± 4.46 cm) compared to (153.88±5.39 cm) and non-health programs (159.08 ± 27.10 cm) compared to (152.51 ± 5.70 cm). The differences between health and non health program student heights showed a highly statistically significant (P-value <0.01) (Table 1). The same findings also were found in accordance with weight. Male students gained more weight than the female students in the both programs, health programs (61.41±6.88 Kg) compared to (51.08 ± 8.05 Kg) and non-health programs (58.46 ± 6.70 Kg) compared to (50.80 ± 4.50 Kg). The differences between health and non health program student weights showed a highly statistically significant (P-value <0.01). However, female students had higher fat mass% than male students in both programs, health programs (27.42 ± 6.21%) compared to (17.31 ± 5.71%) and non-health programs (24.35 ± 6.97 %) compared to (18.1 ± 4.64%). The differences between health and non health program student fat mass (%) showed statistically significant (P-value< 0.05).The prevalence of EDs among students is depicted in Table 2. In accordance with programs, 25% among non- health program students had EDs significantly more compared to 14% among health program students. Odds ratio 2.381, 95% confidence interval 0.985-5.756 and P-value<0.05. Therefore the probability for a non- health program student having the risk of EDs is 70%. In comparison between genders, female students had significantly higher prevalence of EDs 25% compared to 10% in male students. Odd ratio 2.933, 95% confidence interval 1.220-7.051 and P-value <0.05. Therefore, the probability for a female student having the risk of EDs is 75%. In case with marital status, married students had significantly more prevalence of EDs than unmarried students. Among 17 students 6 (35%) had EDs where as in 141 unmarried students only 19 (13%) had EDs Odds ratio 3.502, 95% confidence interval 1.156-10.585 and P-value<0.05. Therefore, the probability for married students having the risk of EDs is 78%. In comparison between obese and non-obese students according to fat%, obese had slightly higher prevalence of EDs, but statistically not significant (P-value >0.05).
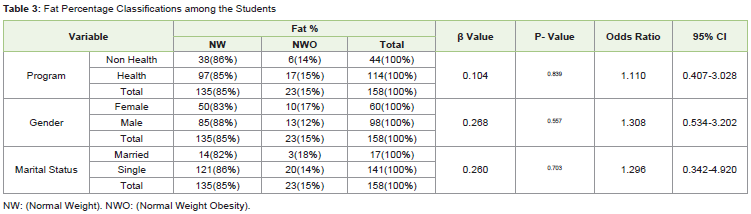
Fat percentage classifications among the students showed in
Table 3. The prevalence of NWO between health and non – health
programs were not show any statistical differences (15% and 14%
respectively). Although the prevalence of NWO according to the
fat% higher in female (17%) compare to male (12%) and married
students (18%) compare to single (14%), the results were not
identified any statistical differences between them (P-value>0.05).
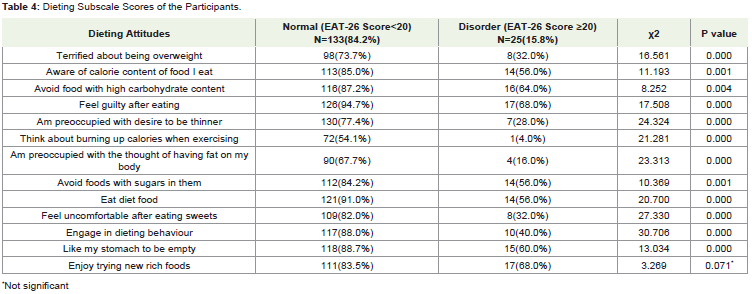
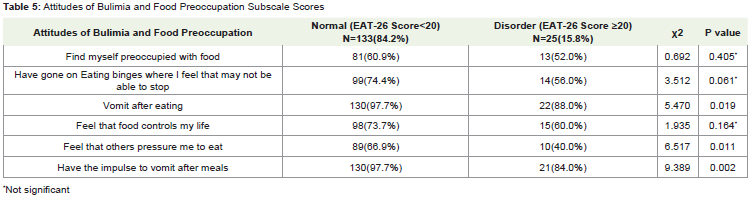
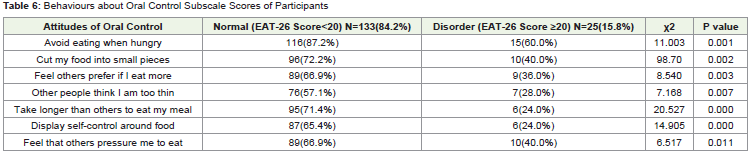
EAT-26 questions were divided into three subscales: Dieting, Bulimia
and Oral Control and are represented in (Table 4,Table 5,Table 6). Normal (EAT-26 Score<20) students had a significantly higher
proportion (84.2%) in all items of attitudes and behaviors compared
to (15.8%) were disorders (EAT-26 Score ≥20). P-values were <0.05
in most of the items except only for the items of “enjoy trying new
rich foods”, “Find myself preoccupied with food”, “Have gone on
Eating binges where I feel that may not be able to stop”, and “ Feel
that food controls my life” which did not differ significantly between
respondents. The highest dietary subscale item (88%) in the disorder
(EAT-26 Score ≥20) students was found to be “Vomit after eating”
followed by “Have the impulse to vomit after meals” was 84%, “Enjoy
trying new rich foods” were found 68% and “Preoccupied with desire
to bethinner”found28%.
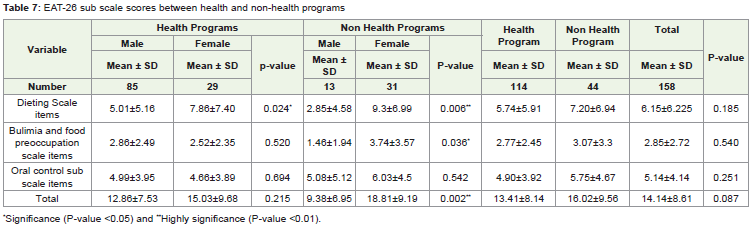
EAT-26 sub scale scores between health and non - health
programs are reported in Table 7. EAT-26 comprises 26 questions
with scores and it includes 3 subscales. Dieting scale items including
13 questions, Bulimia and food preoccupation scale contains 6
questions and oral control scale contains 7 questions. When these
questions were analyzed between health and non-health program
students few characteristic differences were identified. Female
students in the both programs had higher mean of “Dieting Scale
items” (7.86 ± 7.40 & 9.3 ± 6.99), in health program between male
and female was statistically significant (P-value< 0.05), and in nonhealth
programs was highly significant (P-value<0.01). In addition,
female in non-health programs reported significantly higher mean
of “Bulimia and food preoccupation scale items” (3.74 ± 3.57) and
(P-value =0.036). In the other subscales, although male students had
lower mean of EAT-26 sub scale scores than the female students
in both health and non-health programs except bulimia and food
preoccupation scale item in the health program, the findings were not
found to be statistically significant (P-value >0.05).
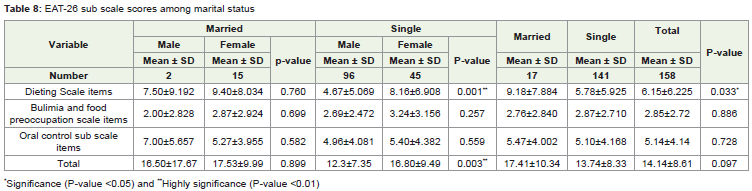
EAT-26 sub scale scores among marital status are presented
in Table 8. In this table EAT-26 items are compared with marital
status. In dieting scale items, married participants had higher mean
score 9.18 ± 7.884 than the unmarried participants 5.78±5.925 and
difference was found to be statistically significant (P-value<0.05).
Even in unmarried participants, females had mean score 8.16 ± 6.908
is higher than the males mean score 4.67 ± 5.069. The difference was
found statistically highly significance (P-value <0.01). In the table it
captured that females are having better mean scores than males. While
the other subscales, female students had slight high mean scores of
EAT-26 sub scales than the male students except oral control sub
scale items, but the result wasn’t found to be statistically significant
(P-value >0.05).
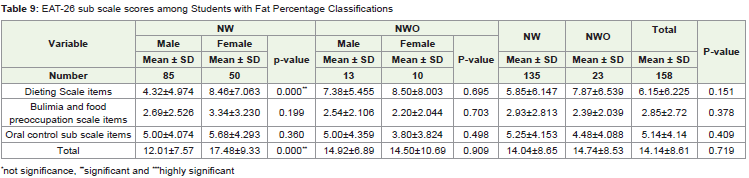
EAT-26 sub scale scores among students with fat percentage
classifications are presented in Table 9. In this table it was seen
that non obese female students (n=50) were found to have mean
(8.46 ± 7.06) higher than males (4.32±4.97) and it was highly
statistically significant (P-value<0.01) in dieting scale items. Among
the other subscales, male students had lower mean of EAT-26 sub
scale scores than the female students in except bulimia and food
preoccupation scale item, and oral control sub scale items in the obese
participants., however this wasn’t found to be statistically significant
(P-value>0.05).. Almost similar results were found with Bulimia and
food preoccupation scale items and oral control sub scale items.
Discussion
The main objective of this study was to examine and identify the relationships between EDs, NWO and its associated factors among Jazan University students. Present study compared the prevalence of EDs among the students according to study programs (health & nonhealth), gender, marital status and fat percentages (NWO & NW) (Table 2). The results depicts that the health program students 88% were normal in EDs and only 12% were in the risk of EDs. In same line [17] study the majority of medical students 88.9% were categorized as “Normal”, in EDs and only 11.0% in as a risk of EDs. Moreover, female students in non-scientific fields, such as arts related programs, had higher EAT-26 scores than female students in scientific/medical
fields [18] ‘16 . These results indicated that health program students may have more knowledge about nutrition and health which is may associate with more healthy eating behaviors.
The prevalence of EDs among genders between the university
students showed statistically significant difference. EDs prevalence
was higher in females 25% compared to males 10%. The most recent
studies confirm that EDs are highly prevalent worldwide, especially in
female [19,20]. A study by Yu and Tan 20found parallel results, female college students had a higher prevalence of EDs 11.6 %compared to
male college students 5.7%. [21] found in US college that 13% of
female have disordered eating attitudes compared to only 3.6% of
male. Increasing the prevalence of EDs among female students may
be due to the body image dissatisfaction that has been reported more
in female students and associated with developing EDs [22].
Present study compared between married and single students
to see the prevalence of EDs between them. Married students had a
significantly higher prevalence of EDs compared to single students
[23] noted that patients with EDs who live with a partner showed
higher eating symptomatology and psychopathology. Moreover, [24]
study depicted that 69% of the Japanese female patients had EDs
due to marital problems, separation, or divorce. These results may
indicate that marital problems associated with increasing the risk of
EDs among the population.
Our study compared between EAT-26 questions that were divided
into Dieting, Bulimia and Oral Control subscales (Table 4,Table 5,Table 6). Overall, the majority of participants had Normal (EAT-26
Score<20) in all items of attitudes and behaviors compared to (15.8%)
were disorders (EAT-26 Score ≥20).The highest dietary subscale item
(88%) in the disorder students, around 88% reported “Vomit after
eating” and 84% “Have the impulse to vomit after meals” [25] found
more than 70% of the disorder EAT participants reported that “Think
about burning up calories when exercising” followed by “Terrified
of being overweight” and “Preoccupied with desire to be thinner”.
These results indicated that college students practice abnormal eating
behaviors in order to maintain the body shape1.
Current study compared EAT-26 subscales between health and
non- health program students (Table 7). The major findings were
that in both programs, female students practice significantly more
than male students in dieting. In addition, females in non-health
programs had significantly more bulimia and food preoccupation
than male students. [25] -study found that a high prevalence of EDs
was among female students and [26] study identified that students
who in nutrition program which is a part of the health programs did
not have more EDs compared to students from other degrees. In
this study, students in health programs tended to restrict their food
consumption to control body weight, but they did not show a high
prevalence of EDs.
In the case of marital status, findings showed that married
students had a significantly higher mean of “dieting scales items” and
females had higher mean of “dieting scales items” than males, but
the difference was not statistically significant (Table 8,Table 9) [22].
found that females reported more body dissatisfaction than males. On
the other hand, Fragkos & Frangos,4 reported that being married was
one of the other risk factors, such as depressions, stress and searching
for a romantic relationship that can increase the risk of developing
disorder eating behavior. These results indicated that female students
tend to restrict food intake to lose weight and control body shape.
When interpreting the present results, limitations of this study
need to be considered. The descriptive nature of the cross-sectional
design of the study is a clear limitation because it is prone to certain biases [27]. The study included small sample size and may not
reflect eating attitudes and NWO among students. The bioelectrical
impedance measurement is affected by both the water and electrolyte
content of the body [28]. Also, the EAT-26 used in this study to assess
EDs cannot provide an accurate diagnosis, and the lack of experts in
mental health assessment made the study valuable only as an initial
screening method.
Conclusion
In conclusion, among undergraduate students, NWO students
had higher prevalence of EDs. Non health programs, married,
and female students had higher prevalence of EDs. Therefore,
nutrition education and counseling are essential to establishing and
maintaining healthy body fat composition and eating behavior. The
clinical nutrition department should provide nutrition education
and counseling among the university for the students about healthy
methods and practice in controlling and losing bodyweight and have
healthy body compositions.
References
2. Diagnostic and statistical manual of mental disorders (DSM) American
Psychiatric Association;2000
Citation
Otayf A, Mohan R, AL Khairat M, Bakerain A, Sarkhi A, et al. The Relationship between Normal Weight Obesity and Eating Attitudes among Undergraduate Students at Jazan University, KSA. Indian J Nutri. 2020;7(2): 217.