Research Article
Impact of Hypocaloric Diet Suggested With Dairy Food Products on Selected Biomarkers of Weight Gain in Overweight and Obese Working Women
Upasana1*, Pandey V2, Chakravarty A3, Tripathi YB2 and Gupta KK4
1Department of Home Science, Mahila College, Dalmianagar, Veer Kunwar Singh University, India
2Department of Medicinal Chemistry, Banaras Hindu University, India
3Department of Home Science, Banaras Hindu University, India
4Department of General Medicine, Banaras Hindu University, India
*Corresponding author: Upasana, Department of Home Science, Mahila College Dalmianagar, Dehri-on-Sone, Rohtas, India, Pin Code: 821307, Phone num: 9889191742; E-mail: me.upasana87@gmail.com
Article Information: Submission: 09/01/2020; Accepted: 14/02/2020; Published: 17/02/2020
Copyright: © 2020 Upasana, et al. This is an open access article distributed under the Creative Commons Attribution License, which permits unrestricted use, distribution, and reproduction in any medium, provided the original work is properly cited.
Abstract
Overweight and obesity is a major public health concern of today’s era and become a global pandemic now. The present study aimed to compute changes in biomarkers of weight gain via hypocaloric diet suggested with dairy food products. In order to investigate effect of intervention study 32 cases and 12 controls were selected from different faculties and institutes of Banaras Hindu University, Varanasi. The respondents were selected by purposive sampling technique and the tools used for data collection was interview schedule. Assessment of anthropometric, clinical, biochemical, proinflammatory and anti-inflammatory biomarkers was done before and after intervention i.e. of 6 months. The result showed that there was significant difference observed between case and control group after 6 months in weight, waist circumference, visceral fat, percent body fat, systolic blood pressure and fasting plasma glucose among both overweight and obese grade I respondents. Significant difference was also observed among overweight case and control respondents in total cholesterol, high density
lipoprotein, low density lipoprotein, total lipids, non-HDL cholesterol and cholesterol HDL ratio. Inspite of these, significant difference was also noticed among overweight respondents in TNF-alpha and among obese grade I in hs-CRP and adiponectin between case and control group. Significant difference was also observed between case and control group of overweight and obese grade I respondents in fat, carbohydrate, energy, calcium and dairy calcium intake after 6 months of intervention. Therefore, it seems reasonable to argue that dietary management via hypocaloric diet suggested with dairy food products and increased physical activity may retard the growing incidence of overweight and obesity in future.
Keywords
Hypocaloric diet; Dairy; Overweight; Obesity; Women
Introduction
Overweight and obesity is one of the biggest public health concerns of today’s era which affects the individual not only physically but physiologically and psychologically as well. The elemental cause of obesity is a result of positive energy balance between energy consumption and its expenditure-or a combination of both. The
altered phenomenon of hunger and satiety, lack of physical activity, decreased thermogenesis and resting metabolic rate over a long period of time may lead to the energy imbalance [1].
Now-a - days, obesity is regarded as a complex dysfunctional neuroendocrine problem in which genetic makeup and environmental factors act in concert [1-3]. The non-genetic risk factors encompass a wide range of social, physiological, environmental, and behavioral factors. Sedentary lifestyle and over-consumption high-fat and energy dense foods, is a major contributor of energy imbalance. In addition, other external factors like age, gender, food preference, medications, socio-economic status as well as psychological factor may give rise to
weight gain problem [4]. It is considered as a major contributor to the global burden of chronic diseases like hypertension, type 2 diabetes, hypercholesterolemia, heart diseases, insulin resistance, asthma, orthopedic disorders, several types of cancer, hormonal imbalance, disability and many other diseases. Overweight and Obesity also plays a pivotal role in the development of low grade inflammation also. In view of the high prevalence of overweight and obesity in women, the present study designed to assess the effect of hypocaloric
diet suggested with dairy food products on biomarkers of overweight and obesity.
Methodology
Selection of the respondents:
The working women from different faculties and institutes of Banaras Hindu University were selected as respondents for the study. Purposive sampling technique was followed for the collection of data and the tool used for the present study is interview schedule. The average age of the respondents varies from 29 to 60 years. All respondents were undergone 6 month of intervention programme i.e. dietary guidelines of following hypocaloric diet suggested with dairy food products. In this study inclusion and exclusion criteria were also
considered. These are as follows:• Inclusion criteria: The enrolment of respondents was based on their range of BMI i.e. only those respondents were selected
whose BMI was more than 24.9 which is the upper limit of normalcy as per the guidelines of NHLBI Obesity Education Initiative 2000 and Report of WHO Expert Consultation 2008.
• Exclusion criteria: The BMI range of less than 24.9, pregnant women as well as those who have some hormonal aberrations
was excluded from this present study.
Ethical consideration:
The studies were conducted under the rules and regulation of Institute Ethical Committee, IMS,BHU (Ethical Committee Letter Number - Dean/2012-13/183).
Sample size:
Sample size can be described as a small proportion of a population selected for observation and analysis. The sample size was estimated by using the following formula-
Where,
P1 = Anticipated probability of exposure of cases (0.68)
P2 = Anticipated probability of exposure of control
Z1-α/2= Value of normal deviate at considered level of significance
Z1-β = Value of normal deviate at considered power of study
The value of P2 is generally obtained by considering odd ratio
(OR) and is calculated by-

Here, the value of anticipated probability of exposure of cases was
taken as 0.68 and the anticipated odd ratio was considered as 4.
he sample size estimated at 5 % level of significance and 80% power of test. Here, the values of P1 = 0.68, OR = 4, Z1-α/2 = 1.96, Z1-β = 0.842, P2 = 0.35 (calculated from equation 2), were substituted in equation to get the minimum sample size. Therefore, the required sample size is 32 i.e. 32 cases and study. But due to lack of fund, the number of cases and control were manipulated according to experiments.
Socio-demographic characteristics:
This section deals with the general characteristics of the respondent i.e. about their age, marital status, type of family, religion, education, occupation, family income per month, socio-economic status and food habits.Anthropometric measurements:
The anthropometrical measurements of the respondents i.e. height and weight were measured by using standard technique [5]. BMI was calculated by dividing weight in kilograms by height in meters square [6]. BMI was then categorized based on standards i.e. NHLBI Obesity Education Initiative 2000 and Report of WHO Expert Consultation 2008 for the assessment of obesity [7,8]. After that, waist and hip circumference were measured to assess the abdominal obesity. Waist Hip Ratio (WHR) was calculated by dividing the waist circumference and hip circumference. As per classification of WHO Expert Consultation 2008, cut off values were used for WC and WHR for the assessment of central or abdominal obesity [8]. Visceral Fat (VF) and Percent Body Fat (PBF) were also measured by using Omron Body Composition Monitor - HBF 212 [9].Clinical parameters:
The clinical parameters include systolic blood pressure and diastolic blood pressure. Blood pressure was measured by using mercury sphygmomanometer (Novaphon 300) and Life - Line stethoscope from the left upper arm of the respondents in sitting position [10,11].Biochemical, proinflammatory and anti-inflammatory markers:
For the assessment of biochemical, proinflammatory and antiinflammatory markers 5 ml of blood sample was withdrawn from the anticubital vein following overnight fasting. For serum, blood sample was collected in plain vial and incubated at 37 ˚C for 30 minutes. After that, samples were centrifuged at 3000 rpm for 10 to 20 minutes and the supernatant collected in clean and dry serum test tube for analysis. For plasma separation, commercially available anticoagulant treated tubes (i.e. EDTA treated) was used.Measurement of concentration of Fasting Plasma Glucose (FPG)
was done by Accurex Biomedical), total cholesterol, triglycerides,
high density lipoprotein (HDL) cholesterol was done by Tulip group
of corals by using Robonik Prietest Touch Biochemistry Analyser,
Mumbai, India [12]. Similarly measurement of fasting insulin was
done by Siemens Health care Diagnostic kit and Advia Centaur Chemiluminescence Immunoassay (CLIA) analyzer. Additionally,
measurement of Low Density Lipoprotein (LDL), Very Low Density
Lipoprotein (VLDL) and total lipids were calculated by Friedewald’s
equation. The analysis of insulin resistance i.e. HOMA-IR was
calculated by Mathews et al., equation i.e. Glucose (mg/dl) X Insulin
(μU/ml) / 405 and QUICKI was calculated by using formula 1/ (log
fasting insulin [μU/ml] + log fasting glucose [mg/dl]) [13,14]. The
analysis of proinflammatory markers i.e. hs-CRP and TNF- alpha
was done by using Diagnostics Biochem Canada Inc. and Diaclone -
Human TNF-alpha ELISA kit respectively [15,16]. The measurement
of anti-inflammatory marker i.e. adiponectin was done by Assay Pro:
Assay Max Human Adiponectin ELISA kit [17]. The ELISA reader
used in the assessment of proinflammatory and anti-inflammatory
markers was Transasia ELISA reader [18].
Dietary assessment:
Nutrient intake of the respondents was recorded by 7 days food
record method and calculated with the help of nutritive value of
Indian foods [19]. The respondents reported the type and quantity
of meal (i.e. food and beverages) consumed over the past 7 days. The
quantities of food consumed were converted into raw equivalents
by using household measurements to estimate the portion size of
consumed food. The intake was then compared with recommended
dietary allowances i.e. RDA 2010 [20].Statistical analysis of the data:
Statistical analysis was performed by using trial version of
Statistical Package of Social Sciences (SPSS) Version 20.0. The data
was analyzed by using descriptive statistics such as mean and standard
deviation. For determining the significance between the variables
chi square test was used. Furthermore, to find statistical difference
between case and control respondents unpaired t test was used.Results
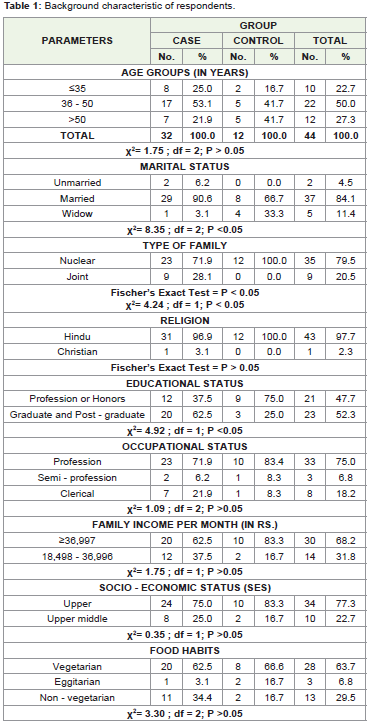
In the present study, Table 1 shows the background characteristics
of the respondents. The table reveals that maximum respondents in
the case group belongs to the age group of 36-50 years and of the
control belongs to either 36-50 years or >50 years. The table also
showed that maximum respondents of both the group i.e. case as well
as control group were married, lives in a nuclear type of family and
of Hinduism religion. Irrespective of the group maximum of them
had graduation and above type of educational status, had profession
type of occupation and had family income Rs ≥36,997 per month.
Moreover, maximum of case as well as control group respondents
belonged to upper socio-economic status and vegetarian type of food
habits.
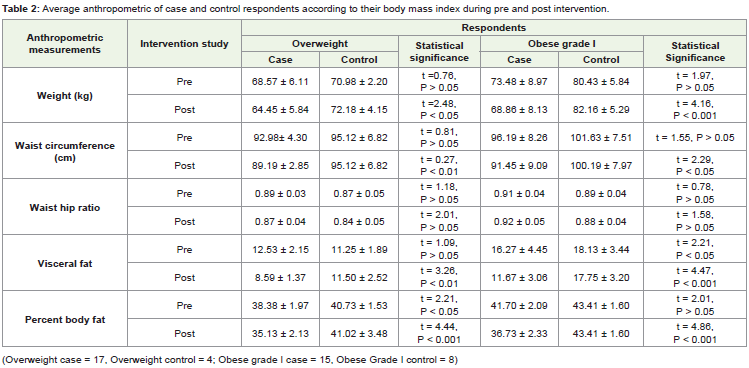
Table 2 reveals about the anthropometric measurement of case
and control respondents during intervention study. It was observed
that in context of overweight respondents significant difference exists
between case and control respondents in the measurement of weight
(P < 0.05), waist circumference (P < 0.01), visceral fat (P < 0.01) and
percent body fat (P < 0.001) after 6 month of intervention. Similar result
were also noticed among case and control respondents of obese grade
I respondents i.e. significant difference persists in the measurement
of weight (P < 0.001), waist circumference (P < 0.05), visceral fat (P
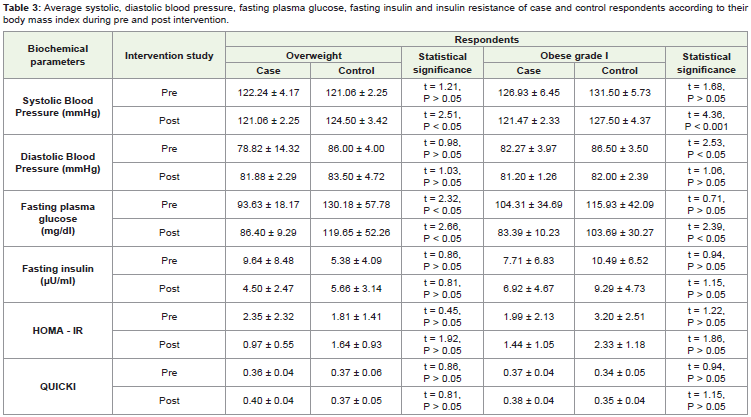
< 0.001) and percent body fat (P < 0.001) after intervention. From Table 3, significant difference was observed between case and control
respondents in clinical parameter i.e. systolic blood pressure in both
overweight (P < 0.05) and obese grade I (P < 0.001) after 6 month
of intervention. Similarly, after 6 month of intervention, significant
difference observed between case and control respondents in the
level of fasting plasma glucose among both overweight (P < 0.05) and
obese grade I respondents (P < 0.05).
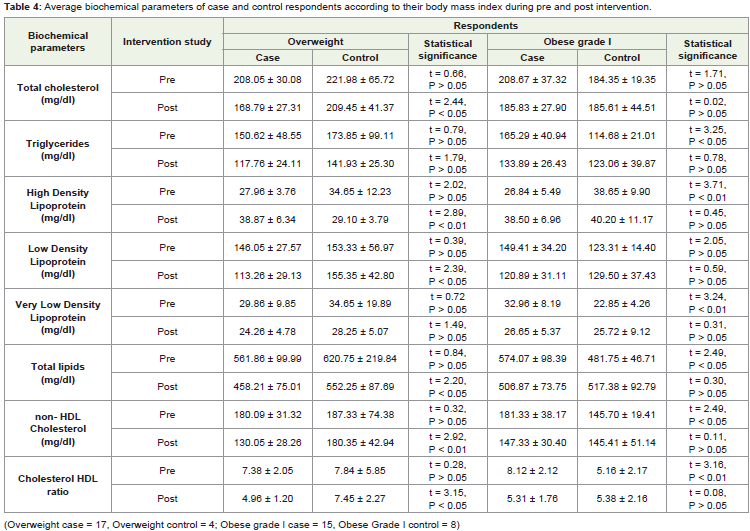
Average biochemical parameter change between case and
control respondents after 6 month of intervention was depicted in
Table 4. From this table it was interpreted that among overweight
respondents there was significant difference persists between case and control respondents in the level of total cholesterol (P < 0.05),
high density lipoprotein (P < 0.01), low density lipoprotein (P < 0.05),
total lipids (P < 0.05), non-HDL cholesterol (P < 0.01) and cholesterol
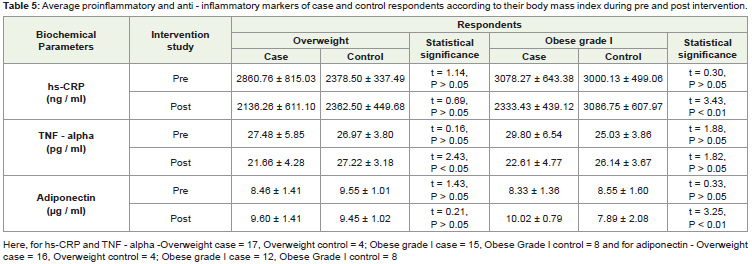
HDL ratio (P < 0.05). Table 5 shows about proinflammatory and
anti-inflammatory markers significant difference between case and
control respondents after 6 month of intervention. The table shows
that there was significant difference exists between case and control
respondents in the level of tumor necrosis factor- alpha (P < 0.05)
among overweight respondents. Similarly among obese grade I
respondents, significant difference exists in the level of hs-CRP (P <
0.01) and adiponectin (P < 0.01) among case and control respondents
of obese grade I after intervention.
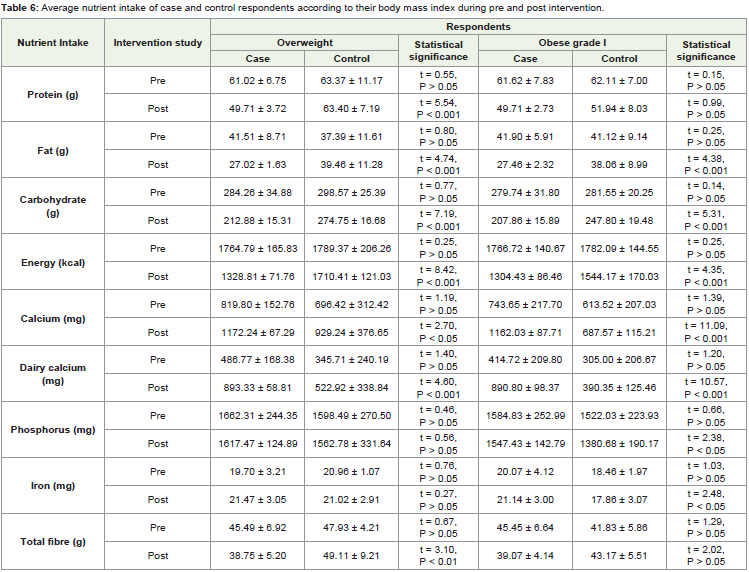
From Table 6, it was interpreted that among overweight
respondents, there was significant difference exists between case and control respondents in the intake of protein (P < 0.001), fat (P
< 0.001), carbohydrate (P < 0.001), energy (P < 0.001), calcium (P
< 0.05), dairy calcium (P < 0.001) and total fibre (P < 0.01) after 6
months of intervention. Similarly, in the context of obese grade I, it
was observed that significant difference exists in the intake of fat (P
< 0.001), carbohydrate (P < 0.001), energy (P < 0.0012), calcium (P <
0.001), dairy calcium (P <0.01), phosphorus (P < 0.01) and iron (P <
0.02) among case and control respondents after intervention.
Discussion
Obesity is a condition in which the natural energy reserve, stored
in the fatty tissues of human and other mammals is increased to a point where it is associated with certain health condition or increased
mortality [21]. It is described as an abnormal growth of adipose tissue
due to an enlargement of fat cell size (hypertrophic obesity) or an
increase in fat cell number (hyperplastic obesity) or a condition of
both.
In this present study, it was found that irrespective of group
maximum respondents were either overweight or obese grade in the
age group of 36 years or above. Therefore, it may be concluded that
maximum respondents started suffering from the problem of weight
gain in the younger age. This may be due to faulty eating habits,
sedentary lifestyle, lack of physical activity, genetic makeup, stress,
hormonal imbalance or may be due to any other reasons. Inspite of
this, it was also noticed that maximum respondents belongs to the
upper socio-economic status, this may be reason of their overweight
and obesity. Since, as we know that high socio-economic status
respondents have more purchasing power, as a result they may take
more energy dense food outside the home. Hence, this may contribute
to the development of weight gain of the respondents.
As we know that overweight and obesity is a global public health
nutritional problem of today’s era and are rising at a faster pace in developing countries also. Many researchers reported that dairy
food as a nutrient dense food as well as health promoting food
that offers many health benefits [22,23]. It was observed from the
Table 2 that with the consumption of hypocaloric diet with dairy
food products, there was decrement in the measurement of weight,
waist circumference, waist hip ratio, visceral fat and percent body
fat observed in both case group of overweight and obese grade I
respondents. Inspite of this, there was significant difference also
exists in the measurement of weight, waist circumference, visceral
fat and percent body fat among case and control respondents after
intervention. A prospective investigation in the Nurse’s Health
Study I and II and Health Professional Follow up study on 120,887
men and women showed that there was inverse association exists
with the consumption of yoghurt with 4-year weight change
[24,25]. Another 9-year prospective study on 3417 respondents also
reported that irrespective of gender, respondents who consumed
more dietary calcium (in form of low or high fat dairy products)
had a lower increase in waist circumference [26]. This may be due
to the fact that dietary calcium may contribute to the precipitation
of long chain fatty acids that prevents their absorption in intestine
and increase their excretion [27,28]. The precipitation of long chain fatty acids by calcium may be possible mechanism of dairy’s impact
on central obesity [23]. Murphy et al also reported that dairy food
consumption was inversely associated with body mass index, percent
body fat and waist circumference. The mechanism was not entirely
clear regarding impact of dairy food consumption on improvement
of body composition however, it was been postulated that the benefit
may be due to calcium which is thought to reduce lipogenesis and
increase lipolysis [25].
A prospective study on metabolic syndrome markers in 3417
French adults demonstrated that dairy and dietary calcium intake
were associated with lower diastolic blood pressure in all participants
but were associated with a lower increase in systolic blood pressure
[23,26]. Another publication of same prospective study found that
calcium density was also associated with a systolic blood pressure
in all the participants [23,26]. van Meijl and Mensink, also reported
that 8 weeks of dairy consumption was associated with lower systolic
blood pressure among 35 overweight and obese adults [27-30]. Similar
results were interpreted in this study that there was decrement in
systolic blood pressure observed among both case group of overweight
and obese grade I respondents and that difference was statistically
significant after intervention. Recent studies also explained that
the micronutrients present in the dairy’s have an effect of lowering
blood pressure. Dairy contains calcium, vitamin D, potassium and
magnesium, all of which helps in regulating blood pressure [23,31].
From Table 3, it was also interpreted that there was significant
decrement in the level of fasting glucose observed after intervention
and that difference was statistically significant among both case and
control group of overweight and obese grade I respondents. Previous
reviews reported that dairy food products have insulinotrophic
properties as a result of protein content of milk which may decrease
serum glucose levels [23,31]. Previous researches also enumerated
that meeting adequate dairy intake levels is associated with an
improved serum lipid profile and reduced risk of cardiovascular
diseases [30,32,33]. From Table 4, almost similar result was reported
that highly significant difference exists among case and control group
in the average level of total cholesterol, high density lipoprotein, low
density lipoprotein, total lipids, non-HDL cholesterol and cholesterol
HDL ratio of overweight respondents.
From Table 5, it was interpreted that among overweight
respondents, decrement in the level of TNF-alpha as well as significant
difference between case and control respondents observed was
observed after 6 months. In context of obese grade I respondents
also decrement in the level of hs-CRP and increment in the level of
adiponectin observed and the difference between case and control
respondents after 6 months was statistically significant. Similar findings
was observed by Zemel et al that there was reduction in the level of
plasma TNF - alpha and CRP by 15 percent and 13 percent happened
at P < 0.001 as well as increase in the level of plasma adiponectin
occurred by 20 percent at P < 0.002 were apparent at day 7 of the
dairy supplemented diet and became more pronounced throughout
the dairy treatment when compared with non-dairy supplemented
diet [34-36,]. A converse finding was also reported in previous study
that there was no significant alteration in biomarkers of inflammation
observed with energy restricted dairy intervention [37].
Various studies reported that inclusion of dairy products with
energy restricted diet has an anti-obesity effect. Dairy products
are the main source of calcium and different mechanism has
been already reported regarding the impact of dietary calcium in
regulation of energy metabolism and obesity risk. It was explained in
previous studies that dietary calcium reduces intracellular calcium in
adipocytes thereby reduces expression of fatty acid synthase enzyme
required for lipid synthesis. The potential hypolipidaemic mechanism
of calcium may occur at gastrointestinal tract via inhibition of fat
absorption, increased fecal fat excretion, inhibition of bile acid
absorption and calcium-induced increase in the conversion of
cholesterol to bile acids [38-39]. Table 6, showed that the intake of
calcium and dairy calcium increases after 6 months of intervention
and there was significant difference also persists between case and
control respondents of both overweight and obese grade I. This may
be one of the reasons of improved status of anthropometric, clinical,
biochemical, proinflammation of respondents of case group (i.e.
overweight and obese grade I) via intervention.
It may be concluded that sedentary lifestyle, high intake of
nutrients (i.e. protein, carbohydrate and phosphorus) and genetic
predisposition may be the cause of overweight and obesity. Significant
difference between case and control group was observed among
both overweight and obese grade I respondents in anthropometric
measurement except in waist-hip ratio. In context of clinical and
biochemical parameters, significant difference between case and
control group was observed in systolic blood pressure and fasting
plasma glucose observed among both overweight and obese grade I
respondents. Inspite of this, significant difference was also noticed
between case and control overweight respondents in the biochemical
parameters like total cholesterol, high density lipoprotein, low density
lipoprotein, total lipids, non - HDL cholesterol and cholesterol HDL
ratio. Furthermore significant difference was also noticed between
case and control respondents in context of TNF-alpha in overweight
respondents and hs-CRP and adiponectin in context of obese grade I
respondents. Additionally highly significant difference was observed
in the intake of calcium and dairy calcium between case and control
respondents of both overweight and obese grade I after 6 month of
intervention. In the nutshell, it can be concluded that incorporating
hypocaloric diet with dairy food products and increased physical
activity is the cornerstone for achieving and maintaining a healthy
body weight and composition.
Acknowledgement
We own our sincere thanks to Prof. I. J. Singh, for his guidance
in statistical analysis. We are also deeply regretted if we are unable
to cite the paper of all those authors who have contributed to our
understanding about this topic. The present research received
fellowship from UGC (UGC-NET- SRF), Government of India, New
Delhi.
References
Citation
Upasana, Pandey V, Chakravarty A, Tripathi YB, Gupta KK. Impact of Hypocaloric Diet Suggested With Dairy Food Products on Selected Biomarkers of Weight Gain in Overweight and Obese Working Women. Indian J Nutri. 2020;7(1): 211.