Research Article
Development of Vitamin D Status in School Going Children by School Meal Planning in Selected School of District Pakpattan
Manzoor MS1*, ul Mustafa Z2, Naseem N3, Gilani SM4 and Tahir H5
1Department of Food Science and Nutrition, DHQ hospital Pakpattan, Pakistan
2Department of Pharmacy, DHQ hospital Pakpattan, Pakistan
3Stabilization & day care center, DHQ hospital Pakpattan, Pakistan
4Department of food science, Government College University, Pakistan
5Department of food science, Minhaj University, Pakistan
Corresponding author: Manzoor MS, Department of Food Science and Nutrition, DHQ Hospital, Pakpattan, Pakistan, E-mail: shahzadmanzoor341@gmail.com
Citation: Manzoor MS, ul Mustafa Z, Naseem N, Gilani SM, Tahir H. Development of Vitamin D Status in School Going Children by School Meal Planning in Selected School of District Pakpattan. Indian J Nutri. 2018;5(2): 194.
Copyright © 2018 Manzoor MS, et al. This is an open access article distributed under the Creative Commons Attribution License, which permits unrestricted use, distribution, and reproduction in any medium, provided the original work is properly cited.
Indian Journal of Nutrition | ISSN: 2395-2326 | Volume: 5, Issue: 2
Submission: 03/11/2018; Accepted: 14/12/2018; Published: 18/12/2018
Abstract
This result of cross-sectional study explained that there was low vitamin D status in school going children due to less intake of food enrich in vitamin D. Before nutritional enrich vitamin D meal serum vitamin D concentration is < 30 ng/ml, which is insufficient for child growth, physically and mentally, this deficiency lead to many bones and health, degenerative disorder in child and cause less bone mass density, bone mass content, softening of bones and rickets in children. The Main focus of the meal to enhance vitamin D status through vitamin enriches foods that are included in child meal that are consumed on a daily base from the different food groups.
After the meal there is increase in vitamin D serum concentration due to above mentioned food intake and dairy product 1.0 cups/1000 kcal; P = 0.04. The study suggested that consumption of dairy products providing Vitamin D, calcium, phosphorus, magnesium, potassium to school going children [1]. The Main purpose of the study is to improve the Vitamin S status and make them healthy both in way of physically and psychologically.
Introduction
Vitamin D is fat soluble vitamin present in some food items a sometime available in the form for a supplement. Its production done naturally when the sun ultraviolet ray directly falls on the body skin and stimulate vitamin D synthesis. The Main sources of Vitamin D are sun exposure, food and vitamin D supplements that vitamin D is must go two major hydroxylation processes for foundation inside the body. In the first step conversion of vitamin D into 25-hydroxyviatamin D [25(OH) D] and this product is converted into activated form into the kidney known as 1,25-dihydroxyvitamin D [1,25(OH)2D] that is wellknown as calcitriol and work as hormone in blood and as a regulator for maintaining the calcium and phosphate level in the bloodstream and support bone remodeling and growth. Vitamin also known as sunshine vitamin that decrease the risk of skin cancer [2].
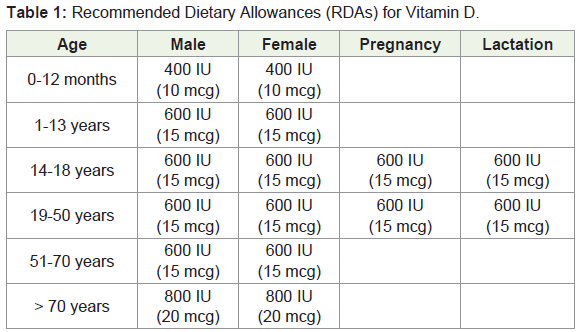
25-hydroxyvitamin D 25(OH)D concentration in serum is a major display of vitamin D status, but it does not give an explanation about the stored vitamin D inside the body tissue due to short half life of fifteen days and serum concentration are synchronized by Parathyroid Hormone (PTH), calcium and phosphate. In 2012 Institute of Medicine (IOM) committee accomplished that serum 25(OH) D that is the hydroxyvitamin D2 level of 50 nmol/L (20 ng/ml) is required for normal bone health. Food and Nutrition Board (FNB) recognized a Recommended Dietary Allowance (RD) for vitamin D/daily intake that is adequate to maintain calcium metabolism and bone health status. Vitamin D recommended in both International Units (IUs) & Micrograms (mcg); 40 IU is equal to 1mcg that is mentioned in Table 1.
Vitamin D plays an important role in reducing of abnormal scar formation [3]. Normal Level of vitamin D in human blood serum is 20 ng/ml to 50 ng/ml and value higher than 50 ng/ml are readily tolerated by the body result in treatment of asthma and many other bone diseases [4]. It reduces the effect of diseases related to the heart [5]. It also helps in flexible mood, maintains optimum body weight and reduced depression [6].
Vitamin D deficiency affects bone and growth of different part of the body and children with vitamin D deficiency having soft bone and unable to bear up their body weight knowing as rickets and adult with deficiency lead to osteomalacia this leads to weak bones [7]. Vitamin D deficiency leads to decrease in bone mineral density of the body [8].
The foundation for a life is starting from childhood and with the growth and development, nutrient requirements are also increased for proper body functions. Recommendation and dietary guidelines are set for different age groups by (FNB & IOM, 2005; USDA & HHS, 2010) [4]. Vitamin D depends chiefly upon sun exposure of the skin, but if less sun exposure in the pacific and northwest area dietary intake is very important to maintain normal body physiological functions [1]. Pakistan situated in a region across latitude 24° 35° North and longitude 61° east to 78° east. Vitamin D deficiency is more common in neonates, infants, child under 5 years, adult and more in pregnant and lactating women in spite of its lavish sunshine [9]. Many indicator influence vitamin D deficiency such as age, season, gender, food intake, eating habits, culture, ethics, less sun exposure, unavailability of vitamin D supplement, skin pigmentation an genetic factor [10].
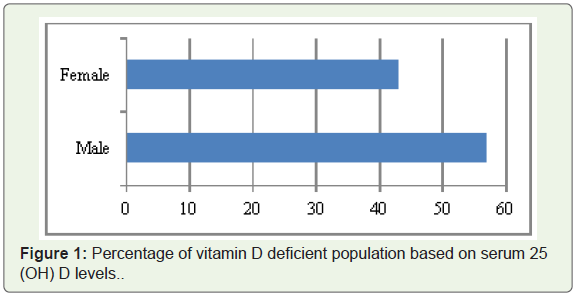
A level of 25(OH)D in the serum defines the vitamin D deficiency, insufficiency, and most studies show that if level of 25(OH) is < 20ng/ml lead to vitamin D deficiency and consider these values as standard the prevalence of vitamin D deficiency is near about 70% in South Asia and widespread vitamin D and other micronutrient deficiencies are more leading in Pakistan & it is estimated that 70% healthy people are vitamin D deficient [11]. Most vitamin D deficient affected groups are female due to less calcium and vitamin D intake and loss through menopause, pregnancy and lactating [12]. Similarly illustrated that 56.9% of healthy adult males and 43.1 adult females are vitamin D deficient with a cutoff value of ≤ 20 ng/ml serum 25(OH)D as shown in following Figure 1 [13]. Data shows that extensive prevalence of vitamin D deficiency declaring Pakistani population in the vitamin D deficient nation.
In U.S population survey, most elementary school going children having very low levels of fiber, vitamin E and high saturated fats and sodium intake with poor vitamin D concentration in blood [14,15]. School meals are low in whole grains, fiber, legumes, vitamin E, and high in saturated fats and sodium, low vitamin D foods, less exposure to sun, no physical activity, and consumption of carbonated drinks at school canteen which lead to vitamin D deficiency which increase as child become teenagers [16-18]. A Different kind of program is established to mitigate the micronutrient deficiencies and improve nutrient intake in school going children with a main focus on low income families due to their limited resources but in this improvement are limited [19].
Expanded Food and Nutrition education Program (EFNEP) is planned to provide awareness and nutrition education in schools through enrichment skills, after school program, EFNEP clubs, schools and hospital camps, and understanding workshop for drawback urban and rural youth [20]. In Pakistan the vitamin D status has been reported as 41.1%, including 10.1% severe cases while 31% deficient cases. Vitamin D Standardization Program (VDSP) is used for measurement of vitamin D level in food, assessment of vitamin D status, measurement procedure, recommended dietary allowance and measurement of serum vitamin D level in a population around the world [21]. National nutrition Survey tested the prevalence of prevalence of Vitamin D deficiency in child under 5 year age that is 40%.
A report related to Pakistan demonstrated that Vitamin D deficiency is rising, but this issue has not yet gotten any attention by government authorities or by any individual [22,23]. This problem is getting worse because people have not basic knowledge and awareness to maintain the optimum vitamin D status of the body [24].
Purpose of the Study
Improve Vitamin D status through the School meal program in school going children.
Materials and Method
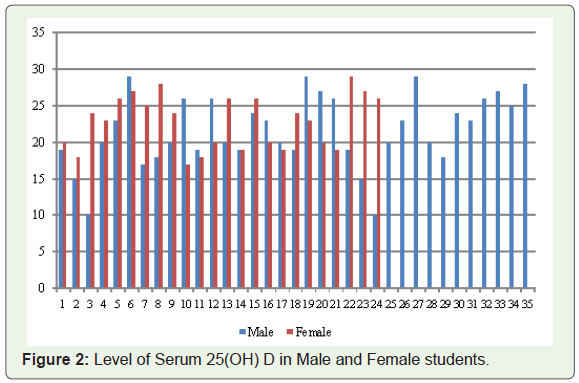
I have selected for my study plan choose my city are that is Pakpattan Sharif and its literacy rate of is 60.7% urban and rural literacy rate is 33.8% under Sahiwal division. I choose four private school children class group of 3 & 4 in my area and receiving an approval letter from the school for my study. I visited each classroom and explain about the objective of study to parents and teacher. The process of screening is done by collecting blood sample by finger prick method and refers it to the Vitamin D test. I have selected 100 students (50 boys, 50 girls) as a sample from the above mention four school classes of 3 & 4. Selection is based on the children attending school at age 5-11 years and having no genetic vitamin D deficiency and having a low family income. Blood diagnosis is done by a certified laboratory using standard reference method. After the test report result 59/100 students are vitamin D deficient in which 35 boys and 24 girls, among of them 37 was 6-9 year age and 22 were 9-11 year age students having a vitamin D deficiency are as shown in Figure 2.
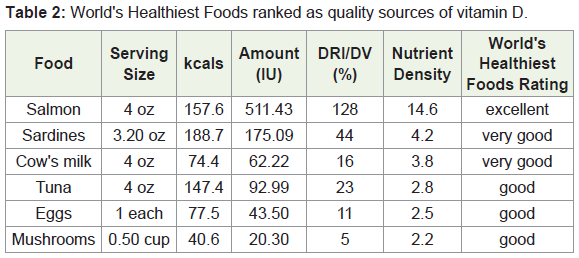
After this process of the assessment, nutrition quest is developed based on Food Frequency Questionnaire (FFQ) consist of 5 food items, 1 page consist of 6 categories & food items commonly consumed by students during previous week based on My Plate. For this purpose food screener at school canteen is established to take record of every intake and also done by parents helps. FFQ is used to underestimate food and nutrient intake and adjusted calorie are 1000 kcal. Dietary intake is given at the base of sex, age, weight, height and physical activity. Food included in lunch is calcium and vitamin D is included that are salmon, raw milk, orange juice, rice, oat eggs, cheese, mushroom, beans, spinach and normally sun exposure (Table 2).
Meal This meal is applied for 2 months and during this time blood sample is collected again after an interval of 3 weeks and after two months there is satisfactorily increase in 25(OH)D in the blood.
Statistical analysis is performed by using SPPS software. Nutrients intake, food group servings and vitamin D saturation were compared between age groups (5-8 year old versus 9-11 years old) (Table 3 and Table 4). Value are given below in containing the mean and Standard Error Mean (SEM). Also test nutrient intake, season and vitamin D status. The effects are not too much meaning & are not included. All tests were two sided and declared at P ≤ 0.05.
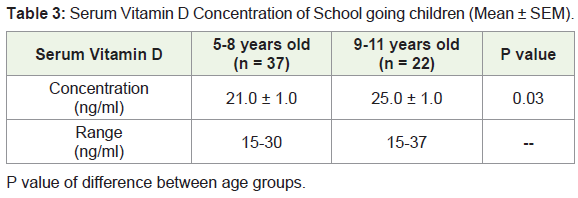
P value of difference between age groups.
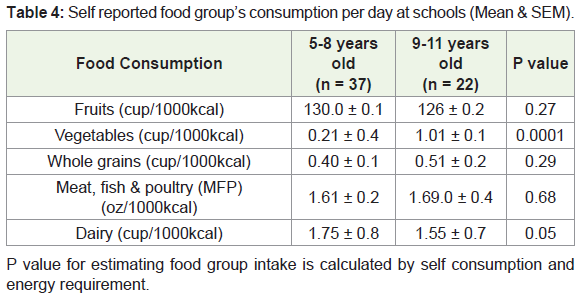
P value for estimating food group intake is calculated by self consumption andenergy requirement.
Results and Discussion
This result of cross sectional study explained that there is low vitamin D status in school going children due to less intake of food enrich in vitamin D. Before nutritional enrich vitamin D meal serum vitamin D concentration is < 30 ng/ml, which is insufficient for child growth, physically and mentally, this deficiency lead to many bone and health degenerative disorder in child and cause less bone mass density, bone mass content, softening of bones and rickets in children. The main focus of the meal to enhance vitamin D status through vitamin enriches foods that are included in child meal that are consumed on a daily bases from the different food groups.
After the meal there is increase in vitamin D serum concentration due to above mentioned food intake and dairy product 1.0 cups/1000 kcal; P = 0.04. The study suggested that consumption of dairy products providing Vitamin D, calcium, phosphorus, magnesium, potassium to school going children [1]. Main purpose of the study is to improve the Vitamin S status and make them healthy both in way of physically and psychologically.
Implementation of Program
For normal development and physiological function adequate nutrition status in childhood is foundation throughout life. This Project stated that low vitamin D status and inadequate nutrient intake are more common in school going children. This program is comprehensive not only for low income family, but also for all populations. This happened only by proper awareness, socializing activities, kids friendly books and healthy recipe that is easily available.
References
- Gao X, Wilde PE, Lichtenstein AH, Tucker KL (2006) Meeting adequate intake for dietary calcium without dairy foods in adolescents aged 9 to 18 years (National Health and Nutrition Examination Survey 2001-2002). J Am Diet Assoc 106: 1759-1765.
- Scarlett WL (2003) Ultraviolet radiation: sun exposure, tanning beds, and vitamin D levels. What you need to know and how to decrease the risk of skin cancer. J Am Osteopath Assoc 103: 371-375.
- Munger KL, Levin LI, Hollis BW, Howard NS, Ascherio A (2006) Serum 25-hydroxyvitamin D levels and risk of multiple sclerosis. JAMA 296: 2832-2838.
- Trumbo P, Schlicker S, Yates AA, Poos M (2002) Dietary reference intakes for energy, carbohydrate, fiber, fat, fatty acids, cholesterol, protein and amino acids. J Am Diet Assoc 102: 1621-1630.
- Wang TJ, Pencina MJ, Booth SL, Jacques PF, Ingelsson E, et al. (2008) Vitamin D deficiency and risk for cardiovascular disease. Circulation 117: 503-511.
- Jorde R, Sneve M, Figenschau Y, Svartberg J, Waterloo K (2008) Effects of vitamin D supplementation on symptoms of depression in overweight and obese subjects: randomized double blind trial. J Intern Med 264: 599-609.
- Holick MF (2007) Vitamin D deficiency. N Engl J Med 357: 266-281.
- Pittas AG, Dawson-Hughes B, Li T, Van Dam RM, Willett WC, et al. (2006) Vitamin D and calcium intake in relation to type 2 diabetes in women. Diabetes Care 29: 650-656.
- Akhtar S (2015) Malnutrition in South Asia-A critical reappraisal. Crit Rev Food Sci Nutr 56: 2320-2330.
- Akhtar S (2013) Zinc status in South Asian populations-an update. J Health Popul Nutr 31: 139-149.
- Akhtar S, Ahmed A, Ahmad A, Ali Z, Riaz M, et al. (2013) Iron status of the Pakistani population-current issues and strategies. Asia Pac J Clin Nutr 22: 340-347.
- Lowe NM, Ellahi B, Bano Q, Bangash SA, Mitra SR, et al. (2011) Dietary calcium intake, vitamin D status, and bone health in postmenopausal women in rural Pakistan. J Health Popul Nutr 29: 465-470.
- Mansoor S, Habib A, Ghani F, Fatmi Z, Badruddin S, et al. (2010) Prevalence and significance of vitamin D deficiency and insufficiency among apparently healthy adults. Clin Biochem 43: 1431-1435.
- Rhodes D, Clemens J, Goldman J, Lacomb R, Moshfegh A (2012) 2009-2010 What we eat in America, NHANES Tables 1-36. Worldwide Web Site: Food Surveys Research Group.
- Kumar J, Muntner P, Kaskel FJ, Hailpern SM, Melamed ML (2009) Prevalence and associations of 25-hydroxyvitamin D deficiency in US children: NHANES 2001-2004. Pediatrics 124: e362-e370.
- Ogden CL, Lamb MM, Carroll MD, Flegal KM (2010) Obesity and socioeconomic status in children and adolescents: United States, 2005-2008. NCHS Data Brief pp: 1-8.
- Condon EM, Crepinsek MK, Fox MK (2009) School meals: types of foods offered to and consumed by children at lunch and breakfast. J Am Diet Assoc 109: S67-S78.
- Ballew C, Kuester S, Gillespie C (2000) Beverage choices affect adequacy of children’s nutrient intakes. Arch Pediatr Adolesc Med 154: 1148-1152.
- Rabe M, Ohri-Vachaspati P, Scheer SD (2006) The influence of the Youth Expanded Food and Nutrition Education Program on nutrition knowledge and self-reported behaviors of elementary school children. J Extension 44: 3RIB6.
- Martin LJ (2007) Online nutrition education: perceived understanding, acceptance, and usability of food and nutrition bytes curriculum for the Expanded Food and Nutrition Education Program. Kansas State University.
- Cashman KD, Kiely M, Kinsella M, Durazo-Arvizu RA, Tian L, et al. (2013) Evaluation of Vitamin D Standardization Program protocols for standardizing serum 25-hydroxyvitamin D data: a case study of the program's potential for national nutrition and health surveys. Am J Clin Nutr 97: 1235-1242.
- Rab SM (1976) Occult osteomalacia amongst healthy and pregnant women in Pakistan. Lancet 2: 1211-1213.
- Atiq M, Suria A, Nizami SQ, Ahmed I (1998) Maternal vitamin-D deficiency in Pakistan. Acta Obstet Gynecol Scand 77: 970-973.
- Sahibzada AS, Khan MS, Javed M (2004) Presentation of osteomalacia in Kohistani women. J Ayub Med Coll Abbottabad 16: 63-65.