Research Article
Validation of a Semi-Quantitative Food Frequency Questionnaire for Use with an Adult South Indian Population
Kenneth Chui KH1, Ravi S2, Vanzan H2, Must A1, Liu Y1, Thanikachalam S2, Thanikachalam M1* and Bermudez OI1
1Department of Public Health and Community Medicine, Tufts University School of Medicine, USA
2PURSE-HIS, Sri Ramachandra University, India
Corresponding author: Thanikachalam M, Tufts University School of Medicine, Department of Public Health and Community Medicine, 136 Harrison Avenue, Boston, MA 02111, USA, Tel no: 617-636-0812; E-mail: Mohan.Thanikachalam@tufts.edu
Citation: Kenneth Chui KH, Ravi S, Vanzan H, Must A, Liu Y, et al. Validation of a Semi-Quantitative Food Frequency Questionnaire for Use with an Adult South Indian Population. Indian J Nutri. 2018;5(2): 191.
Copyright © 2018 Kenneth Chui KH, et al. This is an open access article distributed under the Creative Commons Attribution License, which permits unrestricted use, distribution, and reproduction in any medium, provided the original work is properly cited.
Indian Journal of Nutrition | ISSN: 2395-2326 | Volume: 5, Issue: 2
Submission: 13/04/2018; Accepted: 20/07/2018; Published: 24/07/2018
Abstract
Objective: To assess the validity and reproducibility of a Food Frequency Questionnaire (FFQ) developed for assessing nutrient intake of South Indian adults.
Design: An FFQ based on commonly used foods by rural and urban adults was developed and validated against 24-hour recalls.
Setting: The study was conducted in urban, semi-urban and rural communities from Tamil Nadu, Chennai, India.
Subjects: We recruited 8,080 participants of 20 or older years of age, 56% women, distributed as 2,221 urban, 2,821 semi-urban and 3,038 rural participants.
Results: We developed and validated an FFQ, comparing it with data from single 24-hour recalls. For the total sample, and for men and for women, estimates of total energy and for macronutrients, were significantly higher when measured with the FFQ as compared to similar estimates from the recalls. Furthermore, with the dietary data from both methods, energy adjusted and log-transformed, we estimated the Pearson, Spearman’s and Lin’s rho correlation coefficients. Most of the coefficients were statistically significant (p ≤ 0.001) for all nutrients, except for vitamin A and selenium. Carbohydrate, zinc, protein, and niacin had the strongest correlation, ranging between 0.322 through 0.734.
Conclusions: This study reports on the validation of a new instrument for dietary assessment of adults from Tamil Nadu, South India. Our FFQ demonstrated an acceptable agreement with the 24-hour recall, with high correlations in most macronutrients and some micronutrients. Future study should consider gathering data from the same participants at multiple occasions.
Keywords:
FFQ validation; 24-hour recalls; Correlation techniques; South-Indian adults
Introduction
Dietary assessment instruments collect and document accurate details of food consumption and nutrient intake among population groups, providing valuable information for understanding the relationships between food intake and diseases, especially chronic diseases [1,2]. Therefore, it is important that those instruments be tested and validated properly [3,4]. For the validation of instruments like Food Frequency Questionnaires (FFQs), biochemistry parameters and valid and well-accepted dietary methods must be used for comparisons, including 24-hour recalls [5].
Extensive documentation exists about the challenges of validating FFQs, including limitations in resources and in the constraints caused by the need to develop population-specific instruments. For example, instruments for dietary assessment must reflect the food supply and eating behaviors of the groups to which they are intended to be applied. However, the incorporation of all or most foods representing intakes of specific groups is challenging because of the extensive food supply and ample variety of food preparations, eating behaviors and cultural customs that are present in most societies. Furthermore, the challenges of collecting accurate dietary data limit the use of instruments like FFQs to only include a specific number of the local foods present in diets of population groups [6]. Another important consideration is that FFQs are hardly effective for measuring mixed foods and traditional or cultural foods, quite common among populations, such as those from India, with strong food-related traditions and cultural practices characterized using an extensive and rich variety of food dishes and eating customs.
Commonly, people measure the validity and reliability of the FFQ by comparing it to biomarkers or to dietary data obtaining with other dietary assessment techniques, such as a 24-hour recall, short screeners or food diaries [4,5]. Based on different studies and in the population groups with whom they are used or tested, there are a plethora of conclusions that could be drawn. In the J Vioque, et al. study, the team used biomarkers to examine the validity and reliability of the FFQ among Mediterranean pregnant women and their findings revealed that their FFQ instrument was an appropriate tool for measuring nutrient and food intake among pregnant women [7]. In testing an FFQ for assessing an individual nutrient, calcium, Magkos, et al. found that, although the FFQ worked well in population-based studies, it provided inaccurate details for measuring individual calcium intakes [8].
In India, dietary assessment has traditionally been focusing on the use of the 24-hour recalls methodology for population studies [2,9]. Although some important efforts had been made for developing and validating FFQ in India [10], availability of FFQs is limited for extensive use with different Indian population groups. In addition, because the magnitude and diversity of the Indian population, those instruments need to be specific and appropriated for the population targeted for specific evaluations and interventions. For example, such is the case of the lack of validated instruments to be applied to adult South Indians from urban, semi-urban and rural settings from the state of Tamil Nadu.
Furthermore, it is important to mention that there are some studies from India examining the validity of FFQ instruments, mostly comparing them with multiple 24-hour recalls. In all these studies, the researchers used multiple 24-hour recalls against FFQs, and, although only a few of those studies looked at the same subjects, they found that the FFQ performed as a good measurement for most nutrient intakes [2,11-13]. The limitation of all these studies was their relatively small sample sizes plus, as already mentioned, the large numbers of dietary patterns and food variety that characterize the multi-ethnic and cultural groups that comprise the Indian population, which limits the potential to use them in other Indian population groups.
With the validation study we report here, our objectives included the development of a semi-quantitative FFQ valid and reliable for estimating nutrient intakes of urban, semi-urban and rural adult population groups from the state of Tamil Nadu, South India. For large population groups like the one we targeted in the study reported here, the 24-hour recall method was identified as an effective comparison tool, as done in other validation studies [14-17]. Therefore, we based our validation study in a comparative analysis of data collected with both methodologies: FFQs and 24-hour recalls.
Methods
Population setting
As indicated before, the study was conducted in the Indian State of Tamil Nadu. Specifically, it included study participants from the city of Chennai and from the semi-urban and rural districts of Thiruvallur and Kanchipuram.
The population group used in this validation study came from the Population Study of Urban, Rural and Semi-Urban regions for the detection of Endovascular Disease and Prevalence of Risk Factors and Holistic Intervention Study (PURSE-HIS). Applying a 2-stage cluster sampling design, a total of 8,080 (urban: 2,221; semi-urban: 2,821; rural: 3,038) participants, both sexes (56% women, 44% men), and with 20 or more years of age were recruited. All subjects approved and signed an informed consent form. This study obtained IRB approval from the Tufts University Review Board. Additional details were already included in a previous publication [18].
Dietary data collection
A semi-quantitative food frequency questionnaire, based on information collected previously from other dietary studies and clinical work from trained nutritionists from the PURSE-HIS team, was developed and calibrated. It was then applied to the cohort.
Dietary intakes of the same PURSE-HIS cohort were also collected with a single 24-hour recall, administered by the same team of nutritionists, applying the multiple pass technique, based on the methodologies developed for the US national dietary surveys [19]. Collecting the 24-hr recalls, special attention was dedicated to the careful collection and description of recipes of traditional dishes, mixed dishes, and local foods. Also, all foods were measured or weighed as needed, using standard measuring utensils, such as measuring spoons, cups and ladles. From details obtained from both, the recalls and the FFQ, many recipes for prepared or mixed foods and beverages were developed and standardized by the expert Indian nutrition group working on this study. For the validation of the FFQ, the data collected with the 24-hour recalls was considered as the reference or standard to compare the performance of the FFQ.
For the food and nutrient analysis of the data collected with both methodologies (FFQs and recalls), a comprehensive nutrient database was developed, based on details from the Food Composition Table (FCT) of the Indian Council of Medical Research [20]. The nutrient database, version 24 from the United States Department of Agriculture was used for reported used foods not available in the Indian FCT [21].
Statistical analysis
For descriptive statistics, demographics, selected anthropometrical and biological measurements were summarized. Means and standard deviations of dietary energy as well as macro- and micronutrients collected using the recall and FFQ were estimated and tabulated. All the above analyses were conducted for the overall sample as well as stratified by sex. Stata 15 software (Stata Corp. 2017. College Station, TX, US) was used for the analysis.
To assess the agreement between the two dietary methods, we used three types of correlation tests: Pearson correlation, Spearman’s correlation, and Lin’s concordance correlation. We first ran the correlations between the nutritional data collected from the two instruments: the Pearson coefficient quantifies the linear covariation between two sets of measurements (e.g. those derived from the FFQs and the recalls), while the Spearman’s correlation, a nonparametric alternative, estimates the strength and association of the two ranked variables being assessed. However, two measurements can have a high Pearson or Spearman’s correlation coefficient while one of the measurements could have consistently under- or over-estimated, due to fixed bias. To take the actual numerical agreement into account, we also examined Lin’s concordance coefficient, which accounts for both covariation and correspondence. We applied this analysis scheme first to the original nutrients data, followed by energy-adjusted, logarithmic transformed data.
Results
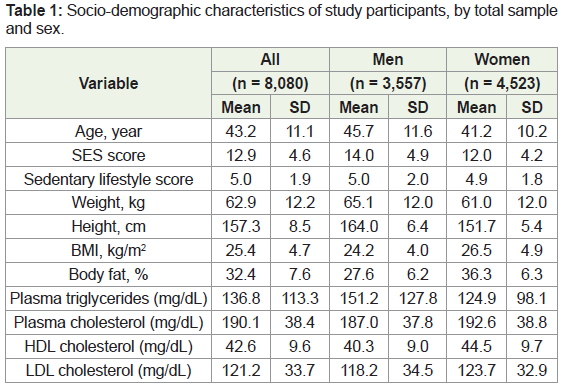
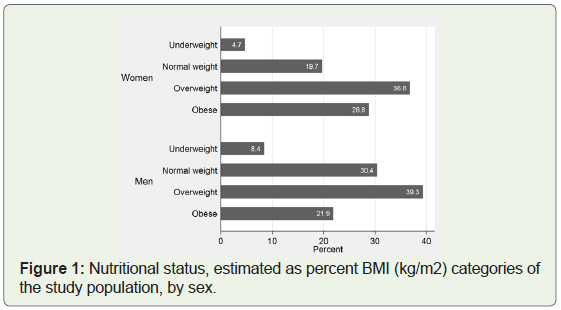
The mean age of the study population was 43.2 years, with men being, on average, 4.5 years older than women Table 1. Women, on average, also had a lower Socio-Economic score (12.0 ± 4.2) than men (14.0 ± 4.9). Additionally, women had a higher body fat percentage (36.3 ± 6.3%) as compared to men (27.6 ± 6.2%), as well as higher mean BMI than their men counterparts (26.5 vs. 24.2 kg/m2, respectively). Obesity was also more common in women (29%) than in men (22%) in this population as illustrated in Figure 1.
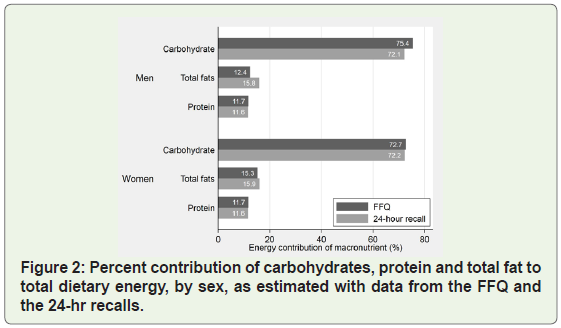
For the total sample, as well as for men and women, and with the data from the FFQ and recall datasets, we estimated the amounts of food consumption expressed in food energy and nutrients of interest, as described in Table 2. Energy intakes were significantly different when comparing the FFQ and 24hr recalls, for the total sample, as well as for each sex group. The energy values were higher when derived from the FFQ, as compared to the recall-based estimations. From Table 2, we also observed statistically different intakes of most micronutrients when comparing the data from FFQs and from recalls, by sex of study subjects. For men, the intakes of vitamins A and C, plus riboflavin, folate and iron collected by the two instruments were not statistically different. Among women, only thiamin and folate were not different when comparisons were done by dietary method of data collection. In addition, we also detected, among women, significant differences in the consumption (as total grams) of carbohydrates, proteins and fats, while for men, significant differences in the consumption of carbohydrates and fats (but not for protein) were detected as seen in Figure 2.
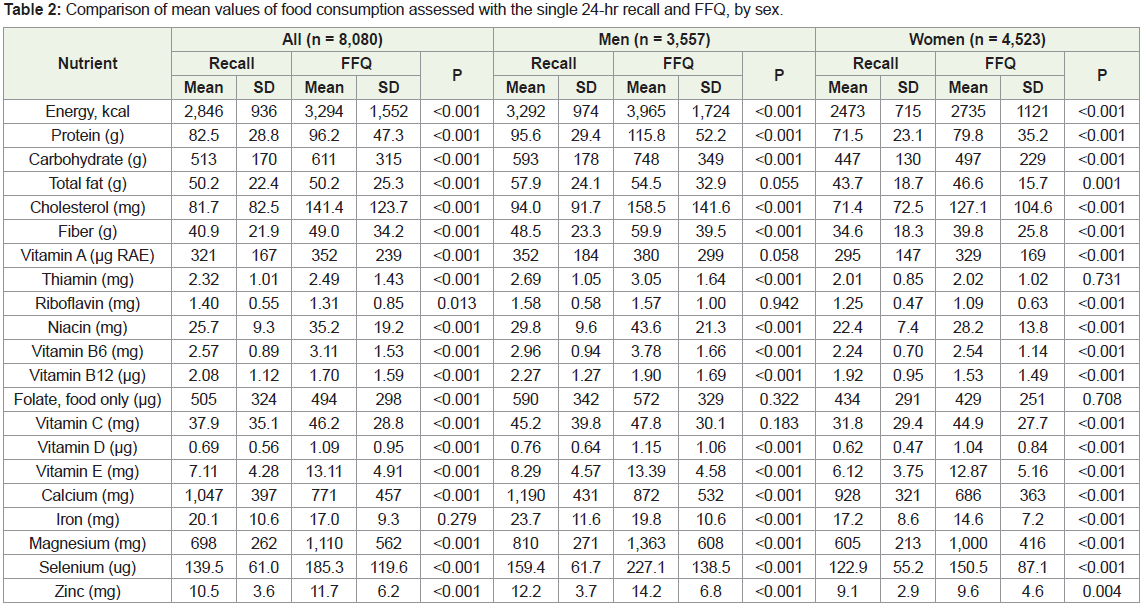
On average, the entire target population consumed, as average, 82 ± 83 mg of cholesterol as reported by the 24-hour recall, and 141 ± 124 mg when assessed by the FFQ, which values were statistically significant (p < 0.001). Men in our study population, on average, reported higher daily intake of cholesterol than women, as estimated with both dietary assessment methods. Fiber intake levels taken from the 24-hour recall and from the FFQ were significantly different when assessed by sex.
Correlation coefficients (Pearson, Spearman’s and Lin’s) of the nutrients (without and with energy adjustment) are presented in Table 3. The energy-adjusted and log-transformed data produced stronger correlation coefficients as compared to the unadjusted data in protein and carbohydrate, but not in total fat.
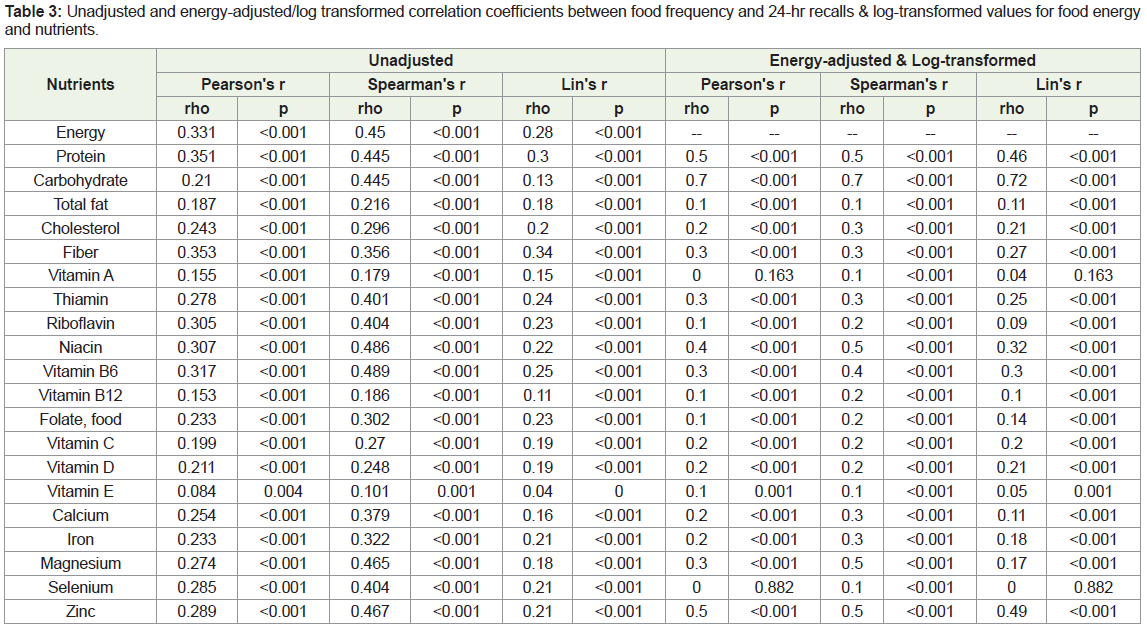
When the three sets of correlation coefficients were estimated with the energy-adjusted plus log-transformed Table 3, we observed statistically significant correlations for the macronutrients, fiber and cholesterol, as well as most micronutrients, except for vitamin A and selenium, which showed a non-significant Pearson’s and Lin’s rho coefficients. In terms of magnitude of the correlation, carbohydrate (rho = 0.721-0.734), zinc (0.490-0.544), protein (0.463-0.497), niacin (0.322-0.390) are ranked among the highest.
Discussion
As an essential tool for use in the field of nutrition epidemiology for measuring the relationship between diet and chronic disease, a culturally sensitive and correctly designed food frequency questionnaire is necessary for determining the accuracy of the question at hand [1]. Therefore, to obtain the most accurate and valid information on of the South Indian diet, we designed a semiquantitative FFQ for the longitudinal PURSE-HIS, which is following a large cohort of over eight thousand adults from urban, semi-urban and rural areas in the State of Tamil Nadu.
In this study, we found that, even with the restrictions of working with the complexities and variety of the usual dietary patterns of this population group, we found that the FFQ performed very well, with strong components and features. For example, as reported in other similar studies [1,2,6], we found that dietary energy intakes were higher when assessed with the recalls. It resulted interesting in observing that the differences in energy were not due to a specific macronutrient, but to relatively small variations occurring to all of them. All of this being aware that we only collected one recall per study subject, but with the power given to the large sample size we had.
We also observed that the Pearson and Spearman’s correlations, with the data adjusted by energy and log-transformed, indicated that most nutrients (e.g. protein, carbohydrates, fiber, cholesterol, vitamin A and selenium) were positively correlated, suggesting that our FFQ is a reliable instrument for capturing intakes of those nutrients. As reported by other studies [22], we interpreted that coefficients above 0.40 are indicative that the FFQ has a good validity value as compared to the reference method.
From our results, we noticed that for most nutrients, the correlation coefficients were lower than those reported by other researchers [13,14,16,23]. However, those results seemed to be in a similar direction (higher values from the FFQs) than those reported in the literature [16]. Additionally, some others studies, done with Indian population groups, also demonstrated a range of coefficients which appeared to be similar to our range [12,23].
The fact that we developed a very extensive nutrient database covering a large variety of mixed dishes which we used for the nutrient analysis of the recalls, but because the inherent characteristics of the FFQ (e.g. based on food lines comprising one or more similar foods), prevented us from introducing into the FFQ analysis all the details and intricacies that characterized the rich and large variety of dishes present in the eating patterns of South Indians. As seen in our results, this may have contributed to the weak correlation we observed, for example, with vitamin A, which presents ample differences in consumption based on the harvest periods.
There are some substantial strengths to our study. First, we have a large sample size, and we included free-living subjects aged 20 or older from urban, semi-urban and rural areas. Additionally, the development and incorporation of local recipes increased the validity of our reference method, which was the 24-hour recall. However, there were also several limitations to our study. First, we only collected a single FFQ and a single 24-hour recall per participant. As we know that a 24-hour recall is based on the diet from a single day, the results could potentially be very different from the usual, day-today diverse diets that usually form the eating practices of population groups. For validation studies as the one presented here, it is advisable to collect more than one recall. However, our large and population representative sample size, representing free-living adults, provided sufficient variability and power. Across such a large population, much of the variability introduced with a single 24-hrs recall will be attenuated by the size of the study population group [12,22].
In conclusion, the study suggests that this semi-quantitative FFQ is a useful method for assessing food and nutrient intakes of adults from Chennai and surrounding semi-urban and rural areas of the state of Tamil Nadu, South India.
Acknowledgments
The authors thank the extensive and intensive research work done by PURSE-HIS dietitians, interviewers and technicians who assisted in the data collection and processing.
We are extremely grateful and appreciative of the study volunteers and their families for the important participation in this study.
References
- Palacios C, Trak MA, Betancourt J, Joshipura K, Tucker KL (2015) Validation and reproducibility of a semi-quantitative FFQ as a measure of dietary intake in adults from Puerto Rico. Public Health Nutr 18: 2550-2558.
- Bowen L, Bharathi AV, Kinra S, Destavola B, Ness A, et al. (2012) Development and evaluation of a semi-quantitative food frequency questionnaire for use in urban and rural India. Asia Pac J Clin Nutr 21: 355-360.
- Subar AF, Thompson FE, Kipnis V, Midthune D, Hurwitz P, et al. (2001) Comparative Validation of the Block, Willett, and National Cancer Institute food frequency questionnaires: the eating at America’s Table study. Am J Epidemiol 154: 1089-1099.
- Cade J, Thompson R, Burley V, Warm D (2002) Development, validation and utilisation of food-frequency questionnaires - a review. Public Health Nutr 5: 567-587.
- Kroke A, Klipstein-Grobusch K, Voss S, Möseneder J, Thielecke F, et al. (1999) Validation of a self-administered food-frequency questionnaire administered in the European Prospective Investigation into Cancer and Nutrition (EPIC) Study: comparison of energy, protein, and macronutrient intakes estimated with the doubly labeled water, urinary nitrogen, and repeated 24-h dietary recall methods. Am J Clin Nutr 70: 439-447.
- Iqbal R, Ajayan K, Bharathi AV, Zhang X, Islam S, et al. (2009) Refinement and validation of an FFQ developed to estimate macro- and micronutrient intakes in a south Indian population. Public Health Nutr 12: 12-18.
- Vioque J, Navarrete-Muñoz EM, Gimenez-Monzó D, García-de-la-Hera M, Granado F, et al. (2013) Reproducibility and validity of a food frequency questionnaire among pregnant women in a Mediterranean area. Nutr J 12: 26.
- Magkos F, Manios Y, Babaroutsi E, Sidossis LS (2006) Development and validation of a food frequency questionnaire for assessing dietary calcium intake in the general population. Osteoporos Int 17: 304-312.
- Ravi S, Bermudez OI, Harivanzan V, Kenneth Chui KH, Vasudevan P, et al. (2016) Sodium intake, blood pressure, and dietary sources of sodium in an adult South Indian population. Ann Glob Health 82: 234-242.
- Hebert JR, Gupta PC, Bhonsle RB, Murti PR, Mehta H, et al. (1998) Development and testing of a quantitative food frequency questionnaire for use in Kerala, India. Public Health Nutr 1: 123-130.
- Sudha V, Radhika G, Sathya RM, Ganesan A, Mohan V (2006) Reproducibility and validity of an interviewer-administered semi-quantitative food frequency questionnaire to assess dietary intake of urban adults in southern India. Int J Food Sci Nutr 57: 481-493.
- Mahajan R, Malik M, Bharathi AV, Lakshmi PV, Patro BK, et al. (2013) Reproducibility and validity of a quantitative food frequency questionnaire in an urban and rural area of northern India. Natl Med J India 26: 266-272.
- Shaikh NI, Frediani JK, Ramakrishnan U, Patil SS, Yount KM, et al. (2017) Development and evaluation of a Nutrition Transition-FFQ for adolescents in South India. Public Health Nutr 20: 1162-1172.
- Tayyem RF, Abu-Mweis SS, Bawadi HA, Agraib L, Bani-Hani K (2014) Validation of a food frequency questionnaire to assess macronutrient and micronutrient intake among Jordanians. J Acad Nutr Diet 114: 1046-1052.
- Silva-Jaramillo KM, Neutzling MB, Drehmer M (2015) FFQ for the adult population of the capital of Ecuador (FFQ-Quito): development, reliability and validity. Public Health Nutr 18: 2540-2549.
- Thompson FE, Kipnis V, Midthune D, Freedman LS, Carroll RJ, et al. (2008) Performance of a food-frequency questionnaire in the US NIH-AARP (National Institutes of Health-American Association of Retired Persons) Diet and Health Study. Public Health Nutr 11: 183-195.
- Haftenberger M, Heuer T, Heidemann C, Kube F, Krems C, et al. (2010) Relative validation of a food frequency questionnaire for national health and nutrition monitoring. Nutr J 9: 36.
- Thanikachalam S, Harivanzan V, Mahadevan MV, Murthy JS, Anbarasi C, et al. (2015) Population study of urban, rural, and semiurban regions for the detection of endovascular disease and prevalence of risk factors and holistic intervention study: rationale, study design, and baseline characteristics of PURSE-HIS. Glob Heart 10: 281-289.
- Ahluwalia N, Dwyer J, Terry A, Moshfegh A, Johnson C (2016) Update on NHANES dietary data: Focus on collection, release, analytical considerations, and uses to inform public policy. Adv Nutr 7: 121-134.
- Gopalan C, Rama Sastri BV, Balasubramanian S (1971) Nutritive value of Indian foods. National Institute of Nutrition, Indian Council of Medical Research, Hyderabad-7 pp: 204.
- US Department of Agriculture, Agricultural Research Service, and N.D. Laboratory. USDA National Nutrient Database for Standard Reference, Release 24 pp: 1-27.
- Samaras K, Kelly PJ, Chiano MN, Arden N, Spector TD, et al. (1998) Genes versus environment. The relationship between dietary fat and total and central abdominal fat. Diabetes Care 21: 2069-2076.
- Sevak L, Mangtani P, McCormack V, Bhakta D, Kassam-Khamis T, et al. (2004) Validation of a food frequency questionnaire to assess macro- and micro-nutrient intake among South Asians in the United Kingdom. Eur J Nutr 43: 160-168.