Research Article
Emerging Trend of Dietary Patterns as a Risk Factor of Cardiovascular Disease in Urban Chennai Women
Varalakshmi RS*
Ethiraj College for Women, Madras School of Economics, India
Corresponding author: Varalakshmi RS, Ethiraj College for Women, Madras School of Economics Chennai, India, E-mail:varalakshmirajam.s@gmail.com
Citation: Varalakshmi RS. Emerging Trend of Dietary Patterns as a Risk Factor of Cardiovascular Disease in Urban Chennai Women. Indian J Nutri. 2018;5(1): 182.
Copyright © 2018 Varalakshmi RS. This is an open access article distributed under the Creative Commons Attribution License, which permits unrestricted use, distribution, and reproduction in any medium, provided the original work is properly cited.
Indian Journal of Nutrition | ISSN: 2395-2326 | Volume: 5, Issue: 1
Submission: 06/02/2018; Accepted: 02/03/2018; Published: 06/03/2018
Abstract
The present study was carried out to study the nutrient intake and anthropometric measures of two different ethnic community women. 365 women in the age group of 30-45 years belonging to two different socio-cultural groups namely Tamil speaking or any of the other South Indian languages and those from Rajasthan primarily from the Marwari community and three different socio-economic groups of high, middle and low-income groups residing in Chennai were selected as samples for the study. Diet patterns of the subjects were assessed from the responses elucidated from the questionnaire including the meal patterns, snacking frequency, dining out frequency. Food Frequency Questionnaire (FFQ) was employed to ascertain the dietary diversity among the various food groups. 24hour dietary recall method was adopted to assess the nutrient intake on a week day and a weekend day using standardized cups and measures. Dietcal software was employed to calculate the nutrient intake of the subjects. Dietary diversity scores were obtained by computations from food frequency questionnaire using a probit regression model. Nutrient intakes were analyzed in terms of energy intake and macro nutrient intake and their share towards the energy intake was calculated and the risk factor towards the development of cardio vascular disease was analyzed. The average protein intake was found to be higher among the non-vegetarian population (98.83 + 7.82) of South Indian women followed by the middle-income group (81.10 + 5.89) of West Indian women. Mean Anthropometric measures of the subjects projected a risk towards higher Body mass index, Waist to Hip ratio (>= 0.8) and Waist to Height Ratio (>= 0.5).
Keywords:
Nutrient intake; Anthropometry; Dietary diversity
Introduction
Diet is multidimensional and is influenced by biological, psychological, social and cultural factors. Asian Indians have considerably higher prevalence of premature coronary Heart disease compared with Westerners. Within the Indian sub-continent, a dramatic increase in the prevalence of heart disease has been predicted as it could be seen from the results of the global burden of diseases study which projected that by 2020 there would be a 111% increase in cardiovascular deaths in India. This increase is much more than 77% for China, 106% for other Asian countries and 15% for economically developed countries.
These projections are made keeping in view that Indians differ in their diet, physical activity, body weight and life style changes consequent to affluence and cultural changes consequent to migration. “Risk” is defined as a probability of an adverse health outcome whereas “risk factor” refers to an attribute or characteristic or exposure of an individual whose presence or absence raises the probability of an adverse outcome [1]. Studies on the prevalence and risk factors like excessive weight gain, body mass index which is an indicator of the gradation of body weight in terms of overweight, obesity, hip circumference, waist circumference and their ratio, diet, sedentary life style which are identified as perpetuators of cardiovascular disease in native Indians are therefore urgently needed.
In one of the studies carried out in Jaipur the researchers have highlighted the persistent high prevalence of cardiovascular risk factors in the urban middle class in Jaipur, North Western part of India [2]. The authors have compared the risk factors with studies performed in similar locations in years 2002 to 2006. While the risk factors like smoking, obesity which can be assessed by anthropometry, hypertension and diabetes remain unchanged there is a clear trend of increasing levels of non-HDL cholesterol and triglycerides over the 8 year period which is a consequence of nutrition shift towards calorie dense foods. In another study reported from Southern part of the country (Guntur district in Andhra Pradesh) high prevalence of cardiovascular disease was associated with high levels of LDL cholesterol and triglycerides and impaired glucose tolerance which are the predictors of poor diet quality, sedentary life style and abnormal body mass index [3]. The findings in both the studies contrive towards a nutritional transition with the global availability of relatively cheap vegetable oils and fats and increasing buying power of the middle class income families in India. These studies indicate that socio economic factors also contribute their share towards the diversified dietary pattern.
Cardiovascular disease is a major contributor to female mortality in India [4]. Women have higher mortality rates relating to cardiovascular disease than men in India because of differential access to health care between the sexes. One reason for the differing rates of access stems from social and cultural norms that prevent women from accessing appropriate care [5]. According to National Family Health Survey (NFHS) the percentage of ever married women aged 15-49 years who are overweight or obese increased from 11% in NFHS -2 to 15% in NFHS-3. A latest survey mapping the trends of cardiovascular diseases in south India has revealed that there is an alarming 10-15% rise in Cardiovascular Disease (CVD) among young women. A substantial 81% of the doctors surveyed felt that women are less proactive about getting diagnosis and treatment done compared to men and many doctors felt women choose to ignore symptoms of heart disease.
The Chennai Urban Population Study (CUPS) carried out in 2001 in two residential areas of Urban Chennai (N = 1399 aged >= 20 years) affirmed that the prevalence rate of cardiovascular disease is around 11percent and increased in people coupled with complications like diabetes mellitus [6]. Lifestyle changes and uncontrolled risk factors are considered to be the foremost etiological factors towards the contribution of this trend.
Only very few studies have examined dietary patterns in terms of nutrient intake and anthropometric measures in relation to cardiovascular risk factors in Asian populations, particularly among women in India. The present study was undertaken to explore dietary patterns and anthropometric measures in West Indian Marwari women and South Indian women in Urban Chennai and their association with cardiovascular risk factors. A growing body of scientific evidence indicates that wholesome vegetarian diets offer distinct advantages compared to diets containing meat and other foods of animal origin [7]. Since vegetarians consume widely divergent diets, a differentiation between various types of vegetarian diets is necessary. Well-balanced vegetarian diets are appropriate for all stages of the life cycle, including children, adolescents, pregnant and lactating women, the elderly and competitive athletes. In most cases, vegetarian diets are beneficial in the prevention and treatment of certain diseases, such as cardiovascular disease, hypertension, diabetes, cancer, osteoporosis, renal disease and dementia, as well as diverticular disease, gallstones and rheumatoid arthritis. The reasons for choosing a vegetarian diet often go beyond health and well-being and include among others economical, ecological and social concerns.
Recently, vegetarian diets have experienced an increase in popularity. A vegetarian diet is associated with many health benefits because of its higher content of fiber, folic acid, vitamins C and E, potassium, magnesium, and many phytochemicals and a fat content that is more unsaturated. Compared with other vegetarian diets, vegan diets tend to contain less saturated fat and cholesterol and more dietary fiber.
In India the largest incidence of cardiovascular disease is found in people aged 40-49 years, and the number of people affected by cardiovascular diseases is expected to rise among women as well research has shown that there are differences between women and men in the epidemiology, clinical presentation, and outcomes of CVD [8]. However, most of the research in CVD is still conducted with men and comparatively few studies are done with minorities and with women. This study is an attempt to add to the limited evidence of CVD risk factors among women in the lower age group of 30-45 years in urban Chennai.
The samples for the present study were a mixed population of Marwaris who practiced strict vegetarianism and Tamils who practiced a mix of vegetarianism and non-vegetarianism. Tamils are not strict vegetarians and non-vegetarian dietary pattern is also followed by them. Tamil non-vegetarian pattern has a cereal preparation as a main course with fish, poultry or meat dish as an accompaniment, in addition to vegetables, dal/pulse Chennai is the capital city of Indian state of Tamil Nadu. According to the 2011 census, the city had 4.68 million residents, making it the sixth most populous city in India. The city is host to the third largest expatriate population in India after Mumbai and Delhi with 35,000 in 2009 and steadily climbing to 82790 in 2011. The majority of the population in Chennai are Tamils. Chennai along with Mumbai, Delhi and Kolkata is one of a few Indian cities which is home to a diverse population of ethno-religious communities. According to the 2001 census Hindus constitute about 81.3% of the city’s population and Muslims (9.4%) Christians (7.6%) and Jains (1.1%) are other major religious groups.
Indian Marwaris from Northern India (mainly from Gujarat and Rajasthan) mostly money lenders and businessmen have settled in and around Sowcarpet during the 1960’s. Jainism is the religion followed by this group of people whose population is expected to be 2,00,000 in Chennai. Jain vegetarian diet is followed by the followers of Jain culture and philosophy. The Jain cuisine is completely vegetarian and also excludes onion and garlic. For Jains lacto vegetarianism is mandatory. Strict Jains do not consume food that has been stored overnight as it possesses a higher concentration of micro-organisms as compared to food prepared and consumed the same day. Hence, they do not consume yogurt or dhokla and idli batter unless they have been freshly set on the same day. It is interesting to note that a mixed diet pattern and diversified cultural, socio economic strata tend to influence the dietary transition of the study subjects there by predisposing them to the risk of developing cardiovascular disease.
Materials and Methods
Women in the age group of 30-45 years belonging to two different linguistic groups - predominantly Tamil speaking or any of the other South Indian languages (South Indian or SI, henceforth) and those from Rajasthan primarily from the Marwari community (West Indian or WI, henceforth) residing in Chennai were selected as samples for the study. Apart from language, a major difference between these two communities is that the latter group follows a purely vegetarian diet while the other group also has preferences for non-vegetarian diet. Among the sample of 165 WI women, 15 belong to high income group households the remaining are from middle income group who reside largely in North Chennai. 30 women of high income group, 90 women of middle income group and 80 women of low income group are from SI and living in South Chennai were a part of the study. Thus, women from different socio economic groups from both the Marwari and Tamil speaking communities were administered the data collection tools to elicit information. Purposive random sampling was adopted for the study. Permission was obtained from the subjects to participate in the study. The subjects were selected at random based on their willingness to be a part of the study and a pre-tested questionnaire was administered to them and the data were obtained. The survey was conducted from October 2014 to April 2015.
Diet patterns of the subjects were assessed from the responses elucidated from the questionnaire including the meal patterns, snacking frequency, dining out frequency. Food Frequency Questionnaire (FFQ) was used to ascertain the dietary diversity among the various food groups based on the consumption frequency as daily, once a week, twice a week, thrice a week or never. 24 hour dietary recall method was adopted to assess the nutrient intake on a week day and a weekend day using standardized cups and measures. Dietcal software was employed to calculate the nutrients of the daily intake of the subjects. Anthropometric parameters studied included height, weight, Body Mass Index (BMI), Waist Circumference (WC), Hip Circumference (HC), Waist to Hip Ratio (WHR), Waist to Height Ratio (WHtR). A flexible non stretchable inch tape was used to measure height to the nearest centimeter. The weight of the subjects was assessed using bathroom scales. The weight was measured to the nearest 0.25 kilogram. BMI was computed as weight in kilograms divided by square of height in meters. Waist circumference was obtained by measuring at the midpoint between the lower margin of the last palpable rib and top of the iliac crest using a stretch resistant tape. A flexible inch tape was used to measure the hip circumference of the women around the widest portion of the buttocks with the tape parallel to the floor. Waist to Hip ratio of women was calculated as waist circumference divided by Hip circumference both in centimeters. Waist to height Ratio was is obtained by dividing the waist circumference divided by their height, both measured in the same units.
Results
Table 1 shows the food variety score of the subjects deduced from the food frequency questionnaire where the subjects responded based on the consumption of foods under the various food groups. Variety in the diet enhances the overall consumption of the food. It can be inferred from the table that the middle income groups seem to have a lower variety in their scores. This result seems to corroborate with the findings based on the first anthropometric component which could be due to the higher anthropometric cut points that are getting reflected due to lower dietary diversity.
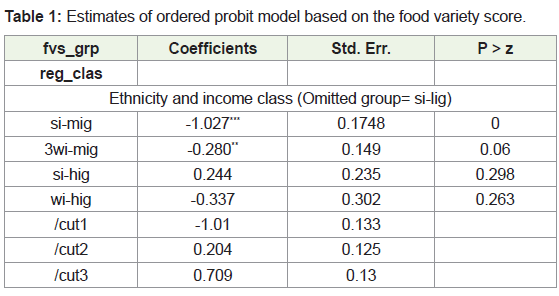
Std. Err: Standard Error; Statistical significance of the respective coefficient: ***-1 %, **- 5% *-10%; Si-lig: South Indian low Income Group; si-mig: South Indian Middle Income Group; si-hig: South Indian High Income Group; wi-mig: West Indian Middle Income Group; wi-hig: West Indian High Income Group
Table 2 shows the mean and standard deviation of anthropometric parameters which were assessed in terms of measures mentioned above. Mean BMI was found to be higher among the high income group subjects of SI and WI, while the other income group subjects were also in the overweight category according to the Asia Pacific Guidelines for South Asians normal weight [BMI = 18.5-22.9 kg/m2], overweight [BMI = 23-24.9 kg/m2] and obese (BMI > 25 kg/mm2). Mean WHR was also above the normal value of 0.80 in the high income groups of both the SI and WI women.
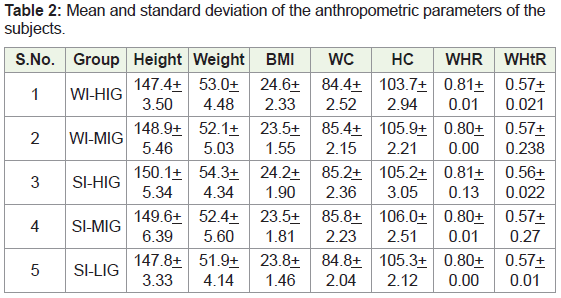
Notes: WI: West Indian; SI- South India; HIG: High Income Group; MIG: Middle Income Group; LIG: Low Income Group; BMI: Body Mass Index; WC: Waist Circumference; WHR: Waist to Hip Ratio; WHtR: Waist to Height Ratio
Table 3 shows the mean protein, fat and carbohydrate intake of the West Indian and south Indian Women. The average protein intake was found to be higher among the non-vegetarian population of South Indian women with 98.83 grams followed by the middle income group of West Indian women with 81.1grams. It clearly shows the variety of non vegetarian foods which contribute to high protein content in the diet of low income group south Indian women. Carbohydrate intake also shows a similar trend with the high intake in the diets of West Indian women (353.47 grams) and South Indian women (300.96 grams). No distinct patterns of fat intake emerged between the higher and middle income groups of the West Indian women whereas there was a slight higher intake of fat with the middle income group of South Indian women compared to the higher income group of South Indian women. Energy intake of the subjects revealed their higher uptake because of increased intake of macronutrients.
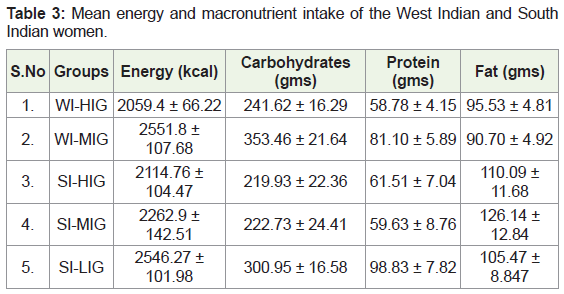
Notes: NI: West Indian; SI: South Indian; HIG: High Income Group; MIG: middle income group; LIG: Low Income Group
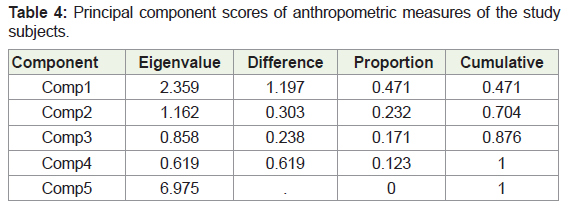
Table 4 shows the eigenvalues associated with the components with the first eigenvalue as 2.36, second as 1.16 and the third as 0.85. The first component explains 47.2 percent of variation in anthropometric measures while the second and third cumulatively explain 70.4 and 87.6 percent of cumulative variation. The components 2 and 3 respectively. Consequently, we focus on first three principal components for further analysis. Table 5 shows the overall loadings of the anthropometric measures in terms of body mass index, waist circumference, hip circumference, waist to height ratio and waist to hip ratio of the study subjects. The first component has the positive loadings of all the variables. It can be interpreted as the overall generalized fat accumulation sites extremely unique for Indians and it strongly correlates strongly with increasing cardiovascular risk factors. The second principal component has positive loadings for other anthropometric measures excluding the waist and hip circumferences which are represented by negative loadings. Thus, the second principle distinguishes the android and the gynoid patterns of fat distribution of the subjects. The third principal component gives negative loadings for waist circumference and waist circumference to height ratio and positive to all others as the study population is shorter in stature and it has been found that in Japanese population. WHtR was found to be a better predictor of metabolic risk as compared to other anthropometric indices as women tend to show fat accumulation pattern mainly in the hip region.
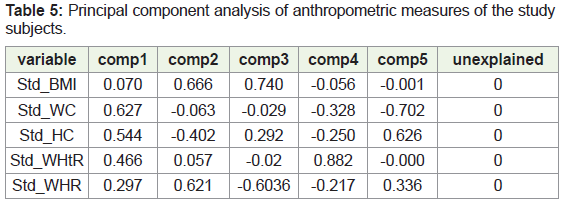
BMI: Body Mass Index; WC: Waist Circumference; HC: Hip Circumference; WHtR: Waist Circumference to Height Ratio; WHR: Waist To Hip Ratio
Table 6 shows the order probit model estimates of carbohydrate and fat share towards calorie intake the results indicate that the calorie share comes from fat predominantly among the various income groups as I gram of fat yields 9 kilo calories. As the carbohydrate and fat intake of the individual increases the anthropometric measures exhibit a positive loading for all the parameters including weight, waist and hip circumferences, waist to hip ratio and waist to height ratio.
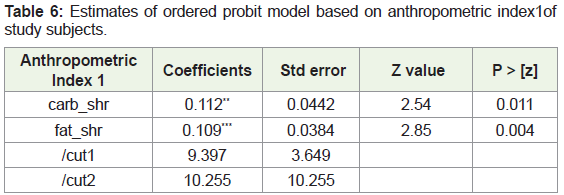
Std. Err: Standard Error; Statistical significance of the respective coefficient: ***-1%, **- 5% *-10%; carb_shr: Carbohydrate Share; fat_shr: Fat Share
Table 7 shows the order probit model estimates of carbohydrate and fat share towards calorie intake the results indicate that the increase of waist and hip circumferences as indicated by the second anthropometry component calorie share comes from carbohydrate predominantly among the various income groups as I gram of carbohydrate yields 4 kilo calories. As the carbohydrate intake of the individual increases the anthropometric measures around the abdominal region exhibit a positive loading for all parameters of android and gynoid pattern of weight gain among the women.
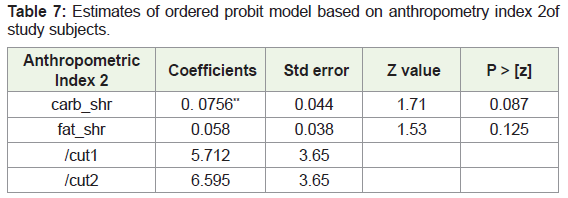
Std. Err: Standard Error; Statistical significance of the respective coefficient: ***-1%, **- 5% *-10%; carb_shr: Carbohydrate Share; fat_shr: Fat Share
Table 8 shows the order probit model estimates of carbohydrate and fat share towards calorie intake. The results indicate that the increase of waist circumference and waist to height ratio as indicated by the third anthropometry component are increased due to increased carbohydrate and fat intake as a significant relationship at one percent level is been exhibited. Recent studied indicate that people have become conscious about fat intake and take liberal amount of carbohydrates which is responsible for other metabolic disorders other than diabetes mellitus.
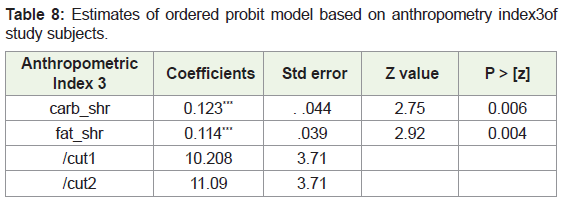
Std. Err: Standard Error; Statistical significance of the respective coefficient: ***-1%, **- 5% *-10%; carb_shr: Carbohydrate Share; fat_shr: Fat Share
Discussion
Use of oil or fat mainly as a topping especially in the saturated form leads to an increased intake of fats. Results similar to the outcomes of the present study could be seen in an ethnicity and religion bound study in Vadodara in 2011 where a research was conducted to assess the nutritional status of upper-middle class Gujarati Jain adults (30-55 years) following strict religious discipline for diet and risk factors for NCDs [9]. Information was collected on dietary intake, food frequency questionnaire, anthropometric measurements, physical activity pattern, disease condition and biochemical indices. Percentage of subjects having NCD risk factors and the odds ratios were calculated. The dietary data revealed that overall fat consumption ranged from 202-214%. It was concluded that sedentary lifestyle and dietary imbalances make this community prone to cardiovascular disease related risks.
In a study conducted to assess the dietary intake of Urban adults in Urban Southern India similar trends in the intake of fats (56.4 grams) like excess intake more than the RDA and carbohydrates (356 grams) pertaining to the present study were observed [10]. High fat intake (40 percent of energy intake) has been observed in Delhi and Mumbai which indicated that the components of the Indian diet may be contributing to a high-risk diet and health profile. In this study a similar approach has been attempted to study the energy intake of the subjects in Urban Chennai women.
An increase in calorie intake with limited physical activity patterns shows a positive energy balance of the subjects and this is evident in the anthropometric measures of the subjects. British Nutrition Foundation states that in order for people to maintain their body weight, their energy intake must equal their energy expenditure. Failure to maintain energy balance will result in weight change. Energy balance can be maintained by regulating energy intake (through the diet), energy expenditure (adjusting physical activity level to match intake) or a combination of both. Failure to compensate for an increase in energy intake with an increase in expenditure will result in weight gain (positive energy balance). From the projections of the figure it is clear that all the subjects were in positive energy balance.
Conclusion
The study was carried out with an objective to study the diversified dietary patterns and nutrient intake of the study population. Results based on the anthropometry parameters which are discussed partially in this paper and the remaining results discussed as a part of another paper also highlighted that almost eighty five percent of the subjects fall under the overweight category. Food variety scores indicated that dietary diversification is not found in all the ethnic groups. Anthropometric components categorized into three principle indices showed a vivid significance at 1 percent and five percent level of carbohydrate and fat share of the calories towards the different anthropometric parameters. Higher calorie intake, increased carbohydrate and fat intake showed an inclination towards higher anthropometric indices of Body mass index, Waist to Hip ratio, Waist to Hip Ratio which poses risk factors towards the development of cardiovascular diseases at a younger age.
Acknowledgement
I would like to thank my supervisor Dr. Brinda Viswanathan and the doctoral committee members Dr. Malathi Duraiswamy and Dr. K. R. Shanmugam for their useful comments and suggestions during the course of this study.
References
- WHO (2005) Preventing Chronic Diseases: A Vital Investment.
- Gupta R, Guptha S, Sharma KK, Gupta A, Deedwania P (2012) Regional variations in cardiovascular risk factors in India: India heart watch. World J Cardiol 4: 112-120.
- Murthy PD, Prasad KT, Gopal PV, Rao KV, Rao RM (2012) A survey for prevalence of coronary artery disease and its risk factors in an urban population in Andhra Pradesh. J Assoc Physicians India 60: 17-20.
- Celermajer DS, Chow CK, Marijon E, Anstey NM, Woo KS (2012) Cardiovascular disease in the developing world: prevalence, patterns, and the potential of early disease detection. J Am Coll Cardiol 60: 1207-1216.
- Ramakrishnan S, Khera R, Jain S, Saxena A, Kailash S, et al. (2011) Gender differences in the utilisation of surgery for congenital heart disease in India. Heart 97: 1920-1925.
- Mohan V, Deepa R, Rani SS, Premalatha G (2001) Prevalence of coronary artery disease and its relationship to lipids in a selected population in South India: The Chennai Urban Population Study (CUPS No. 5). J Am Coll Cardiol 38: 682-687.
- Craig WJ (2009) Health effects of vegan diets. Am J Clin Nutr 89: S1627-S1633.
- DeVon HA, Zerwic JJ (2004) Differences in the symptoms associated with unstable angina and myocardial infarction. Prog Cardiovasc Nurs 19: 6-11.
- Nambiar VS (2011) Nutritional status assessment of middle-aged Gujarati Jains and risk factor analysis for Non-communicable diseases. IJPI’s Journal of Hospital and Clinical Pharmacy 5: 1-13.
- Sudha V, Radhika G, Sathya RM, Ganesan A, Mohan V (2006) Reproducibility and validity of an interviewer- administered semi-quantitative food frequency questionnaire to assess dietary intake of urban adults in Southern India. Int J Food Sci Nutr 57: 481-493.