Research Article
A Study on Prevalence of Abdominal Obesity among Diabetics
Aparna Nagendra1*, Premila Chekri1 and Swarupa Kakani2
1Department of Nutrition & Dietetics, NU Hospitals, India
2Department of Nutrition & Dietetics, Sagar Hospitals, India
Corresponding author: Aparna Nagendra, Senior Dietitian, #34/41, 15th Main, Padmanabhanagar, Bangalore-60070, Tel: +91-9845024828; E-mail: appu31@gmail.com
Citation: Nagendra A, Chekri P, Swarupa K. A Study on Prevalence of Abdominal Obesity among Diabetics. Indian J Nutri. 2017;4(5): 175
Copyright © 2017 Nagendra A, et al. This is an open access article distributed under the Creative Commons Attribution License, which permits unrestricted use, distribution, and reproduction in any medium, provided the original work is properly cited.
Indian Journal of Nutrition | ISSN: 2395-2326 | Volume: 4, Issue: 5
Submission: 25/10/2017; Accepted: 15/11/2017; Published: 17/11/2017
Abstract
Rapid globalization and industrialization occurring in developing countries has resulted in considerable increase in lifestyle related diseases. The Indian population is passing through a transition phase where subsistence conditions are being replaced by plentiful food but reduced physical work and therefore, an understanding of the changing nutritional scene is critical. India leads the world with largest number of diabetic and being termed the “diabetes capital of the world”. World Health Organization (WHO) has described obesity as one of today’s most neglected public health problems, affecting every region of the globe and chronic stress, combined with positive energy balance, may be a contributor to the increased risk for obesity, especially upper body obesity. This association may be mediated by alterations in the Hypothalamic-Pituitary-Adrenal axis (HPA). The fundamental basis of the association between obesity and diabetes mellitus is a subject under intense scrutiny. Here we present the study conductedto know the prevalence of abdominal obesity among diabetic subjects. 60 diabetic subjects both men and women, between the ages 40-70 years admitted at Sagar Hospitals, Bangalore were selected as sample for the study. Somatic status, dietary pattern and stress scores of the subjects were assessed. Interview method was used in collecting the data effectively using a preformed questionnaire. Increase in Waist Circumference (WC) and Waist-Hip-Ratio (WHR) was observed indicating that abdominal obesity was prevalent among the diabetic subjects.The 24 hour dietary intake revealed that except for fat all the other nutrients were below the recommended dietary allowances (RDA).Stress scores increased with increasing age and WHR which could be attributed to stress and adaptation to the same over the years. High fat consumption, sedentary lifestyle and lack of exercise can be the major cause of abdominal obesity among these individuals with greater risk for the development of other chronic diseases.However; results were identified only from Sagar hospital with 60 diabetic subjects and results may be viewed in this light.
Keywords:
Abdominal obesity; Diabetes mellitus; Anthropometric measurements; Hypothalamic pituitary adrenal axis; Recommended dietary allowances; World health organization
Introduction
This has been a century of great revolution and change. In the 21st century, changes were noted not only in the science and technology but also in the life-style of people. Changes in the life-style made life easier and marked the beginning of certain chronic ailments such as obesity, cardiovascular disorders, endocrine disorders and osteoarthritis [1]. With high rates of prevalence and a steadily increasing demographic burden, diabetes has emerged as a major metabolic disease worldwide. The current prevalence of diabetes in India is 69.2 million and is expected to rise to 123.5 million (78.5% increase) by the year 2040, effectively rendering every fifth diabetic in the world to be an Indian [2,3]. The prevalence in Asia ranges from 1.2 % to 14.5% [4]. The number of people with diabetes is increasing due to population growth, aging, urbanization, increasing prevalence of obesity and physical inactivity [5]. Obesity has emerged as the most prevalent serious public health problem with central obesity being an independent risk factor for cardiovascular disease, particularly in women. In most developed and developing countries, the prevalence of obesity is increasing steadily, and has reached epidemic proportion. According to the WHO world health statistics report 2012, globally one in six adults are obese and nearly 2.8 million individuals die each year due to overweight or obesity. Due to the increased risk of morbidity and mortality, obesity is now being recognized as a disease in its own right [6]. The excess of fat in men tends to accumulate in the upper abdomen. In women, the favored sites for the accumulation of fat are the hips, thighs and buttocks. Obesity develops over time and once it develops, is difficult to treat [1].
“Stress” is a very frequently used word and tends to cover many things but while it may seem an over-used word, stress can be a very real problem and one that needs recognizing. Stress is the process by which any highly challenging, uncontrollable and overwhelming emotional or psychological event or series of events results in adaptive or maladaptive processes required to regain homeostasis and or stability. Similar to the effects of repeated and chronic stress on increasing addiction vulnerability, considerable evidence from population-based and clinical studies indicates a significant and positive association of high uncontrollable stressful events and chronic stress states with adiposity, Body Mass Index (BMI) and weight gain. Any danger or stress triggers the release of adrenaline and other hormones into the blood stream and it is these hormones that enable the body to defend itself. Breathing, the heart rate and blood pressure raises, pumps more blood to the muscles so that they are ready for action. This is when the blood sugars rise. If the stress is eliminated at this stage, then the body relaxes and goes back to normal [7].
The rising prevalence of these lifestyle disorders in India is of concern as singly or in combination, which act as major risk factor for coronary artery disease. Genetic susceptibility, environmental factors and sedentary lifestyle also have been implicated. Individuals with type 2 diabetes are particularly at risk of the adverse consequences of obesity & the interaction of both disorders with other components of the metabolic syndrome culminate in an increase in macro vascular, micro vascular complications & the associated reduction in quality of life [8-10]. he risk factors of today are stated to be the diseases of tomorrow. Therefore, identifying the risk factors in populations occupies a central place as lagged time exist between exposure and disease in any given individual / population [11]. Hence, the present study was aimed on the prevalence of abdominal obesity among diabetic subjects.
Methodology
Study design
Sample selection: The study was conducted in Sagar Hospitals Bangalore, Karnataka.60 diabetic subjects, 30 male and 30 female admitted in the hospital and belonged to both urban and rural areas were randomly selected for the study based on their willingness to participate and being available for collecting the data on study needs. Subjects were in the age group of 40-70 years, who also had other associated disorders like hypertension.
Somatic status: Anthropometric Measurements-Height (cm), Weight (kg), Waist Circumference (cm), Hip Circumference (HC) (cm), was measured using standardized techniques for all the subjects. Height was measured using a stature meter (No 26SM model), which has a precision of up to 0.1 cm. The stature meter was suspended 2m high from the floor against a straight wall. The individual was asked to stand upright without shoes with his/her back against the vertical wall, heels together and eyes directed forward. Height measurement as appeared in the read-off area was then recorded. Weight was recorded during the visit to the hospital with minimum clothing and without shoes using an adult weighing scale. A standard non elastic tape was used to measure the waist and hip circumferences and measured to the nearest 0.1cm. WC was taken horizontally at the midpoint between the lower margin of the last rib cage and the top of the iliac crest. HC was measured around the widest portion of the buttocks, using a measuring tape parallel to the floor [12]. BMI was calculated using the formula (weight in kg) / (height in m2).Weight status was then classified in accordance to cut off values for BMI given by WHO (1998) and Asia Pacific classification [13,14]. WHR was calculated as WC divided by HC [12].
Personal history: A detailed questionnaire was used to collect patient’s personal history. Dietary intake of all the subjects was assessed by interviewing them in detail. The data on the type of food consumed, food consumption frequency, and frequency consumption of junk foods, processed food or ready to eat food, sugar and salt were taken. They were asked to quantify the portion size of the food that they consumed to construct the individual subject’s 24 - hour dietary intake with the help of household standard measurements relevant to Indian cuisine models such as cups, katori, glass, table spoon and tea spoon which was shown to them. Food intake starting from early morning to bed time was enquired. Quantity of raw food items taken for preparation were then converted from the amount of cooked food items taken which was derived by standardizing the preparatory methods of different menu items consumed by the subjects. The nutrient intake was then derived by the amount of food items included in the diet using food composition tables.
Interpretation and analysis of data: Keeping the objectives in mind, the information collected was consolidated in terms of each subject and computed for the whole group using descriptive analysis. Food intake data was converted into raw amounts in terms of food groups and in turn was translated into energy and nutrients by calculations using Food composition tables (Gopalan et al. 2011). The nutrient intake of the subjects was computed against RDA for ensuring the appropriateness of intake derived based on (ICMR, 2010) for age, gender and activity [15]. The data was statistically analyzed using appropriate statistical tests of significance (t-tests and chi-square test) the results were then interpreted; appropriate conclusions were drawn and compared with the objectives and hypothesis.
Results
A questionnaire was designed based on the needs of the study and the same was used for collecting the data from the subjects-general information regarding age, qualification, occupation, marital status, family type and family income, anthropometric measurements, dietary intake, stress scores, sleep and activity pattern of the selected subjects adopting the direct personal interview method. Background information of the subjects, Table 1 presented an appraisal of marital status (95%) and majority 68% of the subjects belonged to nuclear family. An attempt was made to include equal number of subjects in each group 30 male and 30 female. The age distribution was highly skewed with 42% falling in the age group of 61-70 years.33 % of them were graduates and the percentage was higher among male. 87 % women were homemakers and 27% of them had their own business.
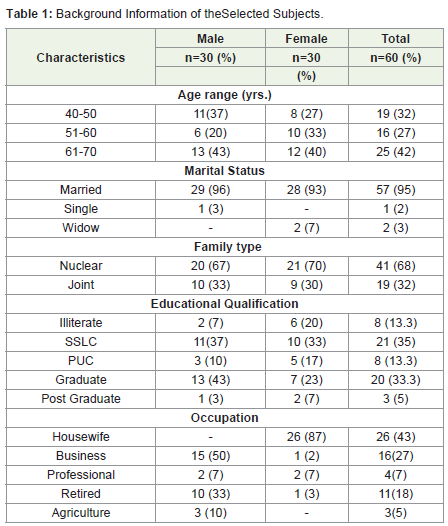
Table 1: Background Information of the Selected Subjects.
Somatic status of the subjects, Table 2 shows that mean height of the subjects irrespective of age group were similar among both male and female. Mean body weight was higher among male compared to female (70 kg ± 12 male; 64.5 kg ± 9.4 female). The body mass index was calculated using Quetelet index based on WHO classification. Mean BMI was found to be 26 kg/m2 ± 3.78 but 18% of the study group had BMI >30 kg/m2 indicating obesity and Figure 1A shows that majority 50% were overweight (WHO, 1998) (13) but according to Asia pacific WHO classification it was seen that 73% of the total subjects were obese and among female subjects 10% and 80% were overweight and obese respectively compared to male [13] (Figure 1B). WHR Table 3 showed that 87% male and 47% female had WHR >0.90 (Ref- M<0.90, F<0.80) [14]. A Comparison of WC and WHR with the standards Table 4 showed both male and female had mean WC greater than the normal, male: 92.4 cm±9.5; female: 90 cm±9.3 respectively (Ref:male: <90 cm, female: <80 cm) and mean WHR was 0.95±0.05 in male and 0.90±0.04 in female [14]. A significant difference was seen in comparison with the standards. This increased WHR is considered as an indicator of intra-abdominal fat as abdominal obesity is viewed as an adaptation to stress imposed by early or long term. An increased WC is most likely associated with elevated risk factors because of its relation with visceral fat accumulation and the mechanism may involve excess exposure of the liver to fatty acids, increase in the portal free fatty acid concentration leads to plasma disturbances. Thus, WC reflects total body fat and abdominal fat distribution [5]. An association between BMI and WHR presented in Table 5 showed a trend of increase in BMI and WHR as age increased and even with normal BMI, WHR >0.90 was observed, indicating abdominal obesity even with the normal BMI range.70% of the subjects combining all groups showed WHR >0.90. It is a clear indication that the WHR is showing an increasing trend among these subjects.
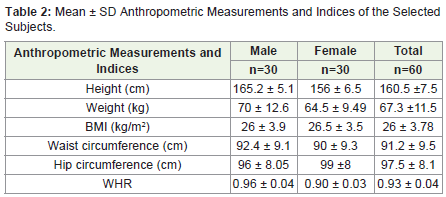
Table 2: Mean ± SD Anthropometric Measurements and Indices of the Selected Subjects.
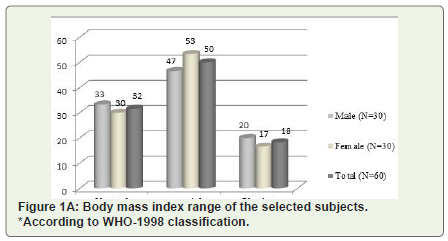
Figure 1A: Body mass index range of the selected subjects. *According to WHO-1998 classification.
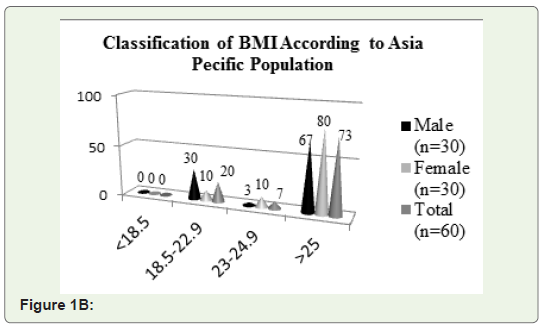
Figure 1B: classification of BMI According to Asia Pecific Population.
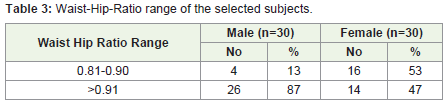
Table 3: Waist-Hip-Ratio range of the selected subjects.
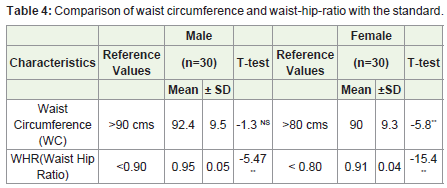
Table 4: Comparison of waist circumference and waist-hip-ratio with the standard.
** Significant at 5 % Level; NS- Non Significant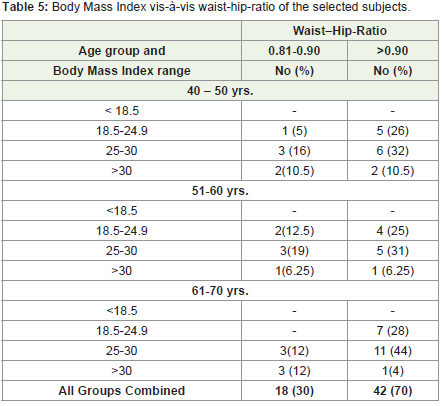
Table 5: Body Mass Index vis-á-vis waist-hip-ratio of the selected subjects.
*BMI range used according to WHO-1998 classificationAn Association between age groups and stress scores, depicted that 58% of the subjects expressed medium stress scores among 40-50 years, at 51-60 years 81% indicated high stress scores; whereas during advancing age 61-70 years, scores were found to be reduced (Table 6A). A statistical analysis noted that as age increases stress scores of the subject’s increases and as age advances the scores decreases this trend indicates the adaptation that people develop to stress over a period of time in later ages. A Statistical analysis between WHR and stress scores noted that among WHR range of 0.81-0.90, 25% of the subjects had high scores of 26-30 while with WHR >0.90 the stress scores increased to 35% of the subjects presenting with high scores (Table 6B). During the analysis it was seen that as WHR increased stress scores of the subjects increased. This could be attributed to stress and adaptation to the same. However, statistical analysis showed non-significance.
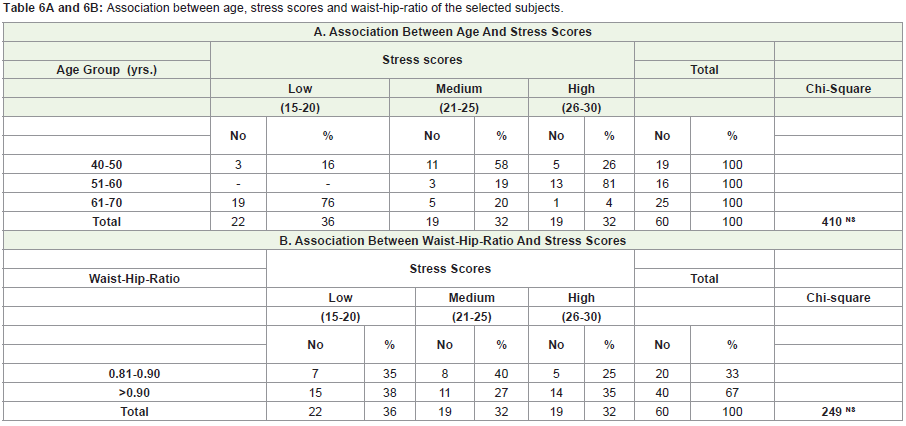
Table 6A: Association between age, stress scores and waist-hip-ratio of the selected subjects.
A. Association Between Age And Stress ScoresNS-Non Significant
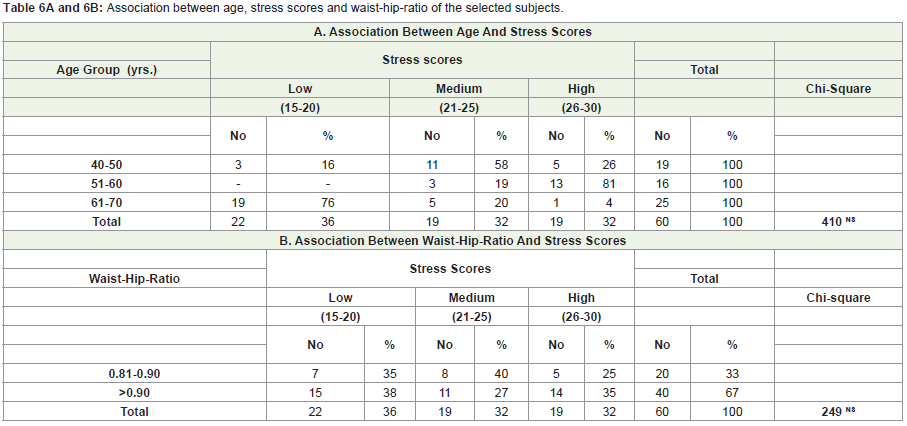
Table 6B: Association between age, stress scores and waist-hip-ratio of the selected subjects.
B. Association Between Waist-Hip-Ratio And Stress ScoresNS-Non Significant
The information on mean nutrient intake and adequacy in comparison with RDA presented in Table 7 reveals that the average energy, protein, calcium and iron intake was less than the RDA in both male and female groups. Mean calorie intake of the subjects among both male and female group was 39% and 31% less compared to the RDA and was statistically significant. Fair consumption of protein was seen among both male and female with adequacy of 90% and 87% respectively, while consumption of fat was negatively high with 120% among male and 145% among female. Calcium intake reveals an adequacy of 73% among male and 66% among female. Iron intake shows an adequacy of 26% and 19.5% in male and female respectively. This shows that the subjects had deficit of calcium and iron in their diet. The dietary protein content was found to be slightly low as even though majority of the subjects were non vegetarian’s frequency of consumption was about once a week. According to a study done by Neetu M, et.al. (2015) on “The relationship of diet and physical activity with Metabolic Syndrome (MS)” which was studied among 60 male and female (40-60 years) urban Indian MS patients it was found that the Intake of green leafy vegetables, other vegetables, fruits and milk were associated with reduced fat mass and waist circumference and increased lean body mass. Energy, carbohydrates, and fat intakes were correlated with increased body fat and waist circumference and reduced lean body mass. Energy, total and saturated fat intake were positively and significantly correlated with total cholesterol [16].
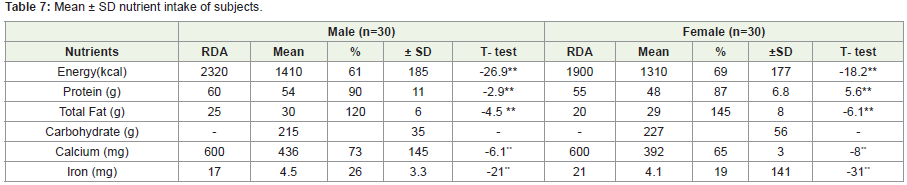
Table 7: Mean ± SD nutrient intake of subjects.
** Significant at 5 % LevelDiscussion
Obesity as a health problem is becoming more widely identified. The enormous economic health cost of obesity, locates it among the most health care problems [16]. According to the WHO estimates, the undernourished population in the world has declined and is roughly around 1.2 billion, whereas the over nourished population has increased to 1.2 billion [17]. Studies from different parts of India have provided evidence of the rising prevalence of obesity. Further, different studies have used different methodologies, definitions and cut-off points for defining obesity, making comparisons difficult [6]. In the study population, 53% female and 47% male were overweight (WHO 1998). This is comparable with a study by ICMR-INDIAB, Rajendra P, et.al (2015), on prevalence of generalized obesity and abdominal obesity among urban and rural India, showed the highest prevalence of both types generalized and abdominal obesity; found in Chandigarh followed by Tamil Nadu, Maharashtra and Jharkhand. Another study by Kutlu R, et.al. (2017) where prevalence of overweight and obesity was found to be 30.8% and 47.7% respectively. Only 92 people (21.5%) were having normal weight [18]. Another study on the prevalence of overweight and obesity among women was done by Sangeetha G, et.al. (2016), where 12.7% found to be overweight and 29.6% obese. Most of the overweight or obese women belonged to the age group of 40-60 years and prevalence increased with increase in age [19]. The results of WC suggest that mean WC of male subjects was higher compared to female subjects which was a simpler reflect for body fat distribution, whereas the intra abdominal valid alternative to BMI for health promotion. Ahmad S, et.al. (2011) found that WC was higher in males than female subjects (p<0.05), but the females had higher body fat percent (p<0.05) than male subjects [5]. Therefore, Asian Indians are at risk of developing obesity related co-morbidities at lower levels of BMI and WC [14].
Both male and female subjects between 51-60 years (31 %) and 61-70 years (44 %) were found to be overweight with WHR range >0.90 respectively. Regardless of the BMI class, 30% of the subjects among all ages combined, showed above normal WHR. In the International Day for Evaluation of Abdominal obesity study by Balkau B, et.al (2007), waist circumference data from 63 countries showed highest prevalence of abdominal obesity in South Asians compared with north Europeans and other Asian ethnic groups [20]. Increased predisposition to diabetes & premature CAD in Indians has been attributed to the “Asian Indian Phenotype” characterized by less of generalized obesity measured by BMI and greater central body obesity as shown by greater WC and WHR. Many Indians fit in to the category of metabolically obese, normal weight individuals. Despite having a lean BMI, an adult Indian has more chances of having abdominal obesity [21]. Thus WC and WHR are the best of all parameters in anthropometry while assessing obesity and the incidence of abdominal obesity as per WC and WHR in our study is fairly high and merits intervention for reduction of abdominal circumference.
The macro and micro nutrient intake of the subjects calculated from the dietary recall alongside the recommended dietary allowances for Indians showed that except for the fat intake all the other nutrients were less than the requirement in both male and female groups. Especially protein, calcium and iron intake seemed to be quite low. These findings are in consonance with a study by Kalaivani AC, et.al. (2016), who found that nutrition transition over the past 40 years is understood to have resulted in 7% decrease in energy derived from carbohydrates and 6% increase in energy derived from fats [22]. The dynamic shift from traditional diets rich in grains, fruits, and vegetables to modern diets rich in fat, sugar and salt coupled with declining levels of physical activity due to rapid urbanization have resulted in escalating levels of obesity. In spite of the subjects taking diet counseling session (45%) for maintaining diabetes did not follow a proper diet regime, however their mean HbA1c show a very poor control with mean values of 8.07%. Increased sedentary lifestyle and prevalence of overweight or obesity are common in many countries [19]. Considering the fact that all the subjects were diabetic, physical exercise is needed for them it is evident from the graph Figure 2 that a very short duration of the day was utilized in exercise about 58% performed walking and 13% were doing yoga regularly. This lack of exercise could also be one of the causative factors for obesity among these subjects. Most of the subjects 95% used to watch TV when compared to listening to music and reading books. A good sleep pattern was observed Figure 3. Sedentary behaviors such as television watching and computer risk for overweight, however, lack of association is reported in the present study between weight status and TV/video watching; it could be because TV/video watching was widespread and habitual among adults belonging to all weight groups. Similar findings was observed in Sukphal K et.al. (2007), where improvement in the standards of living, decrease in physical activities, dependence of men on machine, dietary changes and other life style changes have lead people putting on extra weight. This gain in body weight and obesity is posing a real threat to health both in children as well as adults all over the world [12]. Indicating that factors other than weight status such as the type and variety of entertainment provided by television channels, lifestyle adopted in the families residing in a city like Bangalore, could well be considered as factors contributing to the time spent on these sedentary activities.
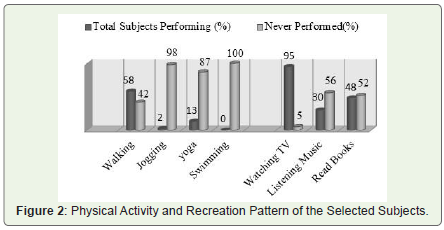
Figure 2: Physical Activity and Recreation Pattern of the Selected Subjects.
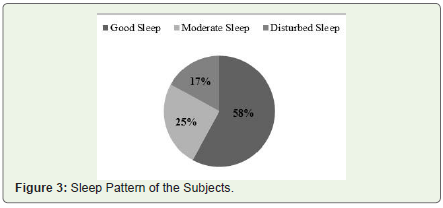
Figure 3: Sleep Pattern of the Subjects.
The individual is stated to be under physiological stress only when the body’s homeostatic limits are crossed. Thus, in a normal individual, shifting to a high fat diet and lower physical activity is liable to disturb the body’s homeostasis leading to a risk of increased body fat and related adult diseases subsequently. (Shobha R, 2001) Findings in the present study during analysis, it was noted that as WHR increased, stress scores of the subjects increased, also there was an increase in stress scores with increasing age and thereafter decreased during older age [23]. A study on stress scores and somatic status by Sowmya GR, et.al. (2009) showed that there was a constant increase in the weight as age increased from 20-60 years and normal body mass index was observed up to 40 years and increased thereafter. The mean WHR increased with increasing age ranging from 0.82-0.96, indicating abdominal obesity [24].
Conclusion
The study revealed that abdominal obesity was prevalent among diabetic subjects as indicated by increased WC and WHR. Except for the fat intake all the other nutrients were less than the RDA among both male and female group and stress scores increased with increasing age and WHR which could be attributed to stress and adaptation to the same over the years. Chronic exposure to environmental stress may play a role in the development of obesity; a hypothetical factor for chronic hyper activation of the HPA axis, particularly in abdominal phenotype has been related to the individual inability to cope up with long term environmental adverse stress full events throughout the life span. In spite of the subjects being diabetic did not follow a proper regime; high fat consumption, sedentary lifestyle, lack of exercise and stress; therefore long standing effect of this unhealthy lifestyle can be a major cause of abdominal obesity among these individuals and greater risk for the development of other chronic diseases. Indian population is passing through a transition phase where subsistence conditions are being replaced by plentiful food but reduced physical work and therefore, an understanding of the changing nutritional scene is critical. Healthy food and physical activity provides protection from the health risks of obesity. We should advise our patients setting a realistic goal and maintain a wellness lifestyle to develop a healthy body composition.
Recommendations
Strategies of prevention of abdominal obesity and overall obesity should be based on not only identifying the risk factors but also understanding the profile of risk factors in different settings. Despite the well-known importance of physical activity for the management of chronic diseases most of the patients did not increase their physical activity after diagnosis. This illustrates a need for tailored interventions to enhance physical activity in newly diagnosed patients. It seems of critical importance with respect to the current diabetes and obesity epidemic, to deliberately increase training of our cognitive, executive prefrontal brains to overcome emotional and habitual responses, by using techniques like mindfulness exercises and meditation.
Acknowledgement
The authors express sincere thanks to management Sagar Hospitals for giving the opportunity to do our dissertation. Dr. Swarupa Kakani RD, Chief Nutritionist, Sagar Hospitals Bengaluru for permitting us to carry out this dissertation and giving us her valuable guidance, all the patients who took part in the study, to Dr. Sowmya Kiran Rao, Nutritionist UAE, for her guidance throughout the study and also Dr. Archana D Nazre, for her help in analyzing the research data statistically.
References
- Banshi S, Praful T, Hardik C, Smita S, Chintal V, et.al. (2014) Prevalence of Obesity and Overweight in Housewives and its Relation with Household Activities and Socio‑economical Status. Journal of Obesity and Medical Research 1:20-24.
- Pranav KP, Kamlesh KJ, Chandra P, Jaya P, Raman KV, et.al. (2016) Diabetes in India: Measuring the dynamics of a public health catastrophe. Journal of social health and diabetes 4: 77-84.
- International Diabetes Federation. Diabetes Atlas 7th (Eds) (2015) Odisha: International Diabetes Federation.
- Nikhil PH, Shivaswamy M, Snajay K, Swetha P, Hiremath MB (2012) Knowledge attitude and behavior regarding self-care practices among type 2 diabetes mellitus patients residing in an urban area of south India. International multi-disciplinary research journal 2:31-35.
- Ahmad S, Abdolijalal M (2011) Prevalence of obesity among Type 2 diabetes mellitus in Gorgan, Iran. World Applied Sciences Journal 14: 1389-1396.
- Rajendra P, Ranjit MA, Shashank RJ, Anil B, Deepa M, et.al. (2015) Prevalence of generalized & abdominal obesity in urban & rural India the ICMR - INDIAB Study (Phase-I) [ICMR - INDIAB-3]. Indian J Med Res 142: 139-150.
- Sinha R, Jastreboff AM (2013) Stress as a common risk factor for obesity and addiction. Biol Psychiatry 73: 827-835.
- Kayode AJ, Olufemi SA, Segun MA, Deola Tomi-Olugbodi, Idowu AA (2009) A study of correlation between derived and basic anthropometric indices in type 2 diabetes mellitus. Eur J Scient Res 36: 437-444.
- Straub RH, Thum M, Hollerbach C, Palitzsch KD, Scholmerich J (1994) Impact of obesity on neuropathic late complications of NIDDM. Diabetes Care 17: 1290-1294.
- Shera AS, Jawad F, Maqsood A, Jamal S, Azfar M, et.al. (2004) Prevalence of chronic complications and associated factors in type 2 diabetes. J Pak Med Assoc 54: 54-59.
- Sowmya GR, Shashikala P (2015) Determinants of Nutrition and Risk of Developing Non-Communicable Diseases in Adult Women. Indian J Nutri 2: 116.
- Sukhpal K, Indrajit W (2007) Body mass index, waist circumference and waist hip ratio among nursing students. Nurs Midwify Res J 3: 84-91
- World Health Organization (1998) Obesity preventing and managing the Global Epidemic: Report of a WHO cosultation on obesity. Geneva: World Health Organization.
- Misra A, Chowbey P, Makkar BM, Vikram NK, Wasir JS, et.al. (2009) Consensus Statement for Diagnosis of Obesity, Abdominal Obesity and the Metabolic Syndrome for Asian Indians and Recommendations for Physical Activity, Medical and Surgical Management. J Assoc Physicians India 57: 163-170.
- Sesikeran B (2010) Revised RDA for Indians, Report of the Expert Group of ICMR. National Institute of Nutrition; Indian Council Medical Research, Hyderabad.
- Neetu M, Bains K, Singh P (2015) Diet and physical activity in relation to metabolic syndrome among urban Indian men and women. Ecol Food Nutr 54: 43-56.
- Misra A, Khurana L (2008) Obesity and the metabolic syndrome in developing countries. J Clin Endocr Metab 93: S9-30.
- Kutlu R, Cihan FG (2017) Comparison of the body compositions in obese and non-obese individuals: Can learning body compositions motivate losing weight? Nigerian Journal of Clinical Practice 20: 83-87.
- Sangeeta G, Sarit S, Anurag C, Priya B, Mahesh S (2016) An Epidemiological Study of Overweight and Obesity among Women in an Urban Area of North India, Indian J Community Med 41: 154-157.
- Balkau B, Deanfield JE, Despres JP, Bassand JP, Fox KA, et.al. (2007) International Day for the Evaluation of Abdominal Obesity (IDEA): a study ofwaist circumference, cardiovascular disease, and diabetes mellitus in 168,000 primary care patients in 63 countries. Circulation 116: 1942-1951.
- Hetal P, Lakhani JD, Patel N (2011) Obesity is becoming synonym for diabetes in rural areas of India also-an alarming situation. International Journal of Biological & Medical Research 2: 556-560.
- Kalaivani AC, Karunanidhi S (2016) Prevalence of Overweight and Obesity among Young Female College Students in Chennai City. Journal of Obesity and Metabolic Research3:23-31.
- Shobha R (2001) Nutritional status of the Indian population. J. Biosci 26: 481-489.
- Sowmya GR, Shashikala P (2009) Somatic status, stress levels and energy expenditure pattern of adult women. Journal of Hum Ecol 26: 1-7.
- Gopalan C, Rama Sastri BV, Balasubramanian SC (2011) Nutritive Value of Indian Foods. ICMR Publications, NIN, Hyderabad.
- Gupta SP (2000) Statistical Methods. Sultan Chand & Sons, New Delhi.