Research Article
Determinants of Obesity in the Adults of Jizan City, Saudi Arabia
Naglaa Kamal Soliman EL Sayed1, Rama Mohan Chandika2*, Shaban Fatouh EL Afifi Sh. Afif3, Mohamed Mahran4 and Hussein EA5
1Associate Professor, King Fisal University, Saudi Arabia
2Assistant Professor in Bio Statistics, Department of Clinical Nutrition, Applied Medical Sciences College, Jazan University, Jazan, Saudi Arabia
3Professor & Head in Clinical Nutrition Department, Applied Medical Sciences College, Jazan University, Jazan, Saudi Arabia
4Nutrition and Food Sciences Department, Faculty of Home Economics, Menufyia University, Egypt and Clinical Nutrition Department, Faculty of Applied Medical Sciences, Jazan University, Jazan, KSA
5Professor, Department of Clinical Nutrition, Applied Medical Sciences College, Jazan University, Jazan, Saudi Arabia
Corresponding author: Rama Mohan Chandika, Assistant Professor in Bio Statistics, Department of Clinical Nutrition, Applied Medical Sciences College, Jazan University, Jazan-45142, Saudi Arabia, Tel: 966 536629535; E-mail: ramamohan.chandika@gmail.com
Citation: EL Sayed NKS, Chandika RM, EL Afifi Sh Afifi SF, Mahran M, Hussein EA. Determinants of Obesity in the Adults of Jizan City, Saudi Arabia. Indian J Nutri. 2017;4(5): 174.
Copyright © 2017 EL Sayed NKS, et al. This is an open access article distributed under the Creative Commons Attribution License, which permits unrestricted use, distribution, and reproduction in any medium, provided the original work is properly cited.
Indian Journal of Nutrition | ISSN: 2395-2326 | Volume: 4, Issue: 5
Submission: 23/09/2017; Accepted: 20/10/2017; Published: 25/10/2017
Abstract
Background: Obesity is one of the most chronic problems which are associated with many serious health problems such as hypertension, diabetes, and heart diseases.
Objective: To assess the determinants of obesity in the adults of Jizan city, Saudi Arabia.
Materials and methods: A cross-sectional study conducted with a random sample of 56 adult obese male with BMI higher than 25 and age between 20 to 60 years old. Each subject sociodemographic information, physical activity, dietary habits, 24 hours dietary recall and family history of obesity was evaluated. The height and weight of the participants were measured and body mass index (BMI) was calculated, waist and hip circumference measured and waist to hip ratio was calculated. A predesigned and pretested questionnaire was administered and data managed on an Excel spreadsheet and chi square test was used to find the association. Variables showing P<0.05 were considered as statistically significant.
Results: Among the participants, 75% were under grade II obesity (30-39.9 BMI) and 18% were under grade III obesity (BMI above 40). Waist to Hip ratio larger than 0.9 were 53% and 47% of subjects were equal or lower than 0.9. The major risk factors include genetic structure, daily energy intake, eating outside home, eating while watching TV, increased frequency of snacking outside, lack of outdoor sports, long periods of watching TV/using computer, no daily exercise. Obesity was less prevalence with high education status 30% compared with moderate education status 63%.
Conclusion: Urgent need for health education, health promotion, and treating the affected individuals are mandatory to reduce the magnitude and consequences of health problem.
Keywords:
Obesity; Body mass index; Nutrition; Energy intake; Sociodemographic factors
Introduction
Obesity is a major public health problem across the world, so it has an international attention. The World Health Organization (WHO), defined obesity as high body mass index (BMI), furthermore classified obesity into three grades as:
The rapid growth in the rate of obesity is directly contributedby environmental and behavioral factors, rather than the biological factors. Moreover, racial or ethnic differences, consumption pattern, and lifestyle also influence the rate of obesity. For instance, as compared to rural areas, people in urban areas have higher obesity rate, possibly due to consumption of high-fat diets and more sedentary lifestyles. For daily living, the amount of energy spent has also reduced over the years, which also promotes obesity. Obesity is also often associated with high socio-economic status; as populations in the developed world are mostly affected by obesity [2]. Many factors affect the prevalence of obesity such as nutrition, dietary habits, age, sex, and physical activity. As well as environmental factors such as education, poverty, housing, and work situation have a great effect on obesity prevalence [3,4]. Heredity is one of the major causes of obesity, around 60% of obesity related to the genetic structure, which also affect body build or somato type of individuals [5]. Dietary causes of obesity are complex and poorly understood [6]. However increase the daily energy intake as a result of changes in food habits pattern may be affected the prevalence of obesity [7]. The changes in food habits include the excessive consumption of pre-prepared meals which mainly contain high fat percentage, snaking between meals and drinking more amount of sweetened beverage [8].
In the past several decades, the socioeconomic level of Saudi Arabia peoples improved. This improvement reflects on increasing daily food and energy consumption with low physical activity as a result, obesity has been prevailed between Saudi peoples [9]. Obesity may reduce the quality of life and its complications may cause early death [10]. Jizan area one of the recently developed communities in Arabia Saudi kingdom and suffering from significant rise in overweight and obese adults. However the literature field to show obesity causes in this area. Therefore the current study was designed to identify factors affecting obesity prevalence in Jazan area, Kingdom of Saudi Arabia.
Materials and Methods
cross sectional study conducted in the Department of Clinical Nutrition, Applied Medical Sciences College, Jizan university, Jizan with random sample of 56 adults male which were apparently obese with body mass index (BMI) greater than or equal to 25. The sample age ranged between 20 to 60 years old and divided into two categories as 20-40 and 40-60 years. Data was recorded using a pretested questionnaire from each participant relating to the variables like sociodemographic information, physical activity, 24-hours dietary recall, dietary habits and family history of obesity. The questionnaire includes questions about age, marital status, region of residence, walking period, smoking status, educational level, occupational status, family size, household income. Educational status was classified into three categories as high education (bachelor degree) moderate education level (secondary school) and low level of education. House size was classified into 3 classes as less than 4 rooms, 4-8 rooms and more than 8 rooms. Family size were divided into small (less than 5 persons), medium (5-10 persons) and large class (more than 10 persons). Physical activity was classified according to daily walking time as low activity (less than one hour/day), moderate (1-2 hour walking/day), and high (more than 2 hours/ day). Family history of obesity was measured as the frequency number of obese in the family and classified into 3 categories as 1-3 persons, 4-5 persons and more than 6 persons. Daily energy intake was calculated of each case and represents as percentage of recommended dietary allowance (RDA) value which was 2550 Kcal/day at this stage of age. Daily energy intake was classified as 100% or less of RDA, 100-125% of RDA and more than 125% RDA. Body weight was measured by a pointer scale with an accuracy of 100 g. Each subject removed his shoes before standing. Height was measured to the nearest 1 cm. Body mass index was calculated as weight in kilogram divided by the square of height in meters. The following categories were used to describe the 3 grades of obesity. Obesity grade I from 25 to 29.9 BMI, grade II from 30 to 39.9 BMI and grade III obesity above 40 BMI. Waist and hip circumference was measured to the nearest cm and then waist to hip ratio (WHR) was calculated and classified into two categories as equal or less than 0.9 and more than 0.9. Data was recorded on a predesigned pro forma and entered on an excel spreadsheet and all entries were double checked for any possible typing error. The statistical analysis was done by using the software SPSS 21.0 version. Frequencies were generated by descriptive analysis and chi square test was applied for finding the determinants of obesity. P<0.05 considered as statistically significant.
Results
Among the study participants 61% were in the age group 20 to 40 years and 39% were in the age group 40 to 60 years. In 20 to 40 years age group participants, 43% were grade II obesity or moderately obese (30-39.9 BMI) and 11% were morbidity obese or grade III obesity (BMI above 40) where as in 40 to 60 years age group participants, 32% were grade II obesity or moderately obese (30-39.9 BMI) and 7% were morbidity obese or grade III obesity (BMI above 40). The prevalence of obesity was higher in younger age group participants than to the older age group participants (Table 1).
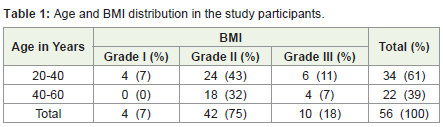
Table 1: Age and BMI distribution in the study participants..
Among the 20-40 years age group participants, 32% were having >0.9 and 29% were having ≤0.9 waist to hip ratio. Where as in 40-60 years age group participants, 21% were having >0.9 and 18% were having ≤0.9 waist to hip ratio. 20-40 years age group participants were having more prevalence to >0.9 waist to hip ratio when comparing to the 40-60 years age group participants. 53% of the study participants were having >0.9 waist to hip ratio (Table 2).
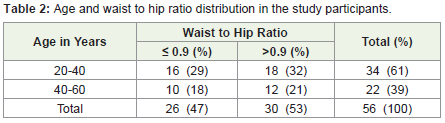
Table 2: Age and waist to hip ratio distribution in the study participants.
Among the 56 study participants 57% were single (unmarried) and 43% were married. 48% of single participants were under grade-II obesity where as in married couples only 13% were under grade-III obesity. Married couples were supporting each other for making life style changes that promote healthy weight. People who are single were at increase risk of overweight and obesity. P-Value>0.05 statistically not significant (Table 3). 61% of the study participants were living in urban area and 39% were in rural area. Among urban area residency participants 50% were under grade-II obesity where as in rural residency people only 5% were under grade-III obesity. Therefore the residency of region is affecting the prevalence of obesity. The rural area residency participants were having lower prevalence of overweight or obesity. P-Value>0.05 statistically not significant (Table 3). 63% of the participants were have moderate education in which 47% were under grade-II obesity and 30% of the study participants were having high education in which only 6% were having grade-III obesity (Table 3).
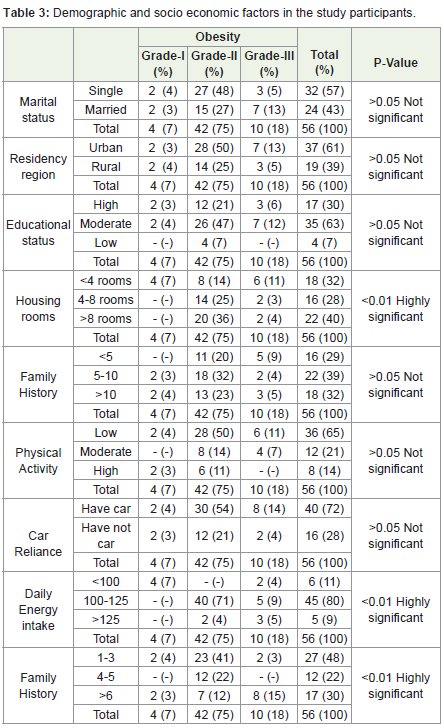
Table 3: Demographic and socio economic factors in the study participants.
40% of the study participants were living in the house having more than 8 rooms in which 36% of participants were under grade-II obesity. 32% of participants were living in the house having less than 4 rooms in which only 14% participants were under grade-II obesity. P-Value<0.01 highly significant (Table 3). 32% of the study participants were living >10 people in one house in which 23% were under grade-II obesity. 29% were living <5 people in one house in which only 20% were under grade-II obesity. P-Value>0.05 not significant (Table 3). 65% of study participants were having lower physical activity in which 50% were under grade-II obesity and 14% were having high physical activity in which only 11% were under grade-II obesity (Table 3). 72% of the study participants were having a car in which 54% were under grade-II obesity (Table 3). 80% of the study participants taking 100-125 daily energy intake and only 9% of study participants taking >125 daily energy intake. P-Value<0.01 highly significant (Table 3). 30% of the study participants having the family history of >6 obeys persons in which 12% of the participants were under grade-II obesity. 48% of the study participants were having the family history of 1-3 obeys in which 41% were under grade-II obesity. P-value<0.01 highly significant (Table 3).
Discussion
The study results shows that the obesity is declined with an increasing age. A Similar result shows in the study conducted on obesity among patients attending primary care centers at Aseer region, Saudi Arabia [11]. Among the 6917 adult individuals, 84% of the obeys were in the age group 18-44 years and only the 16% of the sample individuals were in the age group 45-65 years. A study conducted on body mass index in the Saudi Arabia population of Gassim Region indicated BMI increased with age but the curve plateau at 50 years age with a slight decline in later life [12].
The study results in a good agreement with the National Health Survey done by Brown A et al. on risk factors for overweight and obesity [9]. People who are not married were at increase risk of overweight and obesity. Partners may be supporting each other making lifestyle changes that promote healthy weight. The study results disagree with the study done by ALNohair S address the obesity in Gulf countries [13]. Married people are more susceptible to being overweight and couples are less active and tend to eat together, likely reinforcing increased food intake.
Residence region influence on obesity prevalence. Lower prevalence of obesity in rural area may be related to the hard environmental and social condition of this region. Similar results were in the study done by Malik M et al. on prevalence of overweight and obesity among children in the United Arab Emitates [14]. It has been reported that in the UAE, people living in isolated rural areas still maintain a Bedouin lifestyle and eat traditional foods and consequently also have lower obesity rates than those in urbanized areas.
Educational status of the respondents indicated that the moderate education persons have enough salary to obtain quantities of food larger than they needed and had not enough information concerning the obesity risks. High education persons mainly had the best employment with the highest salary however they had enough information on health risks of obesity. Similar results were found in the National Health Survey done by Brown A et al. on risk factors for overweight and obesity [9].
The study results show the effect of physical activity on obesity. Maximum number of obeys having the lower physical activity due to the rapid economic development in the Arabic-speaking countries has produced significant changes in socioeconomic status and lifestyle; the extensive road networks, increased availability of cars, greater use of mechanized home and farm appliances, widespread use of computers, televisions, and electronic gaming devices have encouraged a more sedentary lifestyle that leads to greater accumulation of body fat.
Daily energy intake has a great positive effect on obesity prevalence. The current results indicated that approximately 80% of studied samples consume 1 to 25% more energy than the recommended dietary allowance (RDA=2550 kcal) and 9% consume higher than 25% of RDA (Table 3). P value is 0.00 statistically highly significant. Therefore the dietary energy intake may be significant responsible for prevalence of obesity in Jazan area. Al-Shagrawi RA et al. observed a significant relationship between daily energy intake and obesity [15]. Karabudak E et al. (2008) showed that sweeten beverage and snack food may be responsible for increasing daily energy intake [8].
There was a significant association between the family history of obesity and BMI. The current result showed that 30% of studied obese cases have 6 obese persons or more in their family. The frequency of obese persons within the same family considered as a good indicator for the presence of genetic effect on the obesity. Therefore it can be concluded that heredity or genetic structure may be played an important role in the prevalence of obesity.
Conclusion
Urgent action including health education, health promotion, and treating the affected individuals are mandatory to reduce the magnitude and consequences of this health problem.
References
- Waxman A, World Health Assembly (2004) WHO global strategy on diet, physical activity and health. Food Nutr Bull 25: 292-302.
- Grabauskas V, Petkeviciene J, Klumbiene J, Vaisvalavicius V (2003) The prevalence of overweight and obesity in relation to social and behavioral factors (Lithuanian health behavior monitoring). Medicina (Kaunas) 39: 1223-1230.
- Cavadini C, Siega-Riz AM, Popkin BM ( 2000) US adolescent food intake trends from 1965 to 1996. Arch Dis Child 83: 18-24.
- Nielsen SJ, Popkin BM (2004) Changes in the beverage intake between 1997 and 2001. Am J Prev Med 27: 205-210.
- Kreutler PA (1980) Nutrition in perspective. Prentice-Hall, New Jersey,USA, pp. 683.
- Krauss RM, Eckel RH, Howard B, Appel LJ, Daniels SR, et al. (2000) AHA Dietary guidelines: revision 2000: a statement for healthcare professionals from the nutrition committee of America Hearth association. Circulation 102: 2284-2299.
- Forshee RA, Anderson PA, Storey ML (2004) The role of beverage consumption, physical activity, sedentary behavior, and demographics on body mass index of adolescent. Int J Food Sci Nutr 55: 463-478.
- Karabudak E, Kiziltan G (2008) The relationship between caloric beverage consumption and body mass index in Turkish university students. Pak J Nutr 7: 202-207.
- Brown A, Siahpush M (2007) Risk factors for overweight and obesity: results from the 2001 National Health survey. Public Health 121: 603-613.
- Segal L, Carter R, Zimmet P (1994) The cost of obesity: The Australian perspective. Pharmacoeconomics 5: 45-52.
- Al-Saleem SA, Alshahrani AM, Al-Khaldi YM (2013) Obesity among patients attending primary care centers, Aseer Region, Saudi Arabia. Saudi J Obes 1: 67-70.
- Soyannwo MA, Kurashi NY, Gadallah M, Hams J, el-Essawi O, et al. (1998) Body mass index (BMI) in the Saudi population of Gassim. Afr J Med Med Sci 27: 117-121.
- ALNohair S (2014) Obesity in Gulf countries. Int J Health Sci (Qassim) 8: 79-83.
- Malik M, Bakir A (2007) Prevalence of overweight and obesity among children in the United Arab Emirates. Obes Rev 8: 15-20.
- Al-Shagrawi RA, Albadar A, El- Hag EA (1994) Factors affecting the prevalence of obesity among Saudi college female students. Emir J Food Agric 6: 227-236.