Research Article
Comparative Study on Reliability and Responsiveness of Quality of Life Scales in Elderly
Divya Sanghi*, Binu Bhatia and Tanvi
Department of Nutrition and Dietetics, Faculty of Applied Science, Manav Rachna International University, Faridabad
Corresponding author: Divya Sanghi, Department of Nutrition and Dietetics, Faculty of Applied Science, Manav Rachna International University, Faridabad; Tel: 7838216486; E-mail: Divya.fas@mriu.edu.in
Citation: Sanghi D, Bhatia B, Tanvi. Comparative Study on Reliability and Responsiveness of Quality of Life Scales in Elderly. Indian J Nutri. 2017; 4(4): 170.
Copyright © Sanghi D. 2017 This is an open access article distributed under the Creative Commons Attribution License, which permits unrestricted use, distribution, and reproduction in any medium, provided the original work is properly cited.
Indian Journal of Nutrition | ISSN: 2395-2326 | Volume: 4, Issue: 4
Submission: 23/08/2017; Accepted: 19/09/2017; Published: 03/10/2017
Abstract
Background: Aging is an irreversible biological change that occurs throughout an individual’s life and continues relentlessly until death. Although there is no certain age, 65 years is usually accepted as the beginning of old age. Chronic diseases cause medical, social, and psychological problems that limit the activities of elderly people in the community and decrease their Quality of Life (QOL).
Aim: With the above background present study was conducted with the aim to assess the quality of life in elderly by using WHOQOL, OPQOL-35 and CASP-19 scales and to compare the reliability and responsiveness of these scales.
Design and methods:: Total 30 elderly subjects above the age of 65 years were purposively selected for the study from urban areas of Faridabad on the basis of inclusion and exclusion criteria. Three standard questionnaires of QOL (WHOQOL-BREF, OPQOL-35 and CASP-19) were used for collection of data from subjects. Anthropometric measurements were also taken using standard protocols. Follow up was done two times at 15 days interval. Data was analyzed by SPSS vs. 20.0.
Result: Data revealed that the mean age of study subjects was 68.80±3.94 years with minimum age 65 years and maximum age 80 years. Majority of subjects (63.3%) were females. All the three scales were consistent. There was no significant difference in any domains of WHOQOL-BREF, OPQOL-35 and CASP-19 at both follow up. Cronbach’s alpha test of reliability revealed that WHOQOL-BREF received 0.78, 0.82 and 0.72 alpha values at baseline and 2 follow up respectively, OPQOL-35 had received minimum alpha value that was 0.31, 0.45 and 0.482 and CASP-19 had Cronbach’s alpha value around 0.69 at baseline as well as in follow ups.
Conclusion: Out of three QOL scales, WHOQOL-BREF scale come out to be the most reliable scale in this community.
Keywords:
Quality of life; WHOQOL-BREF; OPQOL-35; CASP-19
Introduction
Aging is a process of gradual and spontaneous change resulting in maturation through childhood, puberty and young adulthood and the decline through middle and late age [1]. Although there is no certain age, 65 years is usually accepted as the beginning of old age. Old age, occurring in all living creatures without differentiation, is a continuous and universal process causing decreases in all functions. The risk of having diseases such as diabetes mellitus, coronaryheart diseases, osteoporosis etc. rises as the proportion of elderly people increases [2]. Chronic diseases cause medical, social and psychological problems that limit the activities of elderly people in the community and decrease their Quality of Life (QOL) [3]. Definition of quality of life is as follows, a composite measure of physical mental and social well being as perceived by each individual or by group of individual that is to say, happiness satisfaction and gratification as it is experienced in such life concerns as health marriage, family work, financial situations, educational opportunities, self esteem, creativity, belongingness and trust in others (WHO 2004) [4]. Both objective & subjective indicators are used as measures of quality of life. Objective measures have the advantage that they are not subject to observer error bias, but they are insensitive to the feelings of the subjects and concern been expressed regarding the reliability of some measures; for example, crime rates, housing density and income. Subjective parameters, such as job satisfaction, and perceptions of health and morale, involve subjects being asked to make judgments about their lives; this is strength of subjective measures [5]. There are many general instruments available to measure quality of life like ADL- Activities of Daily life, IDAL- Instrumental activities of daily life, Flanagan quality of life scale etc. The World Health Organization (WHO) has developed a quality of life instrument, the WHOQOL, which captures many subjective aspects of quality of life). The WHOQOL-BREF is one of the best known instruments that has been developed for crosscultural comparisons of quality of life [6]. The OPQOL is a new 32 to 35-item QOL measure. It has 5-point Likert scales from strongly agree to strongly disagree, with 32 or 35 items [7]. CASP-19 is useful not only as a measure of quality of life in research, but also as an approach to define quality of life and its is a summative scale of 19 items. Higgs et al. and Hyde et al. based their model of QOL in older age on self-actualization and self-esteem. The OPQOL, CASP-19 and WHOQOL-OLD had acceptable levels of reliability and validity in British population samples Bowling (2009) [8].
Design and Methods
This observational study was conducted in urban areas of Faridabad on 3 February 2017, Haryana. Sample size was 30 elderly subjects. For the enrollment of study subjects purposive sampling method was used. Three standard questionnaires were used for assessing the quality of life in elderly population, named as: WHOQOL-BREF is a 26-item instrument and consists of four domains: physical, psychological, social relationships, environmental health domain. The full OPQOL consisted of 35 statements with seven domains: life overall, health, social relationship and participation, independence, control over life and freedom, home and neighborhood, psychological and emotional well-being and culture and religion. The CASP-19 is based on a needs-satisfaction model tapping four domains: control, autonomy, pleasure and self-actualization. Follow up was done two times. Each follow up was done at 15 days interval. All the data was summarized as Mean +SD and frequencies (percentages). Data was analyzed by using ANOVA, chi-square test and Cronbach’s alpha test. All the statistical analysis was performed on SPSS.vs.20.
Results and Discussion
The general characteristic of study subjects was depicted in Table 1. Data revealed that the mean age of study subjects was 68.80±3.94 years with minimum age 65 years and maximum age 80 years. All the study subjects were Hindu. Marital status showed that 86.6% subjects were married and only 13.3% were widowed and nobody was separated. Majority of subjects (63.3%) were females.
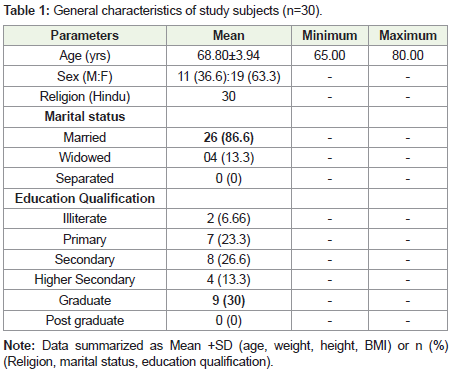
Table 1: General characteristics of study subjects (n=30).
In regards to education qualification, 30% were graduate, 26.6% and 23.3% were having secondary and primary education respectively, 63.3% were higher secondary and 6.66% were illiterate and no were having post graduate degree.
Bowling also conducted a study on Ethnibus sample were aged 65- 75+, Over half of each sample (52-54%) comprised women. The same age group and gender distribution was also found in present study.
Baernholdt et al. reported in study that the majority of the final sample of 911 were female (56.8%), and their average age was 73.6years and 57.8% were married. The majority (72%) had a high school degree or more education.
Anthropometric measurements of study subjects were depicted in Table 2. The mean height was 159.2±8.72 with minimum height was 134 cm and maximum height was 175 cm. The mean weight was 63.96±9.16 with minimum and maximum weight was 46 kg and 82 kg respectively. The Mean value of BMI was 25.17±2.42, according to WHO Asian Classification; all subjects were in obese category (25 above).
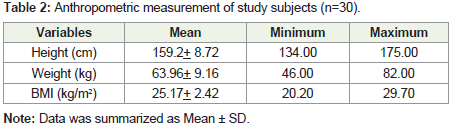
Table 2: Anthropometric measurement of study subjects (n=30).
Comparison of four domains of WHOQOL-BREF at baseline and follow ups was depicted in Table 3. Regarding the physical health, the mean value was 68.86±13.19 at baseline, 68.63±13.47 at 1st follow up and 64.06±8.95 at 2nd follow up. The p-value was 0.22 (p>0.05) which was insignificant.
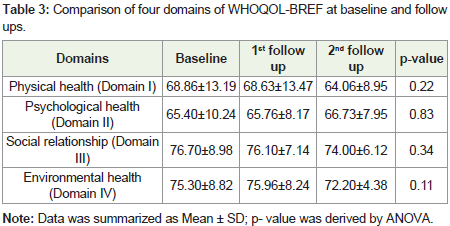
Table 3: Comparison of four domains of WHOQOL-BREF at baseline and follow ups.
Discussion
Psychological health revealed that the mean value on two follow ups were 65.40±10.24, 65.76±8.17 and 66.73±7.95 respectively and the p-value was 0.83 which was insignificant.
Social relationships data showed that the mean was 76.70±8.98 at baseline, 76.10±7.14 at 1st follow up and 74.00±6.12 at 2nd follow up which was also insignificant (p = 0.34).
The mean value of environmental health on two follow ups were 75.30±8.82, 75.96±8.24 and 72.20±4.38 with the p- value 0.11 which was insignificant.
Present study reported minimum score in psychological health domain (65.4) followed by physical health (68.86), environmental (76.7) and social relationship (75.3), similarly Asnani et.al also reported minimum in psychological domain (26.9) and it was badly affected then social relationship (42.1) followed by physical health (42.4)
The comparisons of all domains of OPQOL-35 at baseline and follow ups were depicted in Table 4. Life overall data showed that at baseline mean was 9.66±1.46, at 1st follow up 9.86±1.25 and 2nd follow up 10.03±0.92 and difference was insignificant (p=0.52).
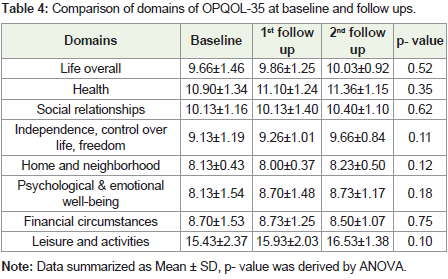
Table 4: Comparison of domains of OPQOL-35 at baseline and follow ups.
Health domain revealed that the mean was 10.90±1.34 at baseline, 11.10±1.24 at 1stnd follow up and the pvalue was 0.35 which was insignificant.
In social relationships domain, the mean was 10.13±1.16 at baseline, 10.13±1.40 at 1st follow up and 10.40±1.10 at 2nd follow up. The p- value was 0.62 which was insignificant.
In independence, control over life, domain, the mean was 9.13±1.19 at baseline, 9.26±1.01 at 1st follow up and 9.66±0.84 at 2nd follow up and the p- value 0.11 which was insignificant.
In home and neighborhood domain, the mean was 8.13±0.43 at baseline, 8.00±0.37 at 1st follow up and 8.23±0.50 at 2nd follow up. The p- value 0.12 which was insignificant.
In psychological & emotional well-being domain, 8.13±1.54 at baseline, 8.70±1.48 at 1st follow up and 8.73±1.17 at 2nd follow up. The p- value 0.18 which was insignificant.
Financial circumstances data revealed that the mean was 8.70±1.53 at baseline, 8.73±1.25 at 1st follow up and 8.50±1.07 at 2nd follow up. The p- value 0.75 which was insignificant.
In leisure and activities domain, the mean was 15.43±2.37 at baseline, 15.±2.03 at 1st follow up16.53±1.38 at 2nd follow up. The pvalue 0.10 which was insignificant.
Pucci et.al revealed in similar study that there was an association between higher levels of walking (active) with the social relations (P = 0.011) and environment (P = 0.015) domains. Only intermediate levels of moderate PA were associated with physical (p = 0.016) and psychological (P = 0.003) domains. Vigorous PA and walking for transport were only associated with the physical QOL domain, which had a linear relationship with transport PA (p = 0.028 p = 0.042).
Comparison of domains of CASP-19 at baseline and follow ups was depicted in Table 5. Control domain data showed that the mean on three follow up were 11.03±1.86, 11.40±1.81, 11.40±1.40respectively. The p- value was 0.63 which was insignificant.
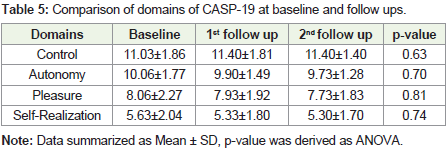
Table 5: Comparison of domains of CASP-19 at baseline and follow ups.
Autonomy domain data revealed that the mean was 10.06±1.77 at baseline, 9.90±1.49 at 1st follow up and 9.73±1.28 at 2nd follow up. The p- value was 0.70 which was insignificant.
Pleasure domain data showed that the mean on two follow ups were 8.06±2.27, 7.93±1.92, 7.73±1.83 respectively. The p- value was 0.81 which was insignificant.
Regarding self-realization, the mean was 5.63±2.04 at baseline, 5.33±1.80 at 1st follow up and 5.30±1.70 at 2nd follow up. The p- value was 0.74 which was insignificant.
Similar results were reported in a previous study done by Sim et.al on CASP 19. Study reported that the mean (SD) total score on the CASP-19 was 40.24 (9.04), and individual scores ranged from 15 to 57. The variation in scores-as expressed by the coefficient of variation (SD/mean)-was 0.22. Scores exhibited a slight negative skew (median score = 41.0 and accordingly the data departed slightly from normality (though not significantly on a Kolmogorov-Smirnov test; P = 0.093). The mean (SD) scores for the four domains were 7.38 (3.01) for control; 10.92 (2.69) for autonomy; 13.22 (2.17) for pleasure and 8.73 (3.45) for self-realization.
The Cronbach’s test on all three questionnaire- WHOQOLBREF, OPQOL and CASP-19 at baseline and follow ups were depicted in Table 6. The highest Cronbach’s alpha value was found for WHOQOL- BREF at baseline (0.78) and 2 follow up (0.82 and 0.72) and these were very consistent during follow up. CASP 19 secures Cronbach’s alpha value around 0.69 at baseline as well as in follow up. OPQOL- 35 received minimum alpha value that was 0.31, 0.45 and 0.48. The cutoff of Cronbach’s alpha is Excellent- ≥0.9, Good- 0.9- ≥0.8, Acceptable- 0.8- ≥0.7, Questionable- 0.7- ≥0.6 and Poor-
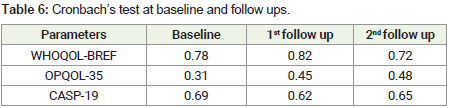
Table 6: Cronbach’s test at baseline and follow ups.
Conclusion
The study results revealed that no significant difference wasobserved for any domain of WHOQOL-BREF, OPQOL-35 and CASP-19 from baseline to each follow up. All the three scale was consistent. On the Cronbach’s test analysis for all the three scales, WHOQOL-BREF scale come out to be most reliable scale for the particular community.
References
- Canbaz S, Sunter AT, Dabak S, Peksen Y (2003) The prevalence of chronic diseases and quality of life in elderly people in Samsun. Turk J Med Sci 33: 335-340.
- Thadathil SE, Jose R, Varghese S (2015) Assessment of domain wise quality of life among elderly population using WHO-BREF scale and its determinants in a rural setting of Kerala. Inter J Curr Med Appl Sci 7: 43-46.
- Sander GE (2002) High blood pressure in geriatric population: Treatment considerations. Am J Geriatr Cardiol 11: 223-232.
- The WHOQOL Group (1994) Development of the WHOQOL: Rationale and current status. Inter J Ment Health 23: 24-56.
- Sim J, Bartlam B, Bernard M (2011) The CASP-19 as a measure of quality of life in old age: Evaluation of its use in a retirement community. Qual Life Res 20: 997-1004.
- The WHOQOL Group (1994a) Development of the WHOQOL: Rationale and current status. Inter J Ment Health 23: 24- 56.
- Walke LM, Byers AL, Tinetti ME, Dubin JA, McCorkle R, et al. (2007) Range and severity of symptoms over time among older adults with chronic obstructive pulmonary disease and heart failure. Arch Intern Med 167: 2503-2508.
- Bowling A, Banister D, Sutton S, Evans O, Windsor J (2002) A multidimensional model of the quality of life in older age. Aging Ment Health 6: 355-371.