Research Article
Comparison of Glycemic Responses of Various Cereal based Breakfast Items in Diabetic and Non-Diabetic Individual
Remya PR, Davis A*
Department of Home Science, Vimala College, University of Calicut, Kerala
Corresponding author: Anitha Davis, Vimala college, University of Calicut, Kerala, India, Tel: +91-487-2332080; Fax: +91-487-2321759; E-mail: mail@vimalacollege.edu.in
Citation: Remya PR, Davis A. Comparison of Glycemic Responses of Various Cereal based Breakfast Items in Diabetic and Non-Diabetic Individual. 02 Indian J Nutri. 2017;4(1): 155.
Copyright © 2017 Remya PR, et al. This is an open access article distributed under the Creative Commons Attribution License, which permits unrestricted use, distribution, and reproduction in any medium, provided the original work is properly cited.
Indian Journal of Nutrition | ISSN: 2395-2326 | Volume: 4, Issue: 1
Submission: 09/03/2017; Accepted: 21/03/2017; Published: 01/04/2017
Abstract
The study was conducted to assess the glycemic responses to various cereal breakfast items and also to assess the acceptability and post consumption discomfort by the diabetic and non-diabetic respondents. The study was conducted at Panangattukara village of Thrissur district, Kerala; India. Samples were randomly selected. The study comprises a macro as well as micro sample [macro sample of 50 individuals in the age group of 40-60, from which a micro sample of 12 individuals]. The micro sample contains six diabetic and six non diabetic subjects of the same age group. Fasting blood sugar estimation was done in the macro sample to identify the diabetic population. Oral glucose tolerance test was done in the micro sample. Fasting blood glucose values of the respondents were checked before the consumption of each experimental diets. Glycemic responses of the micro sample was checked and tabulated after the test diets. A chi square test was done to analyze the statistical significance of the experiment. The p value of the diets shows that maize has got greater significance, followed by ragi and oats in the diabetic respondents. The percentage increase over fasting blood sugar at the peak level was calculated. Rice has got the highest value for percentage increase in diabetic samples Post consumption feedback was obtained from the micro sample after every test diets. Rice diet has got the highest acceptability among the diabetic samples. The acceptability of maize was very poor. Ragi was more acceptable than the maize diet. Even though the acceptability of the ragi diet and maize diets were low, the diabetic respondents were ready to consume those diets as mean of controlling their diabetes.
Keywords:
Experimental diet; Diabetic sample; Non diabetic sample; Fasting blood glucose; Glucometer
Introduction
Diabetes is a chronic disease, which occurs when the pancreas does not produce enough insulin, or when the body cannot effectively use the insulin it produces. This leads to an increased concentration of glucose in the blood (hyperglycemia). Over the past three decades, the number of people with diabetes mellitus has doubled globally, making it one of the most important public health challenges toall nations. Type 2 Diabetes Mellitus (T2DM) and pre diabetes are increasingly observed among children, adolescents and younger adults.
There are several factors that contributes to diabetes includingheredity, environmental factors, stress, and life style changes. Of these factors a sedentary lifestyle is the major contributory factor. A modern lifestyle with reduced physical activity, increased stress, over consumption of junk foods and carbonated drinks puts one into the risk of obesity and subsequent insulin resistivity and diabetes. Even though hereditary factors may contribute to the problem, i.e. the HLA genotype, the disease progression needs some environmental factors to trigger. It is the answer of how diabetes happens in individuals not having any hereditary patterns.
The management of diabetes cannot be achieved by giving medicines alone. In fact more than 50% of diabetics do not need any medication. The mainstay in the management is the life style change, as we have seen that the cause of diabetes is the wrong habits of living.
Diet therapy is one of pillar stones for the management of diabetesand the foods one can eat includes most of things he/she normallyenjoy, except for a strict limitation on foods high in sugar content.Eating healthy foods is one of the most basic and important tools ofdiabetes management. The right food choices can half control bloodsugar and protect long term health. Choosing low-GI foods in placeof conventional or high-GI foods has a small but clinically usefuleffect on medium-term glycemic control in patients with diabetes.The incremental benefit is similar to that offered by pharmacologicalagents that also target postprandial hyperglycemia [1].
Breakfast is the most important diet for an individual especially ifhe is diabetic. At night, the body typically goes without food a sourceof glucose for up to 12 hours. It is during this prolonged period of fasting that the body mobilizes its glucose stores in the form of glycogen. These glycogen stores may deplete in the next morning and this may spell trouble for diabetics who have taken blood glucoseloweringdrugs the night before. As these drugs may still be active the next morning, blood glucose levels may drop further, increasing the risk of hypoglycemia or low blood sugar.
Breakfast consumption, especially if it consisted of fiber rich foods rather than refined cereals, could lead to improved postprandial glycemic response and insulin sensitivity. A diet high in soluble fiber can be useful for individuals with diabetes in the management of blood glucose and blood lipid levels. Here comes the need of a high fiber cereal breakfast.
The present study named “Comparison of glycemic response of various cereal based breakfast items” was conducted to compare the glycemic responses of various breakfast items in the Kerala cuisine. The common cereals of Kerala breakfast rice, wheat, ragi, oats and maize were used in the study.
Materials and Methods
The area selected for the study was “Panangattukara” village of Thrissur district. This study comprised of 50 subjects between the age group of 40-60 years. This macro sample was separated into two groups such as diabetic and non-diabetic on the basis of fasting blood sugar estimation by the glucometer. From this macro sample, a micro sample including 6 diabetic and 6 non diabetic individuals was selected for detailed experimental study. Glucose tolerance test was done among the selected micro samples to confirm the glucometer readings.
Focusing on the objectives of the study, a questionnaire was developed to elicit the socio economic status, dietary pattern followed, dietary status, anthropometric measures, incidence and family history of lifestyle diseases of the respondents and the treatment modality adopted by them. Appropriate changes were made in the questionnaire before it was used for the purpose. The micro samples were selected on the basis of information obtained with the aid of this questionnaire.
The blood sugar estimation for this study was done by a glucometer. The macro samples were tested for their fasting blood sugar levels to identify the diabetic and non-diabetic. Detailed blood sugar estimation was done on the micro sample.
A high intake of dietary fiber, particularly of the soluble type,above the level recommended by the ADA, improves glycemic control, decreases hyperinsulinemia, and lowers plasma lipid concentrations in patients with type 2 diabetes [2]. The commonly used cereals were selected for the study viz rice, wheat, ragi, oats and maize. Using these cereals the most popular breakfast item of Kerala, the puttu, was decided to prepare. It was selected as the experimental diet by its ease of preparation and its low glycemic index as the starch do not get soluble by the preparation. A breakfast meal containing puttu, green gram curry, and tea was planned and given to the micro sample. A standardized recipe was used every time. The cereals used in the experimental diet include rice, wheat, ragi, oats and maize.
An experimental breakfast meal was given to the micro sample. The samples were expected to remain with the empty stomach until the investigator arrives, for assessing the fasting blood sugar levels. Details of administration are given in the Table 1.
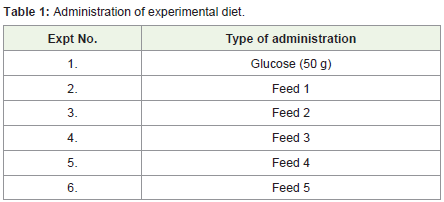
Table 1: Administration of experimental diet.
A feedback form was given to the subjects so that their feedback regarding each experimental diet is obtained. There were questions regarding the acceptability, quantity, post consumption discomfort of the diet in the feedback form.
The blood sugar levels of the micro sample were assessed before and after the administration of each experimental diet with the aid of a glucometer.
The information regarding the socio economic status, dietary pattern, anthropometric examination and clinical examination obtained through the questionnaire were tabulated.
Results and Discussion
Out of the 50 respondents surveyed, 46 (92%), were not engaged in any kind of exercise. The remaining 8% of respondents (4% males and 4% females) were having daily morning walks.
On analyzing the sleeping pattern of the subjects, it was clearthat majority of them had good sleeping hours. Only one of them hasreduced sleeping hours. Studies suggest that lack of sleep may alsobe a risk factor for type 2 diabetes. Sleep loss seems to affect diabetesrisk in two ways. Sleep can cause weight gain by reducing the nightlyproduction of growth hormone, which triggers both the productionof protein in muscle and the breakdown of stored fat, which in turnregulates the body’s proportion of muscle to fat. The lack of sleepalso cause blood sugar levels to rise higher than usual and return tonormal more slowly and it slows the body’s production of insulin andincreases the risk of diabetes [3].
Lifestyle appears to play a significant role in the risk of developingtype 2 diabetes. Worldwide the lower frequency of type 2 diabetes is with populations eating meat Vs vegetarian diets. This may be attributed to the reduced chances of weight gaining and by the presence of high fiber in the diet. Lacto, lactoovo and semi-vegetarian diets were associated with a lower likelihood of diabetes. These findings may assist in the development of interventions to address the growing burden of overweight/obesity and diabetes in Indian population [4].
Out of the 50 respondents surveyed 43 were non vegetarians and 7 were vegetarians. Of the vegetarians, all were lacto vegetarians.
Fifty per cent of the respondents were following a 4 meals pattern and 40% of them were following a 3 meals pattern. Only 10% of them were having above 4 meal/day pattern. As energy intake has increased, a higher percentage of the energy consumed has come from refined foods laden with sugars and fats and a lower percentage from whole grains and fiber rich foods [5]. The reduction in whole grain, dietary fiber and associated phytonutrients may enhance the risk of type 2 diabetes [6] (Figure 1).
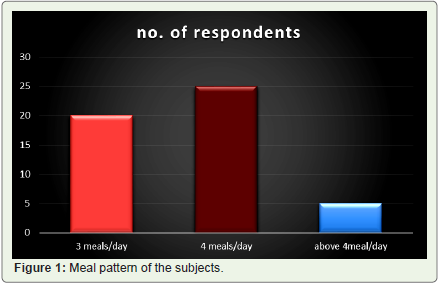
Figure 1: Meal pattern of the subjects.
Twenty percent of the respondents were skipping their breakfast. The female respondents were found to skip their breakfast due to lack of time in the morning schedule. No respondents were found to skip their lunch or dinner. Breakfast omission was associated with an increased risk of Type 2 diabetes mellitus in men even after adjustment for BMI. A direct association between snacking between meals and Type 2 diabetes mellitus risk was mediated by BMI [7].
Twenty percent of the respondents had food from outside the home. Of these 16% were male respondents and the remaining were female respondents. Majority of the respondents (both male and female respondents) i.e. 14% had food from outside the home once in a month. The remaining 4% of female respondents and the 2% of the male respondents used to have outside food twice in a month and they had it with their family. Low-carbohydrate, low-GI, Mediterranean, and high-protein diets are effective in improving various markers of cardiovascular risk in people with diabetes and should be considered min the overall strategy of diabetes management [8].
Fast food consumption had strong positive association with weight gain and insulin resistance, suggesting that fast food increases the risk of obesity and type 2 diabetes. Fast food consumption has been associated with higher intakes of energy, fat, saturated fat, sodium, and carbonated soft drinks and lower intakes of vitamins A and C, fruit and vegetables, and milk. Fried foods also contain large amounts of partially hydrogenated oils, which may lead to insulin resistance [9].
The survey categorized the respondents based on their BMI as normal, underweight and obese. Majority (60%) was normal and eight per cent were underweighted whereas 25% of the respondents were obese. Finding from epidemiological studies have repeatedly confirmed a strong association between excess adiposity and risk of developing type 2 diabetes [10].
Fasting blood sugar test was done in the macro sample to distinguish the normal and diabetic individuals. Out of the 50 respondents, 11 individuals were found to have high fasting blood sugar values. Out of these 11 diabetic subjects 3 of them had hypertension and one had hypercholesterolemia. Out of 11 diabetic subjects 2 of them had both diabetes and hypertension. The fasting blood sugar values of the macro sample were estimated using the “One touch blood monitoring system”. The result depicted that 22% of the respondents were diabetic. The oral glucose tolerance test was used to assess patients who had signs and symptoms of diabetes mellitus, but whose fasting plasma glucose is normal or suggests prediabetes. This test was done to know whether the person is normal, diabetic or having impaired glucose tolerance. Oral glucose tolerance test was done in the micro sample in order to assess their metabolic response. Seventy five grams of glucose was administered orally to the 12 subjects (6 diabetic and 6 non diabetic). The Oral Glucose Tolerance Test (OGTT) helped in distinguishing the diabetic and non-diabetic samples.
A series of five experimental diets were given to the micro sampleand a feedback was obtained from them after the administrationof each diet. All the test diets were supplied in the same quantity.The carbohydrate amount was higher for the rice diet while it waslow for the oats diet. On looking for the protein value of the diets,oats diet leads the table with the highest quantity of protein. In thecase of caloric value of the diets, almost all the five diets supply thesame amount of energy. The oats diet has the lowest energy value.Calcium content of the ragi diet was the one with the highest value.The oats has greatest amount of iron as well as fiber content amongthe experimental diets (Table 2).
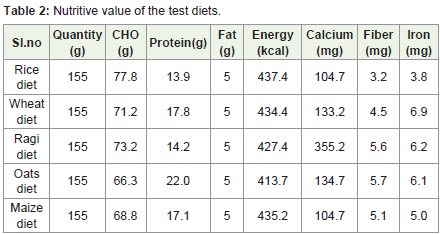
Table 2: Nutritive value of the test diets.
The experimental diets supplied except that of maize diet and ragi diet were acceptable by most of the non-diabetic respondents.
Majority of the people argued that the diet was enough to satisfy their hunger. Only a minor percentage (16%) felt that the diet was not enough in quantity. One of the respondent said it was more than enough to satisfy the hunger. Even though the major portion of the respondents do not experienced any discomfort, some of them felt discomforts like heartburn and regurgitation. The acceptability as a breakfast item was poor for the maize diet and ragi diets. But these diets have got more acceptability among the diabetic population than the non-diabetic samples. The diabetic samples were ready to accept the experimental diets as a therapeutic mean to control their diabetes. Only a minority of the sample argued that the diet supplied was not enough in quantity. A small portion of the subjects experienced discomforts like heartburn and regurgitation. No other discomforts were observed (Table 3).
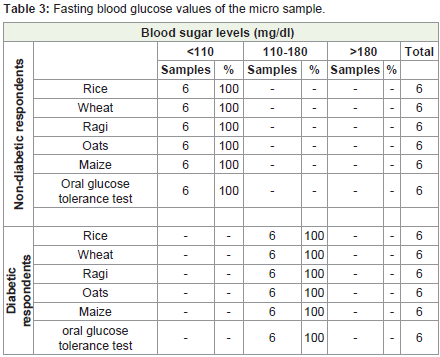
Table 3: Fasting blood glucose values of the micro sample.
The data in the above table go well with the classification of diabetes by WHO, (2014), which says that a person is said to have normal blood sugar values if his fasting blood sugar is below 110 mg/dl. The table clearly says that the fasting glucose values of diabetic samples lies above the normal range of blood sugar (below 110 mg/dl) i.e. in the range of 110-180. There were no subjects with blood sugars higher than 180 mg/dl.
The blood sugar values of the non-diabetic subjects after 1½ hour of the consumption of the diet says that for majority of the samples the post consumption blood sugar values were below 110 mg/dl. After consuming the ragi, oats and wheat diets, and after the glucose tolerance test, 100% of the respondents got a blood sugar value below 110 mg/dl. The post prandial blood glucose values after the consumption of rice diet and maize diet, respectively 67% and 83% of the respondents were below 110 mg/dl. The values were in between 110-180 mg/dl for some of them. Of the samples, 33% shows a blood sugar in the 110-180 mg/dl range after consuming the rice based experimental diet followed by 17% after the maize diet.
After the consumption of experimental diets for majority of diabetic individuals the post prandial blood sugar was in the range of 110-180 mg/dl. A minority have the values above 180 mg/dl. The post prandial blood glucose after the oats diet of the 100% respondent was in the 110-180 mg/dl range. A chi square test was done to analyze the statistical significance of the experiment. The results are given in the Table 4. A p value below 0.05 indicates that the result obtained is significant.
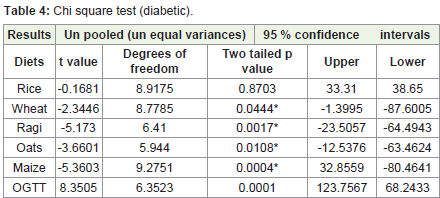
Table 4: Chi square test (diabetic).
The p value of the test diets indicates that maize has got greatersignificance followed by ragi and oats. As the values were significant,these cereals can be advised for diabetic subjects as a way to controldiabetes.
The two tailed p values of experimental diets in the non-diabeticrespondents (n=6) suggest that the test values were not statisticallysignificant. As the p values of experimental diets in non-diabeticrespondents was greater than 0.05, failed to reject the null hypothesis(i.e. there was no significant difference between the blood sugar levelsbefore and after the consumption of experimental diets) (Table 5).
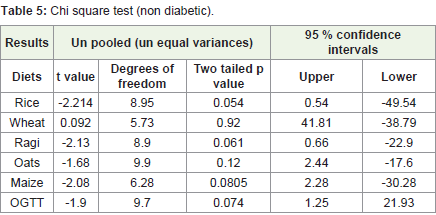
Table 5: Chi square test (non diabetic).
Conclusion
The glycemic responses of the micro sample was checked andtabulated after the test diets. The percentage increase over fasting blood sugar at the peak level was also calculated. Rice has got the highest value for percentage increase in diabetic samples as well as non-diabetic samples. Post consumption feedback was obtained from the micro sample after every test diets. Rice diet has got the highest acceptability among the diabetic and non-diabetic samples. The acceptability of maize was very poor. Ragi was more acceptable than the maize diet. Even though the acceptability of the ragi diet and maize diets were low, the diabetic respondents were ready to consume those diets as mean of controlling their diabetes. Post consumption discomforts were also collected from the respondents. The majority (66%) of the respondents do not experienced any kind of discomfort. The discomfort experienced by the minority (33%) was heart burn and regurgitation. No other discomforts were reported. The post prandial blood sugar values, after 1½ hour taken from the non-diabetic respondents revealed that, for majority (83%) of them the blood sugar values come down below 110 mg/dl, a small portion of this population shows a post-prandial blood sugar value in the range of 120-180 mg/dl.
For majority (67%) of the diabetic respondents, the post prandial blood sugar of was in the range of 120-180 mg/dl. A chi square test was done to analyze the statistical significance of the experiment. The p value of the diets shows that maize has got greater significance,followed by ragi and oats in the diabetic respondents. The results of chi square test revealed that no experimental diets produced statistically significant results in non-diabetic respondents.
References
- Brand-Miller J, Hayne S, Petocz P, Colagiuri S (2003) Low-glycemic index diets in the management of diabetes: a meta-analysis of randomized controlled trials. Diabetes care 26: 2261-2267.
- Chandalia M, Garg A, Lutjohann D, Bergmann VK, Grundy MS, et al. (2000) Beneficial effects of high dietary fiber intake in patients with type 2 diabetes mellitus. NEJM 342: 1392-1398.
- Metzger BE (2006) American medical association guide to living with diabetes: Preventing and treating type 2 diabetes--essential information you and your family need to know,(1st edn). Am Med Assoc, Wiley Publisher.
- Agrawal S, Millett CJ, Dhillon PK, Subramanian S, Ebrahim S (2014) Type of vegetarian diet, obesity and diabetes in adult Indian population. Nutr J 13: pp.89.
- Bhargava A, Amialchuk A (2007) Added sugars displaced the use of vital nutrients in the National Food Stamp Program Survey. J Nutr 137: 453-460.
- Bo S, Durazzo M, Guidi S, Carello M, Sacrdote c, et al. (2006) Dietary magnesium and fiber intakes and inflammatory and metabolic indicators in middle-aged subjects from a population-based cohort. Am J Clin Nutr 84: 1062-1069.
- Mekary RA, Giovannucci E, Willett WC, van Dam RM, Hu FB (2012) Eating patterns and type 2 diabetes risk in men: breakfast omission, eating frequency, and snacking. Am J Clin Nutr 95: 1182-1189.
- Ajala O, English P, Pinkney J (2013) Systematic review and meta-analysis of different dietary approaches to the management of type 2 diabetes. Am J Clin Nutr 97: 505-516.
- Bowman SA, Vinyard BT (2004) Fast food consumption of U.S. adults: impact on energy and nutrient intakes and overweight status. J Am Coll Nutr 23: 163-168.
- McGrady A, Moss D (2013) “Diabetes and obesityâ€. Springer New York, pp. 145-155.