Research Article
Physico-Chemical Analysis of Some Commercial Honey Samples from Telangana
Shobham1, Kiran Kumar Chitluri1 and Jyothi Nayar1*
1Department of Genetics and Biotechnology, Bhavan’s Vivekananda College of Science Humanities and Commerce, Sainikpuri, Secunderabad, Telangana, India
Corresponding author: Jyothi Nayar, Department of Genetics and Biotechnology, Bhavan’s Vivekananda College ofScience Humanities and Commerce, Sainikpuri, Secunderabad, Telangana, India, E-mail: jyothinayars@yahoo.com
Citation: Shobham, Chitluri KK, Nayar J. Physico-Chemical Analysis of Some Commercial Honey Samples from Telangana. Indian J Nutri. 2017;4(1): 02 153.
Copyright © 2017 Nayar J, et al. This is an open access article distributed under the Creative Commons Attribution License, which permits unrestricted use, distribution, and reproduction in any medium, provided the original work is properly cited.
Indian Journal of Nutrition | ISSN: 2395-2326 | Volume: 4, Issue: 1
Submission: 16/01/2017; Accepted: 10/02/2017; Published: 14/02/2017
Abstract
The present work encompasses a critical physico-chemical characterization of 5 commercial honey samples available in India. The analysis includes moisture content, pH, electrical conductivity, acidity, total sugars, reducing and non-reducing sugars. The absolute pollen count of the honey samples was also determined and graded.
The objective was to compare the honey samples based on sensorial, physical and chemical parameters. Four commercially available honey samples were obtained from the local market of Hyderabad, Telangana State and one from Bangalore, Karnataka State India. These constitute the principle material of the present study. Of the 5 samples, four - Lio, Apo, Dab & Fet are available throughout the country while 1 sample - Pra (Figure 1a) is exclusive to Bangalore.
Keywords:
Honey; Acidity; Reducing and non- Reducing sugars; pollen
Introduction
Melissopalynology or Mellitopalynology is a branch ofPalynology that deals with pollen analysis of honey. The analysis helps to determine the geographical and botanical origin of the honey samples. It provides an index of the bee foraging plants - the plants preferred by the honeybees for nectar and pollen. The information obtained can be effectively used in the apiary industry as well as to determine the quality of the honey sample.
The methods of Melissopalynology were provided by the ICBB (International Commission for Bee Botany) [1]. Honey is characterized based on its physico-chemical and biological properties[2]. Thus, the quality of honey can be determined by its sensorial, physical, chemical and microbiological characteristics. However, it is influenced by a number of factors such as bee species, flora, environmental factors like climate and seasonal conditions etc., and treatment of honey during extraction and storage [3]. Honey is the only naturally occurring sweet available commercially, consisting approximately 35-40% of Levulose, 30-35% of Dextrose, 18-20% of Moisture, 4% of Maltose. They also include vitamins, carotenes,xanthophylls, anthocyanin, tannin and colloidal particles.
The current work was undertaken to characterize 5 commercial honey samples available in India based on their physico-chemical properties. The analysis includes moisture content, pH, electrical conductivity, acidity, total sugars, reducing and non-reducing sugars. The absolute pollen count of the honey samples was also determined and graded as per the Indian Standard specifications [4].
Materials and Methods
Four commercially available honey samples were obtainedfrom the local market of Hyderabad, Telangana State and one fromBangalore, Karnataka State India. These constitute the principlematerial of the present study. Of the 5 samples, four - Lio (Figure 1e), Apo (Figure 1d), Dab (Figure 1c) & Fet (Figure 1b) are available

Figure 1: Honey samples.
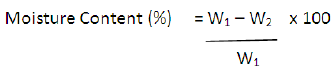
Where, W1= Weight of porcelain dish + fresh weight of sample and W2= Weight of porcelain dish + dry weight of the sample.
pH: 10 g each of the honey samples was diluted in 75 ml of distilled water and the pH was measured using a pH meter. The pHmeter (Elico pH meter) was calibrated using standard buffers of pH 4 and pH 9 before measuring the pH of the samples.
Electrical conductivity: It was determined using conductivity meter (Elico Conductivity meter) for the solution containing 5 g of each of the honey samples dissolved in 37.5 ml distilled water.
Acidity: 1 g of each of the honey samples were dissolved in 7.5 ml of distilled water. It was then titrated against standard sodium hydroxide (0.05 N) solution using 1-2 drops of phenolphthalein indicator till pink colour appears and persists at least for 10 sec.
Acidity % = (0.23 x volume of sodium hydroxide required for titration)/mass in grams of the honey sample taken for the test (1 g).
Total Sugars
The total sugars in the honey samples were estimated usinganthrone method (Figure 2) [5].
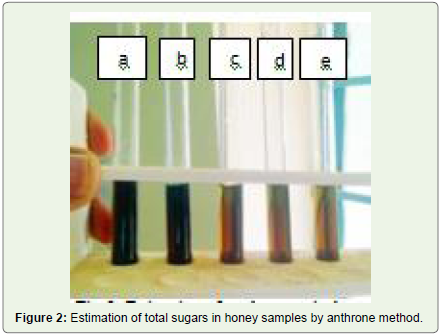
Figure 2: Estimation of total sugars in honey samples by anthrone method.
Sugar in the presence of sulphuric acid gets dehydrated to furfuralor hydroxymethylfurfural, which later react with anthrone (dihydrooxanthrancene) to yield a bluish-green color complex that has an absorption maximum at 620 nm.
Reducing sugars
It was estimated using Dinitrosalicylate (DNS) method [5].
Non-reducing sugars
It was calculated as -
Amount of Total Sugars - Amount of Reducing sugars.
Results and Discussion
The colour of the honey samples ranges from amber to dark amber. Colour depends on various parameters such as the mineral content, phenolic compounds and the pollen content in the honey sample as well as its origin and floral varieties. Colour change may also result due to storage temperature & the duration of storage (Figure 1,Table 1).
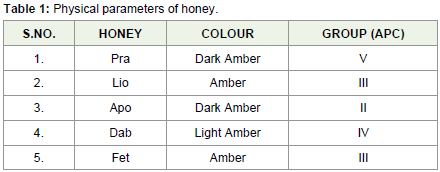
Table 1: Physical parameters of honey.
Based on the absolute pollen count (APC), Apo sample is included in group II with APC of 1,00,000/10 g, Lio and Fet are in group III withAPC of 4,00,000/10 g and 2,00,000/10 g respectively, Dab in groupIV APC of 10,00,000/10 g and Pra in group V APC of 11,00,000/10 g(Table 1).
Physico-chemical analysis
Moisture content: The moisture content of all the honey samples were much below 20% maximum value allowed by Codex standards,(Table 2) [6]. Such results were also observed by [7].
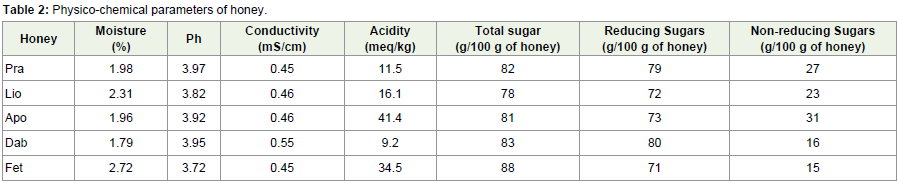
Table 2: Physico-chemical parameters of honey.
Of the five honey samples, 3 samples (Pra, Apo and Dab) had moisture content below 2%, while Lio and Fet had above 2% moisture content.
This low moisture content is indicative of the time of extraction of honey with respect to the maturity/ripening process of the honey, climatic factors, and storage conditions.
The low moisture content also prevents fermentation of honey and attack by microorganisms. This helps in its preservation and storage and increases the shelf life of the honey [7].
pH: The pH values of all the samples studied were similar ranging between 3.7 and 3.9 (Table 2), which falls within the limits of the international standards. This low pH inhibits the growth of microorganisms and influences the texture and stability of the honey sample [8]. The acidity of the honey sample may be due to the presence of organic acids such as gluconic acid and also due to phosphate and chloride ions [9].
Electrical conductivity: It depends on the concentration of mineral salts, organic acids and proteins. All the honey samples in the present study showed electrical conductivity values of 0.45 mS/cm or 0.46 mS/cm except Dab which showed 0.55 mS/cm (Table 2). This is indicative that all the honey samples have a similar floral origin.
Acidity: The free acidity of the sample studied ranged from 9.2 meq/kg in Dab sample to 41.4 meq/kg in Apo sample (Table 2) which is less than 50 meq/kg allowed by Council Directive of the European Union [10]. The variation in the acidity among the honey samples studied may be due to the difference in their harvest season [11]. Low acidity value is indicative the freshness of honey sample while high acidity indicates fermentation of sugars into organic acids.
Sugars: Sugars represent the carbohydrate content of the honey samples. With respect to reducing sugars, the values ranged from 71 g/100 g of honey in Fet sample to 80 g/100 g of honey in Dab sample (Table 2). The values obtained are above the minimum value (60 g/100 g) recommended by Council Directive of the European Union [10]. However, the values of non-reducing sugars for all the honey samples in the current study were much higher (Table 2) than the stipulated ≤ 5 g/100 g by Council Directive of the European Union [10]. High sucrose content in the samples may be due to early harvesting as sucrose is not converted to fructose and glucose [12].
Conclusion
The study also showed that all the honey samples could have agood shelf life due to their low moisture content. Similar pH values are indicative of similar texture and stability of the honey samples under study. Based on their electrical conductivity values, it can be concluded that all the honey samples had similar floral origin. However botanical studies of the samples could give the exact floral varieties in the honey samples.
References
- Louveaux J, Maurizio A, Vorwohl G (1978) Methods of melissopalynology. Bee World 51: 125-138.
- Gomes S, Dias LG, Moreira LL, Rodrigues P, Estevinho L (2010) Physico-Chemical, microbiological and antimicrobial properties of commercial honeys from Portugal. Food Chem Toxicol 48: 544-548.
- Iglesias A, Feas X, Rodrigues S, Seijas JA, Vázquez-Tato MP, et al. (2012) Comprehensive study of honey with protected denomination of origin and contribution to the enhancement of legal specifications. Molecules 17: 8561-8577.
- IS 8464 (1977) Indian Standard Specification for squeezed honey. Indian Standard Institution.
- Beedu Sashidhar Rao and Vijay Deshpande (2005) Experimental biochemistry: A student companion, 1/e. I.K. International Publishing House Pvt. Ltd pg 316.
- FAO and WHO (2001) CODEX STAN 12-1981: Codex Standard for Honey. Codex Alimentarius Commission.
- Omafuvbe BO and Akanbi OO (2009) Microbiological and physico-chemical properties of some commercial Nigerian honey. Afr. J. Microbiol. Res 3: 891-896.
- Baroni MV, Arrua C, Nores ML, Faye P, Diaz MDP, et al. (2009) Composition of honey from Córdoba (Argentina): Assessment of North/South provenance by chemometrics. Food Chem 114: 727-733.
- Nanda V, Sarkar BC, Sharma HK, Bawa AS (2003) Physico-chemical properties and estimation of mineral content in honey produced from different plants in Northern India. J. Food Comp. Anal 16: 613-619.
- The Council of the European Union (2002) Council Directive 2001/110/EC of 20 December 2001 relating to honey. OJEC L10/47.
- Singh N, Bath PK (1997) Quality evaluation of different types of Indian honey. Food Chem 58: 129-133.
- Azeredo LC, Azeredo MA, Souza SR, Dutra VML (2003) Protein contents and physiochemical properties in honey samples of Apis mellifera of different floral origins. Food Chem 80: 249-254.