Review Article
A Study of Relationship between Dietary Intake, Physical Activity and Obesity among Adults of Age Group 30 to 50 Years
Deepika Sharma*, Illa Joshi and Nimali Singh
Department of Home Science, University of Rajasthan, Jaipur, India
Corresponding author: Deepika Sharma, Department of Home Science, University of Rajasthan, Jaipur, India, Tel: +91-9414628152; Fax: +91-141-2451949; E-Mail: deepikasaraswat05@gmail.com
Citation: Sharma D, Joshi I, Singh N. A Study of Relationship between Dietary Intake, Physical Activity and Obesity among Adults of Age Group 30 to 02 50 Years. Indian J Nutri. 2017;4(1): 152.
Copyright © 2017 Sharma D, et al.. This is an open access article distributed under the Creative Commons Attribution License, which permits unrestricted use, distribution, and reproduction in any medium, provided the original work is properly cited.
Indian Journal of Nutrition | ISSN: 2395-2326 | Volume: 4, Issue: 1
Submission: 06/12/2016; Accepted: 08/02/2017; Published: 10/02/2017
Abstract
Obesity is defined as abnormal or extensive fat accumulation that negatively affects health. According to WHO, obesity is defined as BMI 30 kg/m2 and central obesity as a waist circumference greater than 102 cm in men and 88 cm in women (WHO, 2000). Dietary factors and physical activity patterns strongly influence overweight and obesity among adults and can be considered to be the major modifiable factors. The overall aim of the present study is to compare the dietary factors and physical activity patterns of adults of age between 30 and 50 years. For the present study fifty obese subjects were selected. Out of which 33 were females and 17 were males. The subjects were divided into two age groups i.e. 30-40 years and 41-50 years.
A higher percentage (62 per cent) of subjects was found in the older age group. The findings of the study revealed that 48 per cent females and 22 per cent males were pre obese and 12 per cent male and 6 per cent female subjects were in the category of obesity grade-I, and only 12 per cent female subjects were found in obesity grade-II. The mean waist-hip ratio of female subject was 0.91 and that of male subjects was 0.96. Detail study of the overweight and obese subjects indicated that 84 per cent subjects were vegetarian and only 16 per cent were non-vegetarian by food habits. The consumption of energy rich foods like fats and oils and milk and milk products was high among both male and female subjects. As a result, intake of key nutrients like energy, fats, calcium too wasfound to be more among obese subjects.
Obese subjects spent less energy in their daily lives and the common activities preferred by most of obese subjects were sedentary activities like watching T.V., reading books, socialization and more sitting in working hours. All that leads to a positive energy balance which was the cause of their increased weight.
Introduction
Obesity is a condition resulting from accumulation of excessbody fat. The fat deposition takes place because over a period of time,people consumed diets which provided much more energy than they were able to expend for their metabolism, physical activity and growth.
Overweight and obesity are important clinical and public healthburdens worldwide [1]. Health professionals define “Overweight” as an excess amount of body weight that includes muscles, bone, fat and water. According to Stunkard, 1993, “Overweight refers to increased body weight in relation to height, when compared to some standard of acceptable or desirable weight. Obesity is defined as an excessive high amount of body fat or adipose tissue in relation to lean body mass [2].
According to Dewitt, “Obesity is an abnormal accumulation of body fat usually 20 per cent or more over an individual’s ideal body weight. Obesity is associated with increased risk of illness, disability and death”. For adults, a BMI of 25 or more is considered “Overweight” and a BMI of 30 or more is considered “Obese” [3]. BMI is a simple widely used method for estimating body fat mass. BMI value near 18.5 to 24.9 is the ideal value for us to remain healthy and enjoy a quality life. The following table presents the weight status according to the BMI range [Table 1].
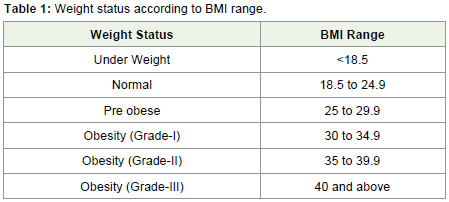
Table 1: Weight status according to BMI range.
Prevalence
Obesity has reached epidemic proportions globally, with at least2.8 million people dying each year as a result of being overweight andobese and globally one in six adults is obese [4]. But today, as standards of living continue to rise, weight gain and obesity are posing a growing threat to health in countries all over the World. Obesity is a chronic disease, prevalent in both developed and developing countries, and affecting children as well as adults. Indeed, it is now so common that it is replacing the more traditional public health concerns, including under nutrition and infectious diseases (WHO, 2000). The prevalence of obesity has nearly doubled between 1980 and 2008. Overall about 13% of world’s population (11% of men and 15% of women) were overweight. In 2014, more than 1.9 billion adults aged 18 years and older were overweight. Of these over 600 million adults were obese [4].
Several studies in India and Worldwide have shown that changes in dietary patterns, physical activity levels and life styles are relatedto increasing frequencies of obesity and the risk of diseases, such ascoronary heart diseases and diabetes.
The worldwide prevalence of obesity nearly doubled between 1980 and 2008. According to country estimates for 2008, over 50% of both men and women in WHO European region were overweight, and 23% of women and 20% of men were obese. Based on the latest estimates in European Union Countries, overweight affects 30-70% and obesity affects 10-30% of adults [4].
A study was conducted to estimate the overall prevalence of overweight and obesity in the world in various regions in 2005 and to project the global burden in 2030. It was found from the data that overall, 23.2% of the world’s adult population in 2005 was overweight (24% men and 22.4% women) and 9.8% men and 11.9% women were obese. The estimated total number of overweight and obese adults in 2005 was 937 million and 396 million, respectively. By 2030, the respective number of overweight and obese adults was projected to be 1.35 billion and 573 million [5].
According to the National Family Health Survey (NFHS), the percentage of married women aged 15-49 years who were overweight or obese increased from 11% in NFHS-2 to 15% in NFHS-3. Under nutrition was more prevalent in rural areas, whereas overweight and obesity were more than three times higher in urban areas. The percentage of women who were overweight or obese was highest in Punjab (30%), followed by Kerala (28%) and Delhi (26%) [6].
WHO (1998), estimates that in developing countries, there are over 200 million adults worldwide who are moderately or severely overweight, of whom 58 million are in developing countries. The WHO report states that the growth in the number of severely overweight adults is expected to double that of underweight adults during 1995-2025 [7].
National Health and Nutrition Examination Surveys (NHANES) conducted by the Centre for Disease Control and Prevention, 2002, currently 64.5 per cent of US adults were overweight and 30.5 per cent were obese. There figures stood at 46.0 per cent and 14.4 per cent respectively during 1976-1980 implying thereby there had been a consistent increase in prevalence of obesity.
A study was conducted by NHANES on the prevalence of overweight and obesity among adults in US, 2003-2004. It shows the prevalence of overweight and obesity had increased sharply for both adults and children. Data from two NHANES surveys show that among adults the prevalence of obesity increased from 15.0 per cent (in the 1976-1980 survey) to 32.9 per cent (in the 2003-2004 surveys).
A project named “Investigation of Current Prevalence, Nature and Etiology of Obesity in Urban Communities” undertaken by Nutrition Foundation of India (NFI), revealed problem of obesity to be more prevalent in the upper-middle class than among slum dwellers. These as against the prevalence rate of obesity of 1 per cent for males and 4 per cent for females in the slums; the corresponding figures for the high income group among the middle class were 32.2 per cent and 50 per cent, respectively. More females than males have been found to be overweight in all age groups in both locations. It was seen that the prevalence of overweight/obesity was higher among age groups exceeding 40 years. The prevalence of obesity (BMI>30) was about 3 per cent in males and about 14 per cent in females above 40 years [8].
Factors Responsible for Obesity
Affluence and abundant availability of food
The increasing variety and the availability of food at all times of the year might be making people eat more. On the other hand, modern life styles mean less time and need for exercise reducing calories expenditure. People are now free to consume whatever they want without restrictions, since they do not have to store or save food anymore.
Dietary habits
Among most city streets, fast food restaurants are on every block;McDonalds, Burger king, Wendy’s, just to name a few. These places provide calories-laden meals often containing enough fat to fulfil an entire day’s allotment. People are particularly vulnerable to these places.
Food industry is also offering a huge amount of reduced-calorie foods and nevertheless, people are still gaining weight. The fact is that they frequently forget that “low calorie” does not mean “no calorie” [3].
Physical activity
Further people are, may be spending more time at work, whichmeans less time for exercise. Additionally, the kind of job the majorityof people perform now a day’s does not translate into much energyconsumption. According to Debrosse, 1997, television is the primaryform of recreation for people. Besides being a passive kind of leisure,people frequently eat while watching T.V [6].
Genetic susceptibility
The role of genetic factors in weight gain and the discovery of a weight reducing hormone (leptin) and its gene (ob) are currently the subjects of much research. Leptin is a circulating hormone producedprimarily in adipose tissues that induces profound changes in hunger and energy homeostasis, presumably through interaction with receptors in the hypothalamus. It is suspected that the deficient of this hormone or its resistance may be responsible for obesity in some people.
Social factors
Social eating is an important aspect of our culture. In India, food is also a reason for people to get together. Our culture’s major events revolve around food. Socializing and celebrating are synonyms witheating [5].
Psychological factors
Another aspect of obesity might be related to the fact that food has become substitute for other missing feelings in people’s lives. Instead of eating to satisfy their bodies, people might be eating to please their emotions. Somer (1995) called it “Emotional eating”, noting that emotional eaters turn to food not because they are hungry, but because they might want to ease their boredom or discomfort with the drawbacks of life [5].
Complications of Obesity
Obesity has become one of the major health problems worldwide. Obesity is not just a cosmetic problem, but lot of health problems and complications are associated with it.
Weight gain is associated with decrease in elasticity of blood vessels and increase heart rate. Excess calories are deposited in body as fat in fatty tissue. This fatty tissue increases demand for oxygen and nutrients which in turn increases amount of blood circulating in the body. More blood travelling through arteries adds pressure.
Obesity is associated with low levels of good cholesterol (HDL) and high levels of bad cholesterol (LDL). When cholesterol levels are high, some of the cholesterol is deposited on the walls of the blood vessels. Cholesterol deposits reduce the elasticity of blood vessels, narrows blood vessels and decreases blood flow. All these changes lead to atherosclerosis and an increased risk of heart disease and stroke.
Atherosclerosis (fatty deposits in arteries) in coronary arteriesreduces blood supply to heart. Decreased blood flow to heart can cause angina and complete blockage of blood flow to heart can cause heart attack.
Atherosclerosis in arteries of brain can reduce blood flow; can result in stroke or paralysis. Obesity and overweight increases the load on the joints such as the knee, hip and lower back. This extra pressure on these joints speeds up the breakdown of cartilage, resulting in joint pain and stiffness. Obesity is associated with increased production of uric acid which can form solid crystal like masses. Uric acid crystalsare deposited in the joints and provoke an inflammatory reaction in joints leading to arthritis. Over weight and excess fat around neck causes narrowing of airways and leads to sleep apnoea.
Obesity increases the risk of developing fatty liver disease due to accumulation of fat in liver. In obesity, excessive cholesterol gets deposited in gall bladder, which can lead to formation of gall stones.
Objectives of the Study
• To assess dietary intake and physical activity pattern of obese and overweight adults between the age group of 30 and 50 years.
• To find out relation between nutritional/non nutritional factors and obesity, if any.
• To compare the nutritional status of male obese and female obese subjects.
Methodology
The study was conducted in one private clinic of Jaipur (Thyroid, Obesity and Endocrinology Centre). This study was conducted on the 50 adult male and female subjects between the age group 30 and 50 years, belonging to middle and high income group families. The study was conducted among 50 adult subjects whose BMI was more than 25. Out of which 17 were males and 33 were females. Thereafter on the basis of BMI cut offs (WHO 1996) subjects were categorized into four groups i.e. pre-obese, obesity grade-I, obesity grade-II and obesity grade-III.
The study was conducted for a period of one year and 2 months. It was conducted in three stages:-
1. Preparation of interview schedule and collection of secondarydata-March, 2008 to May, 2008.
2. Collection of primary data- June, 2008 to September, 2008.
3. Tabulation, analysis of data and writing of report - January,2009 to May, 2009.
Tools and techniques
A detailed interview schedule consisting of 4 parts was prepared for collecting data. The four parts related respectively to general information of the subjects, dietary intake, physical activity, food habits and routine activities. A single tool incorporating all the necessary methods was prepared. Interview schedule was pretested, and required alterations were made before its use in the study of adult subjects. The methods used for the collection of data are:-
1. Direct interviewing the selected subjects.
2. Anthropometric measurements of subjects (weight, height, BMI and waist hip ratio).
3. Dietary and nutrient intake of all subjects using 24-hour dietary recall, over 2 consecutive days.
4. Activity pattern of subjects using 24 hour recall over 1 day.
The first part of interview schedule contained general informationregarding the family and subject which was collected from the subjectsthemselves. Anthropometry is the single most universally applicable,inexpensive and non-invasive method available to assess the size, proportions and composition of the human body (WHO, 1995).
As the present study aims to assess dietary and physical activity pattern of obese subjects, BMI is used as the anthropometric indicator to categorize overweight and obese adults between 30 and 50 years of age.
Body weight is the most commonly used and the simplest reproducible measurement. It indicates body mass, which includes constituents like muscle, bone, fat and water. The weight of subjects (males and females) was recorded using a human weighing machine on the summer clothing condition and without footwear. The height was measured with a vertical measuring rod i.e. anthrop meter.
BMI is a simple index of weight for height that is commonly used to classify under weight, overweight and obesity. It is a mathematical formula based on a person’s height and weight and is defined as the weight in kilograms divided by the square of the height in meters (BMI = kg/m2) [7].
The waist hip ratio is a simple method for distinguishing between fatness in the lower trunk (hip and buttocks) and fatness in the uppertrunk (waist and abdomen area). It is calculated by dividing the waistmeasurements by that of hip measurements [9].
The second part of the interview schedule continued questions on various aspects of food consumption and nutrient intake. The related data was collected from the adult subjects. The detailed dietary profile included 24 hour dietary recall for 2 consecutive days. Diet is vital determinant of health and nutritional status of people. A few questions regarding the food habits and preferences were asked from the subjects in the general questionnaire. Both the qualitative and quantitative methods of dietary enquiry were used to collect data regarding the food intake of subjects.
Statistical analysis
After collection of data, it was tabulated and analysis was done by using different formulas and scales of measurements. The mean, standard deviation and the percentage method was used for anthropometric measurements, nutrient intake and physical activity pattern. The following formulas were used:
Standard Deviation: - σ=Σ2x/N
Percent= X/N 100
Results and Discussions
A total of 50 adults in the age group of 30 to 50 years were selected for the study, out of which 34 per cent were males and 66 per cent were females.
The selected subjects were divided in 2 age groups i.e. 30 to 40 years and 41 to 50 years. From the data, it was found that total number of obese subjects was higher in the older age group (41 to 50 years) i.e. 62 per cent, in comparison to 38 per cent in younger age group. Sex wise comparison further revealed percentage of female obese subjects to be higher in both the age groups, when compared with their male counterparts. The percentage difference being about 27 per cent and 35 per cent in the age-groups, 30 to 40 years and 41 to 50 years respectively. The mean BMI of male subjects was found to be 28.79 kg/m2 and that of female subjects to be 29.29 kg/m2. Itwas found to be almost similar in both male and female subjects. The mean waist hip ratio of male subjects was found to be 0.96 and that mean of female subjects to be 0.91. From the data, it was observed that almost all the female subjects had abdominal obesity.
The mean blood pressure of male subjects was 137/87 mmHg and the mean B.P. of female subjects was 141/82 mmHg. The mean systolic blood pressure was found to be higher among female subjects (114 mmHg) than male subjects (137 mmHg). On the other hand the mean diastolic blood pressure was found to be higher among male subjects (87 mmHg) than their female counterparts (82 mmHg). 35 per cent of male subjects had normal blood pressure (120/80 mmHg) and another of 23 per cent had B.P. (130-139/85-89 mmHg) as indicating pre-hypertension. Out of 17 male subjects 23 per cent had hypertension of stage I (140-159/90-99). Only 12 per cent subjects had stage 2 hypertension (160-179/100-109 mmHg). On the otherhand almost similar percentage of female subjects was found to be in the categories of pre-hypertension and at hypertension stage I. This indicates that obese are at risk of hypertension and other diseases related to it.
Majority of the subjects were vegetarian by food habits. It wasobserved that out of 17 male subjects, 71 per cent were non-smokerand 29 per cent were smoker. Almost half of the subjects wereconsuming alcohol daily and 24 per cent took tobacco more than 3-4times a day. On the other hand no female subject was found to besmoking or consuming alcohol. Only 3 per cent female subjects tooktobacco daily 4-5 times in a day [Table 2].
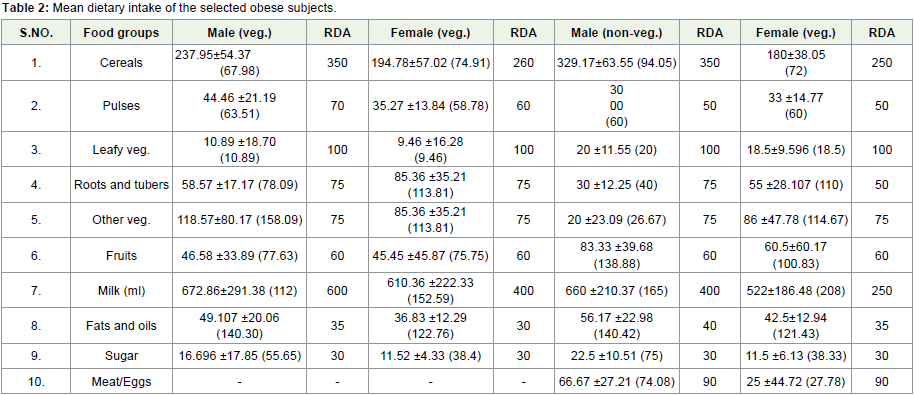
Table 2: Mean dietary intake of the selected obese subjects.
When the mean amount of food groups consumed by the subjects was compared with the RDA value, it was seen that the consumption of many food groups like milk and milk products and fats and oil was found to be higher than RDA in both vegetarian and non vegetarian subjects. Other vegetables intake was also higher in all subjects except in case of non vegetarian male subjects, where it was found to be less than the recommended value mean. On the other hand the consumption of food groups like cereals pulses, leafy vegetables, sugar and meat/eggs was found to be lower than the RDA values among both male and female subjects. Roots and tubers and fruits consumption was also lower in vegetarian male and female subjects than the RDA values.
Comparing the mean intake of different nutrients, consumed by subjects, with the RDA values, it was observed that the consumption of many nutrients like fats, calcium and vitamin C was found to be higher that RDA in both male and female subjects. Protein intake was found to be almost equal to the RDA values [Table 3].
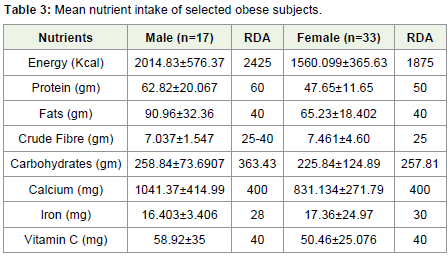
Table 3: Mean nutrient intake of selected obese subjects.
On the other hand consumption of nutrients like energy, fibre, carbohydrates and iron was found to be lower among male and female subjects than their recommended values.
Conclusion
Obesity is a condition resulting from accumulation of excessbody fat. Dietary factors and physical activity patterns strongly influence overweight and obesity among adults. Detailed study of the overweight and obese subjects indicated that the consumption of energy rich foods like fats and oils, milk and milk products was high among both male and female subjects.
Obese subjects spent less energy in their daily lives and all thesubjects had sedentary life-style. The increasing proportion of fat andenergy dense foods in the diet, together with reduction in the level ofphysical activity and rise in the sedentary behaviours are thought to be major contributing factors to the rise in the average body weight and BMI.
Thus healthy lifestyles, combining balanced diets of lower energy density (vegetables, fruits, grains and cereals) with increased levels of physical activity and reduction in sedentary behaviour should be promoted both at an individual level and for society at large.
References
- Kelly T, Yang W, Chen CS, Reynolds K, He J (2008) Global burden of Obesity in 2005 and projections to 2030. Int J Obes (Lond) 32: 1431-1437.
- Stunkard AJ, Wadden TA (1993) Obesity: theory and therapy, 2nd ed. Raven Press, New York, aspen 17: 377.
- WHO (2000) Obesity: Preventing and Managing the Global Epidemic. Report of the World Health Organization Consultation 1-66.
- World Health Organization (WHO) (2012) World Health Statistics. GHO data.
- Somer E (1995) Food Abuse P Eating for the wrong Reasons (citation from “Food and Moodâ€) Cosmopolitan. 218: 162.
- (2012) The national family health survey (NFHS).
- Nutrition Foundation of India. Investigation of Current Prevalence, Nature and Etiology of Obesity in Urban Communities.
- Cassell JA (1995) Social anthropology and nutrition: a different look at obesity in America. J Am Diet Assoc 95: 424-427.
- Denver CO (1997) America’s weight crisis the Country’s waistline is growing, and there’s no ‘Magic’ pill in sight. (Spotlight on Health & Fitness). Rocky Mountain News.