Research Article
Assessment of Nutritional Status of School Going Adolescents in Fatehabad District of Haryana
Nisha Rani1 and Varsha Rani2*
Department of Foods and Nutrition, Chaudhary Charan Singh Haryana Agricultural University, Hisar, Haryana, India
Corresponding author: Varsha Rani, Department of Foods and Nutrition, Chaudhary Charan Singh Haryana Agricultural University, Hisar, Haryana, India, Mobile: +919466648998; Email: varshadangi@gmail.com
Citation: Rani N, Rani V. Assessment of Nutritional Status of School Going Adolescents in Fatehabad District of Haryana. Indian J Nutri. 2016;3(2): 146.
Copyright © 2016 Nisha Rani et al. This is an open access article distributed under the Creative Commons Attribution License, which permits unrestricted use, distribution, and reproduction in any medium, provided the original work is properly cited.
Indian Journal of Nutrition | ISSN: 2395-2326 | Volume: 3, Issue: 2
Submission: 23/08/2016; Accepted: 29/09/2016; Published: 06/10/2016
Abstract
considered a low risk group for poor health and nutrition and often receive scant attention. Two hundred school going adolescents (13-17y), comprising equal number of male and female and rural and urban adolescents were selected from the Fatehabad district. Nutritional status of adolescents was assessed in terms of anthropometric measurements and dietary survey. The information on dietary intakes of adolescents was collected using 24h recall method for two nonconsecutive days. Average daily nutrient intake was compared with the Recommended Dietary Allowances (RDA) published by NIN, 2010. Nutrient Adequacy Ratio (NAR) for various nutrients was also calculated. Statistically data was analyzed using SPSS statistical package (version 14.0) for windows. P value less than 0.05 and 0.01 were considered statistically significant. Results showed that as per the scores of BMI for age 13 per cent of adolescents were wasted followed by overweight (8.5%) and as per the scores of height for age 14.5 per cent of them were stunted followed by severely stunted (3.5%). Prevalence of abdomen obesity among boys and girls was 2 and 49 percent, respectively [Table 2]. The boys had significantly (chi-square 7.88; p<0.001) higher prevalence of wasting where as girls had significantly higher prevalence of overweight (chi-square 7.88; p<0.001), stunting (chi-square 6.46; p<0.05) and abdomen obesity (chi-square 27.49; p<0.001). The daily mean intake of energy, protein, calcium, iron, β-carotene, vitamin C and zinc in the diets of adolescents was significantly lower than their respective RDAs. The adolescents (13-17 y) of Fatehabad district were found to be at the risk of double burden of malnutrition they should be provided proper nutrition education.
Keywords: Adolescents; Stunted; Wasted recommended dietary allowances; RDA
Introduction
Nutritional status of adolescents is an important determinant of a nation's health. This stage of life is the foundation of better health of new generation which surpasses through parent generation. Unfortunately adolescents have been considered a low risk group for poor health and nutrition and often receive scant attention. Money and time may be the limiting factors about this concern. Nutritional status of a large number of adolescents can be quickly assessed by anthropometric measurements. Measurements of height, weight,body mass index (BMI), waist circumferences and hip circumferences are the reliable means to evaluate the nutritional status and it is very much in need as large sample size can be assessed and handled easily in less time and money. Estimation of the prevalence of overweight and obesity in population are typically based on BMI. Waist circumference measurement has been proved to be a useful tool for assessing risk for obesity-related diseases such as cardiovascular disease [1]. Waist circumference has been shown to correlate wellwith intra-abdominal fat mass [2], which in turn has been shown to be related to an atherogenic lipoprotein profile [3]. Another fast way of assessing nutritional status of a population is the estimation of dietary and nutrient intake. In present study 24hour recall method was used to collect the dietary information of adolescents. It is an easier, faster, and less expensive way to collect the dietary intake of any population and is less invasive, so that compliance is enhanced. Chances of errors are there in this method due to memory lapse as the subject has to answer about food consumed in the past 24 hours as much as remembered. This was reduced by using a standardized interview protocol that included probing questions and visual aids.
Once information on nutrient intake is collected, it is compared withthe recommended dietary allowances and the adequacy of different nutrients in the dietary intake of population is calculated whichgives an estimation about the nutrients deficiency of sufficiency. TheNational Institute of Nutrition sets new guidelines of recommendeddietary allowances (RDA) based on age, gender and life stage [4]. The United States Department of Agriculture's (USDA) while addressing the dietary guidelines for Americans urge the consumption of nutrient-rich food rather than the intake of supplements to meet these recommendations [5]. There are two stages in life time when eating patterns are established once early in life and second time during adolescence and this is of particular concern since food consumption patterns serve as the basis for nutrient adequacy. Researches done across the countries have shown that adolescents tend to have lower than desirable intakes of fruits, vegetables, dairy products, and whole grains but higher than desirable intakes of soft drinks, confectionery, and fast foods [6-10]. Consequently, many adolescents fall short ofachieving optimal nutrient intakes for good health and development. It is evident that nutrition behaviour pursue from adolescence into adulthood [11]. Therefore, the adoption of healthy nutrition during adolescence has the potential to bestow significant long-term health benefits. Since the ultimate objective of nutritional assessment is the improvement of human health [12], there is a need to develop a database on nutritional status of adolescents so that government and non-governmental agencies can formulate and initiate specific policies and strategies for the well-being of adolescents.
Material and Methods
Study Area and Sample Size
The present study was carried out in Fatehabad district of Haryanastate. Government Senior Secondary School from Dhanger village, Fatehabad and Government Senior Secondary School from Fatehabad city was selected randomly. Two hundred school going adolescents (13-17y) were selected for the study. Out of them 100 students were selected randomly from the rural Govt. Senior Secondary School of Dhanger village, Fatehabad and another 100 students were selected randomly from the urban Govt. Senior Secondary School of Fatehabad city. The proportion of male and female students was assigned equal while selecting the respondents.
Anthropometric Measurements
Prior to the take anthropometric measurements, all procedures were explained to the respondent. Under anthropometric measurements, height (cm), weight (kg), waist circumference (cm) and hip circumference (cm) were measured in duplicate while body mass index and waist to hip ratio were calculated.
Z-score for height-for-age (HAZ-score) and BMI-for age (BAZscore) were calculated using the National Centre for Health Statistics (NCHS) reference data [13] and WHO Anthro Plus software (version 2014). The cut off values of Z-score for height-for-age and BMI-for age have been presented in Table 1. The associations between socioeconomic status and z scores of height for age and BMI for age were also computed.
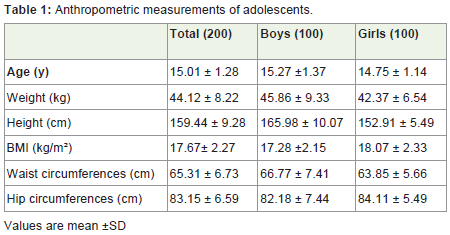
Table 1: Anthropometric measurements of adolescents.
Nutrient intake measurements
The information on dietary intakes of adolescents was collected using 24h recall method for two non-consecutive days. The 24h recall is a method to determine the food intake of an individual during the immediately preceding 24 hours as remembered by the subjects[14]. Cooked foods were getting converted into their raw equivalent. The nutritive value of raw ingredients was calculated using Nutritive value of Indian foods [15]. The nutrient values of these food items were checked for quality by comparing these values with the range of nutrient values from the other food composition tables for the same foods. Mean nutrient intake was calculated by taking mean of the two non-consecutive days intake and compared with Recommenced Dietary allowances [4]. Daily nutrient intake for energy, protein, fat, β-carotene, vitamin C, iron, zinc, and calcium was calculated using VBS Food Calculation System version 4.0 (BaS Nutrition Software, The Netherlands, 2007).
Average daily nutrient intake was compared with the Recommended Dietary Allowances [4]. Nutrient Adequacy Ratio (NAR) was calculated by divided nutrient intake by RDA multiply by 100.
Statistical Analysis
Statistically data was analyzed using SPSS statistical package (version 14.0) for windows. Means of age, height, weight, BMI, waist and hip circumferences were compared area wise (rural vs. urban) using independent sample t-test. Association of gender with prevalence of wasting, stunting, overweight and abdomen obesity was found using chi-square test. P value less than 0.05 and 0.01 were considered statistically significant.
Results
Anthropometric measurements
The mean values of age, weight, height, BMI, waist circumferencesand hip circumferences recorded for boys were 15.27y, 45.86 kg, 165.98 cm, 17.28 (kg/m2), 66.77 cm and 82.18 cm, respectively [Table 1]. The values of same parameters in girls were 14.75y, 42.37kg, 152.91cm, 18.07(kg/m2), 63.85cm and 84.11cm, respectively. The boys had significantly (p<0.01) higher values of weight, height and waist circumferences than girls, whereas the girls had significantly (p<0.05) higher values of BMI and hip circumferences.
Prevalence of wasting, stunting, overweight andabdomen obesity
The z scores of BMI for age showed that out of 200 adolescents 13 percent were wasted followed by overweight (8.5%). The rest of the adolescents (78.5%) were found to be normal. Prevalence of wasting and overweight in boys was 15 and 3 percent, respectively. The prevalence of wasting and overweight however, in girls was 11 and 14 percent, respectively. The z scores of height for age showed that out of 200 adolescents 14.5 percent were stunted followed by severely stunted (3.5%) [Table 2]. The rest of the adolescents (82%) were found to be normal. The prevalence of stunting and severely stunting in boys was 1 and 2 percent, respectively. The prevalence of stunting and severely stunting however in girls was 19 and 5 percent, respectively. The analysis of waist to hip ratio showed that out of 200 adolescents 25.5 percent were at the risk of abdomen obesity. The rest of the adolescents (74.5%) were found to be normal. Prevalence of abdomen obesity among boys and girls was 2 and 49 percent, respectively [Table 2]. The boys had significantly (chi-square 7.88;p<0.001) higher prevalence of wasting where as girls had significantlyhigher prevalence of overweight (chi-square 7.88; p<0.001), stunting(chi-square 6.46; p<0.05) and abdomen obesity (chi-square 27.49; p<0.001).
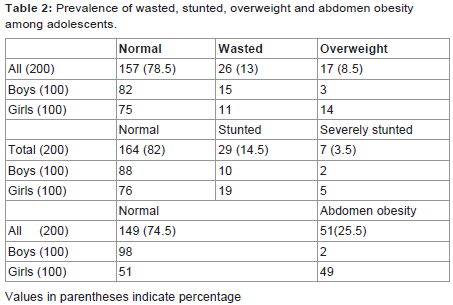
Table 2: Prevalence of wasted, stunted, overweight and abdomen obesity among adolescents.
Nutrient intake
Daily mean intake of energy, protein, calcium, iron, β-carotene,vitamin C and zinc was significantly lower than their respective RDAs in the diets of both the male and female adolescents of both the age group (13-15y and 16-17y). However, the daily mean intake of fat was found to be higher than their respective RDAs [Table 3,Table 4]. The results of the nutrient adequacy ratio revealed that majority of the adolescent had marginally adequate intake of energy (58.5%), marginally inadequate intakes of protein (46.5%), adequate intakes fats (51%), marginally inadequate intakes of calcium (38%), inadequate intakes of β-carotene (50%), inadequate intakes of vitamin C (35.5%) and inadequate intakes of zinc (86%) [Table 5].
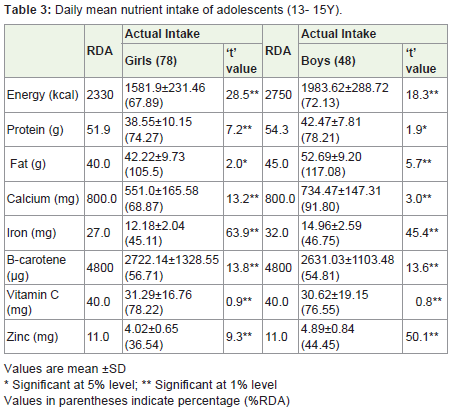
Table 3: Daily mean nutrient intake of adolescents (13- 15Y).
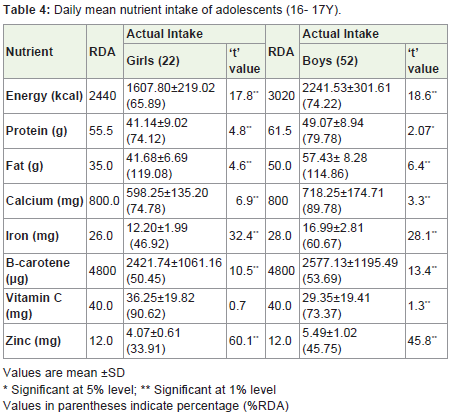
Table 4: Daily mean nutrient intake of adolescents (16- 17Y).
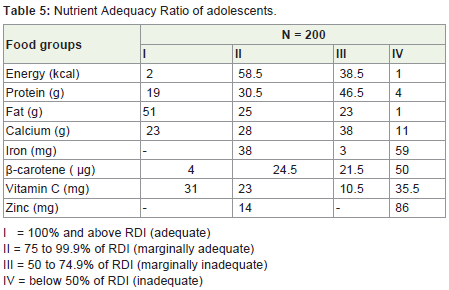
Table 5: Nutrient Adequacy Ratio of adolescents.
Discussion
The poor nutritional status of the adolescents, particularly girls, has important implications in terms of physical work capacity andadverse reproductive outcomes. These delicate consequences of under nutrition among adolescence were subsequently confirmed by the other researchers in different Indian communities [16].Venkaiah et al. reported about 39.0 per cent of the rural adolescents to be stunted. However, low prevalence of stunting has also been reported in the existing literature [17]. Malhotra and Passi reported the prevalence of stunting to be 29.7 per cent among rural adolescent girls in North India. The basic reason behind stunting indicates the long term cumulative inadequacies of health and nutrition and aninsufficient intake of nutrients during the early stage of childhood [18]. It had been opinioned by Measham and Chatterjee that one of the key causes of under nutrition among Indian communities is the lack of access to insufficient foods and resource amenities [19]. The prevalence of lower nutritional status among girls is another well known and accepted fact in almost every Indian community [18,20].Numerous studies have already been documented the discriminationsmade against the girl child in India [21,22]. It has also been observed in case of thinness that adolescent boys were more affected than adolescent girls (59.4% versus 41.3%) [20]. The poor nutrients intake of adolescents may be due to non availability of diversified foods and low purchasing capacity of the study population. The other possible reason may be the poor nutritional knowledge and ignorance among the adolescents. It is difficult to compare these findings with earlier studies due to differing study methods. However, the patterns we identified showed some similarities with previous work among adolescents. In a previously conducted study among school going post- pubescent girls (n=208) from Namakkal district of Tamil Nadu, mean per day calorie intake was observed as 1905 Kcal against the RDA of 2060 Kcal. The percent adequacy for protein and calcium ranged between 80-90 per cent; whereas for iron percent adequacy varied between 60-65 per cent. Other studies among adolescent girls in the country have also reported lower consumption of most of the micronutrients especially iron with respect to RDA being carbohydrates the main source of energy [23-27].
Conclusion
It may be concluded that adolescents (13-17 y) of Fatehabad district were found to be at the risk of poor nutritional status. Besides low consumption of nutrients, 13 percent of the adolescents were wastedand 25.5 percent of them were found to be at the risk of abdomen obesity, which represented the double burden of malnutrition among them. The boys had significantly higher prevalence of wasting whereas girls had significantly higher prevalence of overweight, stunting and abdomen obesity. Daily mean intake of energy, protein, calcium, iron, β-carotene, vitamin C and zinc except fat was significantly lower than their respective RDAs in the daily diets of both the male and female adolescents of both the age group. The daily mean intake of fat was found more than their respective RDAs. Since balanced nutrients intake play significant role in overall health and as adolescence is the important stage of human life they should be strengthen with the proper nutrition education or nutritional counseling.
References
- Lemieux I, Pascot A, Couillard C, Lamarche B, Tchernof A, Almeras N,et al. (2000) Hypertriglyceridemic waist: A marker of the atherogenicmetabolic triad (hyperinsulinaemia; hyperapolipoprotein B; small denseLDL) in men? Circulation 102: 179- 184.
- Lean MEJ, Han TS, Morrison CE (1995) Waist circumferencemeasurement as a measure for indicating need for weight management.BMJ 311: 158-161.
- Han TS, Van Leer EM, Seidell, Lean MEJ (1995) Waist circumferenceaction levels in the identification of cardiovascular risk factors: prevalence study in a random sample. BMJ 311:1401-1405.
- NIN (2010) Dietary Guidlines for Indians 2nd Edition-A manual, National Institute of Nutrition, Hyderabad, India.
- USDA (2010) U.S. Department of Agriculture and U.S. Department of Health and Human Services, Dietary Guidelines for Americans 2010, 7th ed.; U.S. Government Printing Office: Washington, DC, USA.
- Neumark SD, Story M, Resnick MD, Blum RW (1996) Correlates ofinadequate fruit and vegetable consumption among adolescents. PrevMed 25: 497-505.
- Munoz KA, Krebs-Smith SM, Ballard-Barbash R, Cleveland LE(1997) Food intakes of US children and adolescents compared withrecommendations. Pediatrics 100: 323-329.
- Magarey A, Daniels LA, Smith A (2001) Fruit and vegetable intakes of Australians aged 2-18 years: an evaluation of the 1995 National Nutrition Survey data. Aust N Z J Pub Health 25: 155-161.
- Harnack L, Walters SA, Jacobs DR (2003) Dietary intake and foodsources of whole grains among US children and adolescents: data fromthe 1994-1996 Continuing Survey of Food Intakes by Individuals. J AmDiet Assoc 103: 1015-1019.
- Yngve A, Wolf A, Poortvliet E, Elmadfa I, Brug J, et al. (2005) Fruit andvegetable intake in a sample of 11-year-old children in 9 Europeancountries: the Pro Children Cross-sectional Survey. Ann Nutr Metab 49:236-45.
- Lake AA, Mathers JC, Rugg-Gunn AJ, Adamson AJ (2006) Longitudinalchanges in food habits between adolescence (11-12 years) andadulthood (32-33 years): the ASH30 study. J Pub Health 28: 10-16.
- Fryar CD, Gu Q, Ogden CL (2012) Anthropometric reference data forchildren and adults: United States, 2007-2010. National Center forHealth Statistics. Vital Health Stat 11(252): 5-25.
- WHO (1995) Physical Status. The use and interpretation ofanthropometry. Technical Report Series No. 854. Geneva: World HealthOrganization.
- Den HA, Van SW, Brouwer ID (2006) Food habits and consumption in developing countris. Manual for file studies. Wageningen: wageningen Academic Publisher.
- Gopalan C, Ramasastri BV, Balasubramanian SC (2001) Nutritive value of Indian Foods. National Institute of Nutrition, Indian Council of Medical Reasearch, India.
- Alam N, Swapan KR, Ahmed T, Shamsir Ahmed AM (2010) Nutritionalstatus, dietary intake, and relevant knowledge of adolescent girls in rural Bangladesh. J Health Popul Nutr 28: 86-94.
- Venkaiah K, Damayanti K, Nayak M U, Vijayaraghavan K (2002) Dietand nutritional status of rural adolescents in India. Eur J Clin Nutr 56:1119-1125.
- Malhotra A, Passi SJ (2007) Diet quality and nutritional status of ruraladolescents girl beneficiaries of ICDS in north India. Asia Pac J ClinNutr 16: 8-16.
- Measham AR, Chatterjee M (1999) Wasting Away: The crisis of malnutrition in India.Washington D C: The World Bank.
- Medhi GK, Hazarika NC, Mahanta J (2007) Nutritional status of adolescents among tea garden workers. Indian J Pediatr 74: 343-7.
- Borooah VK (2004) Gender bias among children in India in their diet and immunization against disease. Soc Med 58: 1719-31.
- Devendra K (1995) Girl child in rural India. Soc Change 25: 189-96.
- Parimalavalli R, Sangeeta M (2011) Anthropometric measurements and nutrient intake of adolecents girls. Anthropologist 13: 111-115.
- Maliye CH, Deshmukh PR, Gupta SS, Kaur S, Mehendale AM, et al.(2010) Nutrient intake amongst rural adolescent girls of Wardha. Ind JComm Med 35: 400-402.
- Sharma AK, Shukla D, Kannan AT (2005) Calorie and protein intake and its determinants among adolescent school girls in Delhi. Ind J Comm Med 30: 8-10.
- Saibaba A, Mohan Ram M, Rao GVR, Devi U, Syamala TS (2002)Nutritional status of adolescent girls of urban slums and the impact ofIEC on their nutritional knowledge and practices. Ind J Comm Med 27:151-56.
- Tatia R, Taneja P (2003) Dietary intakes of tribal adolescent girls of Duar District in Madhya Pradesh. Ind J Nutr Diet 40: 344-347.