Research Article
Prevalence of Anemia, Sub-clinical Vitamin D and Vitamin A Deficiencies and its Relationship with Anthropometric Measures and Diet Pattern among Urban South Indian Preschool Children
Sumithra Selvam1*, Sumathi Swaminathan2, Srinivasan K3, Anura V Kurpad4
1Division of Epidemiology and Biostatistics, St. John's Research Institute, St. John's National Academy of Health Sciences, Koramangala, Bangalore, India
2Division of Nutrition, St. John's Research Institute, St. John's National Academy of Health Sciences, Koramangala, Bangalore, India
3Department of Psychiatry, St. John's Medical College and Hospital, St. John's National Academy of Health Sciences,Koramangala, Bangalore, India
4Department of Physiology, St. John's Medical College, St. John's National Academy of Health Sciences, Koramangala, Bangalore, India
Corresponding author: Sumithra Selvam, Division of Epidemiology and Biostatistics, St. John's Research Institute, St. John's National Academy of Health Sciences, Koramangala, Bangalore : 560 034, India, Phone Number: +918049467000, Fax Number: +918025501088; E-mail: sumithrars@sjri.res.in
Citation: Selvam S, Swaminathan S, Srinivasan K, Kurpad AV. Prevalence of Anemia, Sub-clinical Vitamin D and Vitamin A Deficiencies and its 02 Relationship with Anthropometric Measures and Diet Pattern among Urban South Indian Preschool Children. Indian J Nutri. 2016;3(2): 142.
Copyright © 2016 Sumithra Selvam et al. This is an open access article distributed under the Creative Commons Attribution License, which permits unrestricted use, distribution, and reproduction in any medium, provided the original work is properly cited.
Indian Journal of Nutrition | ISSN: 2395-2326 | Volume: 3, Issue: 2
Submission: 30/08/2016; Accepted: 16/09/2016; Published: 23/09/2016
Abstract
Objectives: Anemia and deficiencies of certain micronutrient such as iron, vitamin A and D have long lasting effect on growth and development in preschool children. The present study was carried out to study the prevalence of anemia, vitamin A and D deficiencies and to assess their relationship with anthropometry and dietary pattern among pre-school children in urban South India.
Methods: This study was nested within a larger longitudinal study to assess the developmental milestones of a cohort of preschool children. Children from urban Bangalore (N=249) aged 3-4 years where parents consented to collection of blood were recruited from play schools, nurseries and kindergarten between 2010 and 2011. Data on food intake, anthropometric measures and biochemical parameters were collected after 1 year of follow up.
Results: Prevalence of anemia and vitamin A were 64% and 2.1% respectively while Vitamin D deficiency and insufficiency occurred in 48% and 23% of children with no significant difference observed between genders and SES categories. A significant positive correlation was observed between Hb levels with height (r=0.18) and weight (r=0.13) for age Z scores. Fifty percent of the study children had risk of inadequate intake of iron. Mean intakes were lower in the anemic as compared to non-anemic children. Children who were stunted were 3.7 times more likely to be anemic as compared to non-stunted children.Increased iron intake was an independent predictor of higher Hb levels.
Conclusion: Anemia and vitamin D deficiencies were high among urban preschool children.Anemia and micro-nutrient deficiencies were not only a public health significance of rural but also in urban preschool children.
Keywords: Anemia; Vitamin D deficiency; Stunted; Diet; Urban Preschool children
Introduction
Micronutrient deficiencies (MND), such as iron, vitamin A and D deficiencies, among children under 5 years are major nutritionalproblems in developing countries [1]. These contribute to growth retardation, morbidity, neurological deficits and reduced cognitive and working capacities in children [2,3]. Although overt clinical deficiency signs (other than anemia for iron deficiency) are not clearly evident in developing countries like India, sub-clinical deficiencies persist. For example, the reported prevalence of sub-clinical vitamin A deficiency among rural preschool children in India was 62% [4].Severely stunted children also presented with low serum levels ofretinol [5], suggesting that multiple micronutrient deficiencies contribute to growth retardation. Supplementation with multiple micronutrients rather than single nutrients have also resulted in a significant increment in height in pre-schoolers [2,6].
The probable cause of most of these micronutrient deficiencies among children is an inadequate intake of micronutrient dense foods due to poor quality of diets, low intake of iron from complementary foods, frequent episodes of infection, poor absorption of nutrients, an increased requirement or a combination of these factors [7,8]. Sub-optimal feeding practices beginning from the period of infancy particularly in India, where complementary foods that are usually monotonous and largely cereal based with minimal nutrients provided from animal foods [9], probably contribute to these deficiencies. Such a dietary pattern is likely to track through to the preschool years. The National Nutrition Monitoring Bureau (NNMB, 2002) reports that more than 70% of rural preschool children consume less than 50% of the recommended dietary allowances (RDA) of iron, vitamin A and riboflavin free folic acid, vitamin C, thiamin and niacin. Regional level data from Punjab, also indicated that the deficit dietary intake in rural preschool children was about 58% for vitamin A, 33% for iron, 29% for riboflavin [10].
The association of sub clinical deficiencies with nutrient intake and growth in urban preschool children in India has not been explored earlier. In the present study, the prevalence of anemia, vitamin A and D deficiencies among preschool children was assessed and therelationship of these deficiencies with anthropometric measures anddietary pattern among pre-school children in urban South India was examined.
Materials and Methods
This study was nested within a larger longitudinal study to assess the developmental milestones of a cohort of 412 preschool children(2-2.9 years) followed every 6 months till 5 years of age. Children wererecruited from play schools, nurseries and kindergarten. The presentanalysis is of 249 children aged 3-4 years from urban Bangalore whereparents consented to collection of blood and was conducted between 2010 and 2011. Data on food intake, anthropometric measures and biochemical parameters were collected after 1 year of follow up. Socio-demographic information on parental education, occupation and income were collected using a structured questionnaire (94.4% parents, 5.6% caregivers), socio-economic status was assessed by the Kuppuswamy’s socioeconomic status scale [11]. Kuppuswamy scale is a composite score which yields a total score of 3-29 and classifies the study populations into high, middle, and low SES. Informed parental consent was obtained. This study was approved by the institutional ethical committee of St. John’s Medical College and Hospital.
Blood biochemistry
Blood samples were collected by a trained phlebotomist. Wholeblood was analysed for haemoglobin within an hour of blood collection. Hemoglobin (Hb) concentrations were measured using ABX Pentra 60 C+ hematology analyzer (HORIBA, Japan) by the Spectrophotometry method. Biorad trilevel hematology controls are used as quality control. The serum samples were separated, aliquoted and stored at -80 °C until analysis of serum retinol and total vitamin D. Vitamin D (total 25-hydroxy vitamin D2 and D3) was analyzed by ELISA kit method (DIA source). Serum retinol was measured using High performance liquid chromatography (HPLC) method (SHIMADZU, Japan). ClinChek serum controls recommended by ClinRep were used as quality control. The coefficients of variation for the assays were 0.18 % for Hb, 3% for Vitamin D, and 4.9% for Vitamin A.
Anemia was defined as Hb < 11 g/dl in children aged 6-59 months of age (severe anemia was defined as Hb lower than 7 g/dl) by theWorld Health Organization 2001 [12]. A serum 25(OH)-D value of >50 nmol/L (20 ng/ mL) was taken to be indicative of vitamin D sufficiency, 50-37.5 nmol/L as vitamin D in-sufficiency and values ≤37.5 nmol/L (15 ng/mL) as deficiency [13]. Vitamin A deficiency was defined as serum retinol value below 20 μg/dL (0.70 mmol/L).
Anthropometry
All the anthropometric measurements were made by a trainedperson. Height was measured using a portable stadiometer to the nearest 0.1cm. Weight was measured in minimal clothing using a digital weighing scale to the nearest 0.1 kg. The mid-upper arm circumference (MUAC) was measured using a fibre tape, to the nearest 0.1 cm. Biceps, triceps, subscapular and supra-iliac skinfold thickness were measured to the nearest 0.2 mm using the Holtain calipers. World Health Organization Anthro software 1.0.2 version was used to compute the age and sex standardized scores for height (HAZ), weight (WAZ), MUAC (MUACZ), triceps (TSFZ) and subscapular skinfold (SSFZ).
Dietary assessments
Dietary intake of each child was obtained by administering a single 24hr dietary recalls to mothers. Portion sizes were estimated with the aid of standard weights and household measures to quantify the portion size of the food items consumed. The mean nutrient and food group intake was computed using a nutrient database developedat St. John’s Research Institute [14]. The intake of the food groups (cereals, pulses, green leafy vegetables, milk and milk products) were computed using the raw amounts used in the recipes andlinking it to individual intakes. Iron and protein requirement for each child was computed. The iron requirement for each child was computed based on weight and adjusted for bioavailability factor of 5% as recommended [15]. The risk of inadequacy for protein, iron and B vitamins were defined using age specific Estimated Average Requirements cut point method (IOM) [16].
Statistical methods
Descriptive statistics were reported using mean and standard deviation for all the normally distributed continuous variables, while median with 25th and 75th percentiles were reported for the nonnormally distributed variables. Categorical variables were reportedusing number and percentages. Spearman Rank correlation was performed to assess the relationship of Hb, serum retinol and vitamin D levels with, anthropometric measures and micronutrient intakes.Partial correlation was done to assess the relationship between study variables adjusted for socio economic status (SES) and gender. Multiple linear regression analysis was done to assess the factors associated with increased Hb level. All p-values were calculated using two-tailed tests and a value of <0.05 was taken to be significant. Analyses were conducted using the SPSS Inc. Released 2009. PASW Statistics for Windows, Version 18.0. Chicago: SPSS Inc.
Results
The mean age of the children was 37.9 ± 3.2 months and 55% of them were boys. More than half of the mothers (58%) had completed high school education, 26% completed graduation and above and 16% had completed up to middle school. Twelve percent of children belonged to upper SES, 37%, 42% and 8% belonged to upper middle, lower middle and lower SES respectively. Majority of the mothers (81%) were housewives.
The mean hemoglobin level among boys and girls were 10.5± 1.3 g/dL and 10.4 ± 1.2 g/dL respectively. The prevalence of anemia (Hb < 11 g/dl) among children by gender is given in Table 1. Overall prevalence of anemia was 64%, (95% C.I: 58.0, 69.9), with no significant difference between boys and girls. Of those anemic, 54% were mildly anemic (57.6% boys, 46.4% girls) 44% (53.6% boys, 46.4% girls) were moderately anemic and 2% were severely anemic. There was no significant difference in the prevalence of anemia between SES groups.
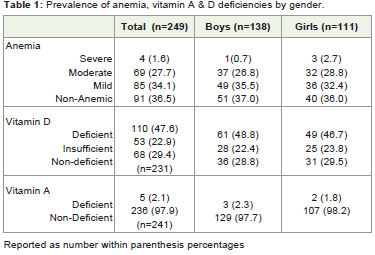
Table 1: Prevalence of anemia, vitamin A & D deficiencies by gender.
The mean serum retinol levels were 0.36 ± 0.08 μg/dL in boys and 0.35 ± 0.07μg/dL in girls, while the overall prevalence of Vitamin A deficiency was 2.1%. The median Vitamin D level among boys and girls were 15.1 ng/mL (11.1, 21.1) and 15.5 ng/mL (11.0, 21.7) respectively with no significant difference between the genders. Vitamin D deficiency was prevalent in 48% (95% C.I: 41.8, 54.2) and vitamin D insufficiency in 23% (95% C.I: 17.8, 28.2) of the children with no significant difference between boys and girls. Vitamin D deficiency among upper, upper middle, lower middle and lower SES status were comparable (79%, 72%, 66% and 70%) respectively. About 89% of the study children had either anemia or a single micronutrient deficiency (Vitamin A /D deficiencies).
Mean anthropometric measurements of boys and girls is given in Table 2. Mean weight, height and waist circumferences were significantly higher (p<0.01) among boys as compared to girls. Approximately 20% were stunted and 17% were underweight. There were no significant differences in hip circumference, MUAC and skin fold measures between boys and girls. While comparing the Z scores by gender there was no significant difference in any of the measures between boys and girls except for subscapular skin fold Z score (p <0.01) which was greater for girls.
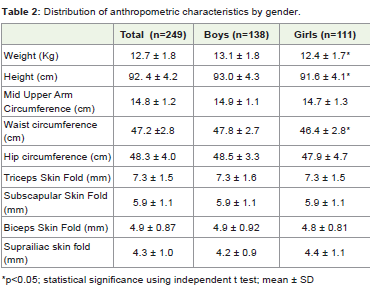
Table 2: Distribution of anthropometric characteristics by gender.
The mean intake of macro- and micronutrients is reported in Table 3 .There was no significant difference in any of the nutrient intakes between boys and girls. However, boys had significantly higher mean intakes for energy, carbohydrate and cereals as compared to girls, after adjusted for weight of the children (p<0.05). Approximately 50% of the study children had risk of in adequate intake of iron and 4% of protein. The risk of inadequate intake of B vitamins such as thiamin, riboflavin, niacin and folate were 16%, 11%, 26% and 19% respectively using EAR cut point method.
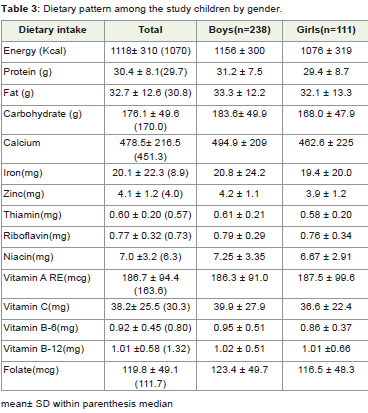
Table 3: Dietary pattern among the study children by gender.
The correlation of hemoglobin levels with serum retinol and vitamin D levels, anthropometric measures and dietary pattern isreported in Table 4. Significant positive correlation was observed between Hb level with height and weight for z scores, even after adjusting for gender and SES (p≤0.01). A significant association was also observed between stunting and anemic status. (Children who were stunted were 3.7 (unadjusted odds ratio) 95% C.I. 1.7, 8.4; p<0.001) times more likely to be anemic as compared to non-stunted children. It was observed that consumption of all nutrient intakes among anemic children were lower than the non-anemic children. Increased intakes of iron, vitamin B3, B6 and folate levels weresignificantly correlated with increased Hb levels. Higher serum retinolwas significantly correlated with higher Hb level. Significant negativecorrelation was observed between Hb level and Vitamin D status.
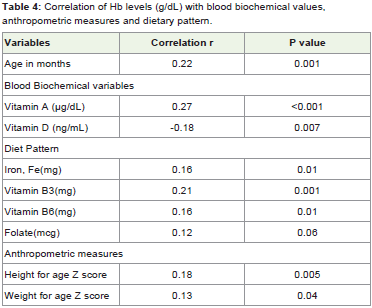
Table 4: Correlation of Hb levels (g/dL) with blood biochemical values, anthropometric measures and dietary pattern.
Increased intake of green leafy vegetable (GLV) was significantly correlated with increased dietary iron (p<0.001). Multivariate analysis after adjusting for age and gender showed that increased iron intake was an independent predictor of increased Hb concentration. In addition, significant negative correlation was observed between serum retinol status and intake of tea and coffee among children. Higher milk and milk product intakes were significantly correlated with higher Vitamin D levels.
Discussion
In general, in this population of urban pre-school children the prevalence of anemia and vitamin D deficiency were high. In thisstudy, the prevalence of anemia is comparable to that reported in NFHS 4 survey. Vitamin D deficiency and insufficiency was high (70%) among these children and is consistent with findings from other studies done among children in urban India [17]. However, the prevalence of vitamin A deficiency using serum retinol was found only among 2% of our study children unlike the recent reported prevalence of 62% obtained from rural children in 8 state surveys, India [18,19]. Higher prevalence of anemia and vitamin D deficiency indicates that it is not only a public health concern of rural or urban slum, it is a critical health issue even among urban preschool children in India, irrespective of economic status.
High prevalence of hypovitaminosis D (Vitamin D deficiencyand insufficiency) was found in urban preschool children irrespectiveof SES in this study with deficiency and insufficiency being 48% and23% respectively. The likely explanation for this could be that most ofthese children resort to indoor rather than outdoor play, which alsoindicates that activity levels are also low. To avoid long term adverseeffect of hypovitaminosis D on bone health, ensuring that childrenare exposed to sun by engaging them in outdoor physical activity isessential [20,21]. Unfortunately this information was not captured in this study. Although it has been reported that Indian school children have a higher prevalence of vitamin D deficiency, there have been no studies conducted among preschool children. Approximately 40-60% of total skeletal mass at maturity is accumulated during childhood and adolescence. We have observed that increased vitamin D levels were significantly correlated with increased milk and milk product intakes although this is not sufficient to increase the blood concentrations to the optimum levels required. Given the importance of Vitamin D for bone health, there is a high need for awareness programs among parents to educate the need for vitamin D sufficiency through engagement in outdoor games and exposure to sunlight.
We have observed that stunted children were ~4 times more likely to be anemic than non-stunted children. This association betweenstunting and prevalence of anemia was seen in studies conducted inEthiopia [22], Brazil [23] and Bangladesh [24]. Probable explanation for this could be that under nourished children are often anemic and the low Hb level has a compromising effect on linear growth [25,26].
Hemoglobin concentration was positively correlated with the dietary intake of vitamins A, B3, B,sub>6
and folate. The role of vitamins such as vitamin A, vitamin B12, riboflavin, folate, vitamin B6 in the production of normal red blood cells, facilitating the mobilization of iron stores and erythropoiesis have been well documented [27]. Although there are no human studies to show these association with niacin, an animal study showed that turkey fed diets with varying levels of niacin along with yeast had higher red blood cells and Hb levels [28] which explains the role of niacin in synthesis of hemoglobin.The mean intakes of B vitamins were comparable to the EAR of the same age group children. Since B vitamin’s intakes were adequatewith the risk of inadequate intakes of B vitamins being relativelylower than that of iron (at a mean intake of 8.9 mg/day), the higherprevalence of anemia is most likely due to iron deficiency. However,one of the limitations of the study is that only one 24 hour recall wasused to assess intakes. Multiple recalls are necessary to obtain a usualintake distribution. However, in spite of this limitation an associationhas been observed.
While examining food intakes, increased intake of GLV was positively correlated with increased dietary iron. A variety of indigenous leaves are available in an urban settings, and diet data showed that majority of the study children consume green leafy vegetables. Hence, from point of view of low cost, practice and feasibility, consumption of GLV would be most inexpensive way of improving the iron status of the young children. Thus, it is essential to give greater emphasis on the need for iron and need to consume a variety of micronutrient rich foods as it impacts on growth and development among preschool children, particularly as aneducational message to parents.
In conclusion anemia and hypovitaminosis D were highly prevalent in urban preschool children. The reduction in vitamin D deficiency can be achieved by encouragement of outdoor activity. The prevalence of anemia was associated with stunting. Both these factors are of great public health significance and need to be tackled effectively through the promotion of appropriate eating habits of children through nutrition education.
References
- Swaminathan S, Edward BS, Kurpad AV (2013) Micronutrient Deficiency and Cognitive and Physical Performance in Indian Children. Eur J Clin Nutr 67: 467-474.
- Rosado JL (1999) Separate and Joint Effects Of Micronutrient Deficiencies on Linear Growth. J Nutr 129: 531S-533S.
- Akhtar S, Ismail T, Atukorala S, Arlappa N (2013) Micronutrient Deficiencies In South Asia - Current Status And Strategies. Trends In Food Science & Technology 31: 55-62.
- NNMB (2006) Prevalence of Vitamin A Deficiency among Preschool Children In Rural Areas. NNMB Technical Report No: 23. NIN, ICMR. Hyderabad, India.
- Marasinghe E, Chackrewarthy S, Abeysena C, Rajindrajith S (2015) Micronutrient Status And Its Relationship With Nutritional Status In Preschool Children In Urban Sri Lanka. Asia Pac J Clin Nutr 24: 144-151.
- Ramakrishnan U, Aburto N, Mccabe G, Martorell R (2004) Multi-Micronutrient Interventions But Not Vitamin A Or Iron Interventions Alone Improve Child Growth: Results Of 3 Meta-Analyses. J nutr 134: 2592-2602.
- Adelekan DA (2003) Multiple Micronutrient Deficiencies in Developing Countries. Nutrition 19: 473-474.
- Asres G, Eidelman AI (2011) Nutritional Assessment of Ethiopian Beta-Israel Children: A Cross-Sectional Survey. Breastfeed Med 6: 171-6.
- Kuriyan R, Kurpad AV (2012) Complementary Feeding Patterns in India. Nutr Metab Cardiovasc Dis 22: 799-805.
- Laxamaiah A, Rao KM, Brahmam GNV, Kumar S, Ravindranath M, et al. (2002) Diet and Nutritional Status of Rural Preschool Children in Punjab. Indian Pediatrics 39: 331-338.
- Kumar N, Shekhar C, Kumar P, Kundu A S (2007) Kuppuswamy’s Socioeconomic Status Scale - Updating For 2007. The Indian Journal Of Pediatrics 74: 1131-2.
- WHO (2011) Haemoglobin Concentrations For The Diagnosis Of Anemia And Assessment Of Severity. Vitamin And Mineral Nutrition Information System. Geneva, World Health Organization.
- Ritu G, Gupta A (2014) Vitamin D Deficiency in India: Prevalence, Causalities and Interventions. Nutrients 6: 729-775.
- Bharathi AV, Kurpad AV, Thomas T, Yusuf S, Saraswathi G, et al (2008) Development Of Food Frequency Questionnaires And A Nutrient Database For The Prospective Urban And Rural Epidemiological (PURE) Pilot Study In South India: Methodological Issues. Asia Pac J Clin Nutr 17: 178-185.
- Nutrient Requirements and Recommended Dietary Allowances For Indians. National Institute Of Nutrition, ICMR. 2009. Hyderabad, India.
- Dietary Reference Intakes: Application in Dietary Assessment. Food And Nutrition Board, Institute Of Medicine, National Academies.
- Ritu G, Ajay Gupta (2014) Vitamin D Deficiency in India: Prevalence, Causalities and Interventions. Special Report. Nutrients 6: 729-775.
- NNMB (2006) Prevalence of Vitamin A Deficiency among Preschool Children in Rural Areas. NNMB Technical Report No: 23. NIN, ICMR. Hyderabad, India.
- WHO (2007) Nutrition, Micronutrient Deficiencies-Vitamin A Deficiency. World Health Organization.
- Balasubramanian S, Dhanalakshmi K, Amperayani S (2013) Vitamin D Deficiency In Childhood - A Review of current Guidelines on Diagnosis and Management. Indian Pediatr 50: 669-675.
- Holick MF (2004) Sunlight and Vitamin D for Bone Health and Prevention of Autoimmune Diseases, Cancers, and Cardiovascular Disease. Am J Clin Nutr 80:1678S-88S.
- Gutema B, Adissu W, Asress Y, Gedefaw L (2014) Anemia and associated factors among school-age children in filtu town, somali region, southeast Ethiopia. BMC Hematol 14: 13.
- Luciana Pedrosa Leal, Malaquias Batista Filho, Pedro Israel Cabral de LiraI, José Natal Figueiroa, Mônica Maria Osório (2011) Prevalence Of Anemia And Associated Factors In Children Aged 6-59 Months In Pernambuco, Northeastern Brazil, Rev Saúde Pública 45.
- Khan JR, Awan N, Misu F (2016) Determinants of anemia among 6-59 months aged children in Bangladesh: Evidence From Nationally Representative Data. BMC Pediatrics 16: 3.
- Soliman AT, Al Dabbagh MM, Habboub AH, Adel A, Humaidy NA, et al (2009) Linear Growth In Children With Iron Deficiency Anemia Before And After Treatment. J Trop Pediatr 55: 324-327.
- Angeles IT, Schultink WJ, Matulessi P, Gross R, Sastroamidjojo S (1993) Decreased Rate of Stunting Among Anemic Indonesian Preschool Children Through Iron Supplementation. Am J Clin Nutr 58: 339-342.
- Fishman SM, Christian P, West KP (2000) The Role of Vitamins in the Prevention and Control of Anemia. Public Health Nutr 3: 125-150.
- Adebowale M Agric, Oso AO, Olowofeso O, Idowu OM, Fafiolu O (2014) Growth Response, Hematological Indices, And Serum Lipid Profile Of Growing Turkeys Fed Diets Supplemented With Niacin and Yeast. The Pacific Journal Of Science And Technology 15: 1.