Research Article
Changes in Lipid Profile and Fasting BloodGlucose in Protease Inhibitor Exposed HIV/AIDSPatients
Ananya Bhowmik1*, Debnath Chaudhuri2, Subhasish Kamal Guha3
1MSc (Food Science and Nutrition), M&E and Research Officer, Pediatric Centre of Excellence in HIV care, Medical collegeand Hospital, Kolkata, West Bengal, India
2Debnath Chaudhuri, Dep’t of Biochemistry and Nutrition, All India Institute of Hygiene & Public Health(Govt. of India), JC-27 &27B, Sector III, Bidhan Nagar, Kolkata - 700 098, West Bengal, India
3Subhasish Kamal Guha, Department of Tropical Medicine & Medical Superintendent cum Vice-PrincipalCalcutta School of Tropical Medicine, West Bengal, India
Corresponding author: Ananya Bhowmik, M&E and Research Officer, Pediatric Centre of Excellence in HIV care, Medicalcollege and Hospital, Kolkata, West Bengal, India, Phone:+918100517024, +919830544071; E-mail: ananya50@gmail.com
Citation: Bhowmik A, Chaudhuri D, Guha SK. Changes in Lipid Profile and Fasting Blood Glucose in Protease Inhibitor Exposed HIV/AIDS Patients. Indian J Nutri. 2016;3(2): 137.
Copyright © 2016 Ananya Bhowmik, et al. This is an open access article distributed under the Creative Commons Attribution License, which permits unrestricted use, distribution, and reproduction in any medium, provided the original work is properly cited.
Indian Journal of Nutrition | ISSN: 2395-2326 | Volume: 3, Issue: 2
Submission: 09/08/2016; Accepted: 03/09/2016; Published: 07/09/2016
Abstract
Background: The national second-line Anti retroviral Therapy (ART) programme was started in Kolkata, India in December 2008. It included a combinationof Tenofovir, Lamivudine and Ritonavir-boosted Lopinavir ± Zidovudine. Dyslipidaemia and increased fasting blood sugar (FBS) often complicate proteaseinhibitor-containing ART. Thus a prospective study was designed to observe the above changes.
Methods: The data of 50 patients, on protease inhibitor for one year, were analyzed. Body Mass Index (BMI), grip strength (GS), Triceps skin fold (TSF),24 hour dietary recall, serum triglyceride (TG), total cholesterol (TC), HDL, LDL, VLDL and FBS were estimated for all patients at baseline, 6 months and afterone year.
Results: There was a significant increase in TG, TC and VLDL levels at 1 year as compared to baseline (p=0.013, 0.00 and 0.00 respectively) whereas LDL significantly increased at 6 months only (p=0.029). HDL decreased significantly at 6 months (p=0.019). TSF significantly decreased both at 6 and 12 months (p=0.00 and 0.00 respectively). The BMI and GS showed a significant increase at both 6 months (p=0.009, 0.000 respectively) and 1 year (p=0.002 and 0.00respectively). Four patients with normal baseline FBG and one with impaired fasting glucose progressed to overt diabetes (FBG ≥ 124 mg/dl) at 12 months. No significant change was noted in energy and protein intake of patients.
Conclusion: There is an increased incidence of dyslipidaemia and unmasking of diabetes related to protease inhibitor in this cohort. There has been animprovement in nutritional status as shown by BMI and GS.
Keywords: Protease inhibitor; HIV/AIDS, Lipid profile; Fasting blood glucose
Introduction
The introduction of effective highly active antiretroviral therapy(HAART) in the mid-1990s led to a marked reduction in morbidityand mortality from human immunodeficiency virus (HIV) infection [1,2]. Effective HAART suppresses HIV RNA to undetectable levels,allowing immune recovery, measured by increases in CD4+ T-cellcounts, in the majority of patients. Metabolic effects of HIV infectionsuch as hypertriglyceridemia are long recognised [3], and side effectsof HAART such as dyslipidemia and insulin resistance were described very soon after its introduction [4]. Use of protease inhibitors (PI)has been associated with dyslipidemia which is more common andmore severe [5,6]. These drugs have been associated with a syndromeof fat redistribution, insulin resistance, and hyperlipidemia. Thisis usually accompanied by some increases in total cholesterol andLDL-C which may be reverted according to some studies [7,5].However, with some PI based therapies, HDL-C levels remain low[7,8], and hypertriglyceridemia may in fact worsen [8], giving riseto a distinctly atherogenic lipid profile [9]. In contrast, initiationof Non Nucleatide Reverse Transcriptase Inhibitor based HAARTregimens has been shown to result in increases in HDL-C along withincreases in total cholesterol, LDL-C and triglycerides (Ref) althoughthe rise of triglyceride is usually not as high as those seen with somePIs [7]. Thismay lead to cardiological manifestations like increasedrates of myocardial infarction arising as a result of dyslipidaemia inHIV-infected patients on antiretrovirals (ARV) [10,11,12] have beenconfirmed by studies such as the D:A:D study-a large, prospective,multi-cohort study that showed associations between exposure toantiretroviral therapy and an increased risk of myocardial infarction[13].
In Indian National ART guideline, launched on 1st April 2004, theinitial first line Antiretroviral Therapy (ART) regimens comprised ofcombinations of Zidovudine/Stavudine, Lamivudine and Nevirapine/Efavirenz and the secondline ART options included a combinationof Tenofovir, Lamivudine and Ritonavir-boosted Lopinavir ±Zidovudine. The national second-line ART programme was startedin School of Tropical Medicine, Kolkata from 1st December 2008.From July 2011 the second line regimen was changed and Lopinavirwas replaced by Atazanavir and zidovudine was no longer used in thesecond line ART.
The initial second line ARV regimen comprised of a combinationof Tenofovir, Lamivudine and Ritonavir-boosted Lopinavir ±Zidovudine. Patients with Hb% ≥ 9 gm/dl used to receive Zidovudineeven if the drug was used in the first line ARV regimen. Dyslipidaemiaand increased fasting blood sugar (FBS) often complicate proteaseinhibitor-containing ART. Thus a prospective study was designed toobserve the above changes.
Methods
All patients starting 2nd line ART for the first time at Antiretroviral Therapy centre, School of Tropical Medicine, Kolkata till July 2011 were enrolled in the study and each patient was followed up for one year. The patients who were diabetic or had deranged lipid profile were excluded from the study. During this time their baseline, six months and one yearly anthropometric, Immunological, virologic and biochemical parameters were tested and recorded. The anthropometric parameters comprised of Body Mass Index (BMI), Grip Strength (GS) and Tricep Skin Fold (TSF), Immunological parameters included CD4 cell count done every 6 months following initition of ART. Viral load testing was done once before initiation of 2nd line and again after six months of treatment and in case the viral load was still detectable after six months it used to be repeated after one year of treatment. Biochemical parameters comprised of serum triglyceride, total cholesterol, High Density Lipoprotein (HDL), Low Density Lipoprotein (LDL), Very Low Density Lipoprotein(VLDL) and Fasting Blood Sugar (FBS). Weight, height and MUACwere recorded using calibrated scale, stadiometer and standardized measuring tape respectively [14]. GS and TSF were measured withgrip strength dynamometer from OG Gileen Company Limited,Japan and Harpenden Caliper respectively [15]. Information ondietary intake was collected by 24 hour recall method and dietarypattern was collected by food frequency questionnaire. 24 h dietaryrecall was taken with the help of ‘katoris’ (bowl), spoons, glasses whichwere standardized with commonly consumed recipes. Standardizedmodels of different prepared food items like chapatti, paratha madeby card board, dhokla, singara ladoo etc made by thermocol or clothwere prepared and used for accurate data collection. Depending on theBody Mass Index (BMI) each patient was classified into underweight(< 18kg/m2), normal weight (18-25kg/m2) and overweight (>25kg/m2)computed with the help of weight and height. Each participant wasclassified as having dyslipidemia if serum lipid levels were above (or,for HDL-c, below) the pre-specified threshold levels. These thresholdlevels were based on the cut-off values in Harrison et al. [16] as follows:hypercholesterolemia - serum TC levels ≥ 250 mg/ dl; low HDL-c -serum HDL-c levels < 40 mg/ dl; high LDL-c - serum LDL-c levels ≥130 mg/dl. Hypertriglyceridemia was defined by serum fasting TGlevels ≥150 mg/dl. Similarly diabetes was defined as FBS ≥ 124 mg/dl.
For statistical assessment, descriptive statistics regarding sociodemographic,epidemiological, clinical, and laboratory values wereevaluated. In order to compare the parameters between baseline with6 months and 1 year, Student’s t-test or one-way analysis of variancefor quantitative variables, with significant level placed at p-value≤0.05 was used. All the tests were done using SPSS 16.
Results
Fifty patients were enrolled in the study. Among them 44 (88%)were men and 6 (12%) were women. The age ranged from 23 to 54years, the median being 37 years. All the patients were from lowersocio-economic background and were residing in the eastern statesof West Bengal, Orissa and Bihar having similar socio demographicprofile. The patients had failed first line treatments regimen(confirmed by virologic failure with plasma HIV RNA > 10,000Copies/ml) as designated by National AIDS Control Organisation(NACO) and among them 3 patients had both immunological as wellas clinical failure. In the present study Tenofovir, Lamivudine andRitonavir-boosted Lopinavir was taken by 38 (76%) patients while12 (24%) patients took Tenofovir, Lamivudine, Ritonavir-boostedLopinavir and Zidovudine. The baseline characteristic have beensummarised in Table 1.
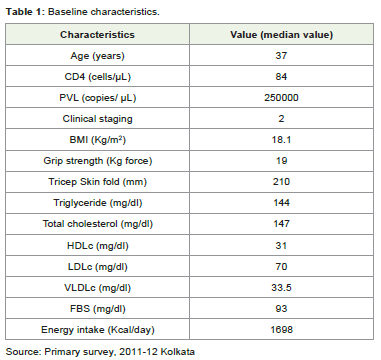
Table 1: Baseline characteristics.
The median values in Table 1 portray very high PVL since thepatients starting protease inhibitor (PI) based regimen have alreadyfailed first line treatment. The rest of the base line characteristics arenormal other than energy intake. It should be noted that the medianenergy intake of men and women taken together is much below theRecommended Daily Allowance (RDA) of even a sedentary womanwhich is 1875 kcal /day.
Hypertriglyiceridemia and Hypercholestrolemia were regularlynoted at 6 months and 1 year of treatment with the percentage of theabove represented in Figure 1. The trend of dyslipidaemia increasedfrom 6 months to 1 year but the HDL improved from 6 months toone year, this change improved the TC: HDL ratio. After one year oftreatment the range of Triglyceride was 110 to 386 mg/dl and that oftotal cholesterol was 214 to 465 mg/dl respectively.
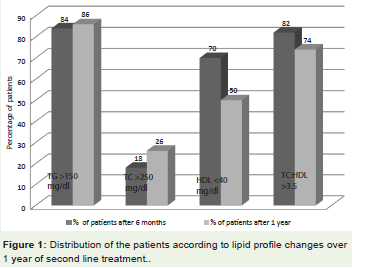
Figure 1: Distribution of the patients according to lipid profile changes over1 year of second line treatment.
As shown in Table 2 there was a significant increase in TG, TCand VLDL levels at 1 year as compared to baseline (p=0.013, 0.00 and0.00 respectively) whereas LDL significantly increased at 6 monthsonly (p=0.029). HDL decreased significantly at 6 months (p=0.019).TSF significantly decreased both at 6 and 12 months (p=0.00 and 0.00respectively) which is suggestive of lipodystrophy accompanied withincreased BMI. The BMI and GS showed a significant increase both at6 months (p=0.009, 0.000, respectively for BMI) and 1 year (p=0.002and 0.00 respectively for GS). Four patients with normal baseline FBG and one with impaired fasting glucose progressed to overt diabetes(FBG ≥ 124 mg/dl) at 12 months. No significant change was noted inenergy intake of patients.
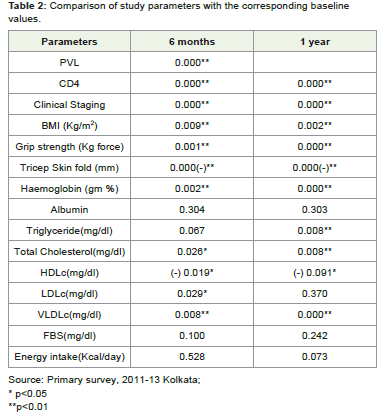
Table 2: Comparison of study parameters with the corresponding baselinevalues.
Discussions
The anthropometric results have shown an indication oflipodystrophy as there was steady decrease in tricep skin foldaccompanied by an increase in grip strength and BMI. This suggestsan increase in muscle mass but a decrease in fat around the triceps.Starting second line ART improved the nutritional status even thoughthere was no significant increase in energy and protein intake. Thismay be due to lessening of the catabolic effect of HIV itself as shownby significant decreased PVL and improvement of immunologicstatus. The lipid profile was significantly deranged which is consistentwith innumerable studies [6,8,17]. In most studies [6,8,17] thetriglyceride and total cholesterol increased significantly with adecrease in the HDL level which is similar to our study. The exactprocedure of derangement of lipid profile is not very clear but studieshave suggested that HIV itself decreases HDL [18] at initial stage andincreases TG and free fatty acid during AIDS [19]. Dual-PI therapy(ritonavir boosting) has been associated with the rapid developmentof hypertriglyceridemia. In the present study we have found anincrease in HDL from 6 months to one year and hence there has beenan improvement of TC: HDL ratio during the same time span. In astudy by Churchill et al, hypertriglyceridemia occurred within 2 weeksof PI therapy among most patients. After 4th week the TG increasedby 160% from the baseline and by 8th week there was significantlyincreased total cholesterol levels in addition [20]. In contrary to that,in the present study the TG was elevated significantly only at one year,this may be due to the lifestyle difference in developed and developingcounty.
In addition to dyslipidaemia, patients treated with PI therapyhave been reported to develop insulin resistance and new-onsetdiabetes mellitus [21]. PIs tend to impair glucose sensing by cells.Peripheral insulin resistance and cell dysfunction together contributeto altered glucose homeostasis associated with PI [22]. In the presentstudy it was observed that development of diabetes mellitus was notstatistically significant but there were a few cases. However, long-term follow-up of the patients on boosted-PI will help in ascertaining theincidence of diabetes mellitus among them. This result is consistentwith other documented studies [4,8]. Never the less it should benoted that in the present study insulin resistance was not tested dueto resource limitation.
There is an increased incidence of dyslipidaemia and unmaskingof diabetes related to protease inhibitor in this cohort. There hasbeen an improvement in nutritional status as shown by BMI andGS. Effective control of virological and immunological parametersinduced improved health parameters as reflected by improved BMIand GS. It should be noted that the virologic and immunologicaloutcome outweighs the side effects induced by PI. Hence the use of PIbased regimens continues to be an important part of HIV treatmentin different countries. Nevertheless since HIV/AIDS is a chronicmanageable disease now the quality of life is an important aspect. Theside effects of PIs affect the quality of life of these patients. Hencethis problem remains an important issue which needs to be managedand dealt with, since there is an increased use for PI in the treatmentof HIV in the years to come in India. The National AIDS ControlOrganisation of India also changed lopinavir with Atazanavir in July2011. Atazanavir is lipd-neutral and requires lesser dose of Ritonavir(100 mg/day) than Lopinavir (200 mg/day) for pharmacologicboosting with resultant lower incidence of dyslipidaemia. Nonetheless,regular monitoring of fasting lipid profile and blood glucose is crucialfor patients on PI-based second line ART in the National Programme.
Our study has a few limitations, firstly since this is an operationalresearch in a National Programme we could not use machineslike DEXA for body composition and insulin resistance testing toobserve metabolic disorder. These facilities have been used in manysimilar studies from different countries [8,23]. On the other hand itshould be noted that when the patients who developed PI inducedhypercholesterolemia and hypertriglyceridemia, went through bothnon-pharmacological and pharmacological interventions accordingto guidelines [16] during the study. Thus few patients controlledtheir lipid levels while receiving PI based regimen. This could not beavoided due to ethical issues, medical guidelines and the risk of cardiovascular diseases with high lipid levels [24]. The study was also limitedby a small sample size as well as shorter follow-up period of one year.
Acknowledgement
-HIV positive patients of School of Tropical Medicine, Kolkata,India
-West Bengal University of Health Sciences, Kolkata, India
References
- Bhaskaran K, Hamouda O, Sannes M, Boufassa F, Johnson AM, et al. (2008) Changes in the risk of death after HIV seroconversion compared with mortality in the general population. JAMA 300: 51-9.
- Palella FJ Jr., Delaney KM, Moorman AC, Loveless MO, Fuhrer J, et al. (1998) Declining morbidity and mortality among patients with advanced human immunodeficiency virus infection. HIV Outpatient Study Investigators. N Engl J Med 338: 853-60.
- Grunfeld C, Kotler DP, Hamadeh R, Tierney A, Wang J, et al. (1989) Hypertriglyceridemia in the acquired immunodeficiency syndrome. Am J Med 86: 27-31.
- Carr A, Samaras K, Burton S, Law M, Freund J, et al. (1998) A syndrome of peripheral lipodystrophy, hyperlipidaemia and insulin resistance in patients receiving HIV protease inhibitors. AIDS 12: F51-8.
- Periard D, Telenti A, Sudre P, Cheseaux JJ, Halfon P, et al. (1999) Atherogenic dyslipidemia in HIV-infected individuals treated with protease inhibitors. The Swiss HIV Cohort Study. Circulation 100: 700-5.
- Penzak S, Chuck S (2000) Hyperlipidemia associated with HIV protease inhibitor use: pathophysiology, prevalence, risk factors and treatment. Scand J Infect Dis 32: 111-23.
- Riddler SA, Smit E, Cole SR, Li R, Chmiel JS, et al. (2003) Impact of HIV infection and HAART on serum lipids in men. JAMA 289: 2978-82.
- Mulligan K, Grunfeld C, Tai VW, Algren H, Pang M, et al. (2000) Hyperlipidemia and insulin resistance are induced by protease inhibitors independent of changes in body composition in patients with HIV infection. J Acquir Immune Defic Syndr 23: 35-43.
- Mercie P, Tchamgoue S, Thiebaut R, Viallard J, Faure I I, et al. (2000) Atherogen lipid profile in HIV-1-infected patients with lipodystrophy syndrome. Eur J Intern Med 11: 257-63.
- Passalaris JD, Sepkowitz KA, Glesby MJ (2000) Coronary artery disease and human immunodeficiency virus infection. Clin Infect Dis 31: 787-97.
- Holmberg SD, Moorman AC, Williamson JM, Tong TC, Ward DJ, et al. (2002) Protease inhibitors and cardiovascular outcomes in patients with HIV-1. Lancet 360: 1747-8.
- Currier JS, Taylor A, Boyd F, Dezii CM, Kawabata H, et al. (2003) Coronary heart disease in HIV infected individuals. J Acquir Immune Defic Syndr 33: 506- 12.
- Friis-Moller N, Sabin CA, Weber R, d'Arminio Monforte A, El-Sadr WM, et al. (2003) Combination antiretroviral therapy and the risk of myocardial infarction. N Engl J Med 349: 1993-2003.
- Shils ME (2006) Modern Nutrition in Health and Disease. 10th Edn., Lippincott Williams and Wilkins, Philadelphia, ISBN-10: 0781741335, pp: 2069.
- Mahan LK, Escott-Stump S, (2004) Krause's Food, Nutrition and Diet Therapy. 11th Edn., WB Saunders, Philadelphia, ISBN-10: 0721697844, pp: 1321.
- Longo DL, Fauci AS, Kasper DL, Hauser SL, Jameson JL, et al. (2012) Harrison’s Principles of Internal Medicine. 18th Edn, vol 2, Mc Graw Hill Medical, New York, pp: 3600.
- Hiransuthikul N, Hiransuthikul P, Kanasook Y (2007) Lipid profiles of thai adult HIV-infected patients receiving protease inhibitors. Southeast asian j trop med public health 38: 29-77.
- Constans J, Pellegrin JL, Peuchant E, Dumon MF, Pellegrin I, et al. (1994) Plasma lipids in HIV- infected patients: a prospective study in 95 patients. Eur J Clin Invest 24: 416-20.
- Grunfeld C, Pang M, Doerrler W, Shigenaga J, Jensen P, et al. (1992) Lipids, lipoproteins, triglyceride clearance, and cytokines in HIV infection and the acquired immunodeficiency syndrome. J Clin Endocrinol Metab 74: 1045-52.
- Churchill D, Pym AS, Babiker A, Back D, Weber J (1998) Hyperlipidaemia following treatment with protease inhibitors in patients with HIV-1 infection. Br J Clin Pharmacol 46: 518-9.
- Behrens G, Dejam A, Schmidt H, Balks HJ, Brabant G, et al. (1999) Impaired glucose tolerance, beta cell function and lipid metabolism in HIV patients under treatment with protease inhibitors. AIDS 13: 63-70.
- Koster J, Remedi M, Qiu H, Nichols C, Hruz P (2003) HIV Protease Inhibitors acutely impair glucose-stimulated insulin release. Diabetes 52: 1695-1700.
- Chen D, Misra A, Garg A (2002) Lipodystrophy in human Immunodeficiency virus- infected patients. J Clin Endocrinol Metab 87: 4845-4856.
- Iloeje U, Yuan Y, ’Italien GL, Mauskopf J, Holmberg SD, et al. (2005) Protease inhibitor exposure and increased risk of cardiovascular disease in HIV-infected patients. HIV Medicine 6: 37-44.