Research Article
Under Nutrition among Reproductive AgeWomen: A Persistent Public Health Problem in a North-Eastern State of India
Subrata Baidya1*, Rituparna Das2, Durba Deb3
1Department of Community Medicine, Agartala Government Medical College, Tripura. P.O. Kunjaban, PIN- 799006, India
2Department of Community Medicine, Agartala Government Medical College, Agartala, Tripura, PIN- 799006, India
3Medical Social Worker, Department of Community Medicine, Agartala Government Medical College, Tripura. P.O.Kunjaban, PIN- 799006, India
Corresponding author: Baidya, Associate Professor, Department of Community Medicine, Agartala GovernmentMedical College, Tripura. P.O. Kunjaban, PIN- 799006, Ph-9436122899; E-mail: drsubratabaidya@gmail.com
Citation: Baidya S, Das R, Deb D. Under Nutrition among Reproductive Age Women: A Persistent Public Health Problem in a North-Eastern State of 02 India. Indian J Nutri. 2016;3(2): 136.
Copyright © 2016 Baidya S, et al. This is an open access article distributed under the Creative Commons Attribution License, which permits unrestricted use, distribution, and reproduction in any medium, provided the original work is properly cited.
Indian Journal of Nutrition | ISSN: 2395-2326 | Volume: 3, Issue: 2
Submission: 27/07/2016; Accepted: 19/08/2016; Published: 25/08/2016
Abstract
Background: Though overweight and obesity is a major problem in western countries, under-nutrition is still a big threat to women in developing countrieslike India.
Objectives: 1. To study the prevalence of underweight among reproductive age women in Tripura. 2. To assess the socio-demographic factors affectingunderweight among the study population.
Materials and Method: This cross-sectional study was conducted in Tripura among 2000 women of reproductive age group selected by Cluster Sampling Method using PPS (Probability Proportionate to size) technique.
Results: The study revealed that 28.10% of the reproductive age women were underweight. Regarding the factors associated with under-nutrition, Multiple logistic regression analysis showed that women who were between 15-29 years of age were significantly more underweight compared to women between 45 to 49 years of age. Again those women who belonged to scheduled tribe had 32% less chance [OR-0.68 (0.51-0.91)] of having underweight and it was statisticallysignificant (p value-0.01). Again women who belonged to nuclear family had 22% less chance [OR-0.78 (0.63-0.98)] of having underweight compared to women who belonged to joint families.
Conclusion: Effective policies, information and health with a special focus on women belonging to young age and joint families. education programs withnutritional support for women are required to reduce the high burden of underweight among the reproductive age women in the state.
Keywords: BMI; Underweight; Reproductive age women; Tripura
Background
Malnutrition is a public health problem worldwide. Nutritional status of a nation is closely related to the level of poverty, status of women, rate of population growth, and access to health education, safe drinking water, environmental sanitation, hygiene and other social services. As overweight and obesity is a major problem inwestern countries, under-nutrition is still a big threat to women indeveloping countries like India.
As per NFHS -3 report 33% of Indian women between 15 to 49yrs were underweight (with a BMI of < 18.5) [1] whereas 35.10% of reproductive age women in Tripura were underweight [2]. But nostudies have been conducted thereafter to assess and compare thecurrent status of under-nutrition among reproductive age women ofTripura with the NFHS data. Hence, the present study was conductedto study the prevalence of underweight among reproductive agewomen in Tripura and to assess the socio-demographic factorsaffecting underweight among the study population.
Materials and Method
This community based cross-sectional study was conducted inthe northeastern state Tripura among reproductive age women inbetween age of 15 to 49 years. The study area was 30 clusters selectedby probability proportionate to size sampling method for all overthe state, calculating cumulative population according to GramPanchayet and Nagar Panchayet population.
Considering prevalence of under-nutrition among reproductiveage women (age 15-49) to be 35.10 percent (p) [2], allowance of errorof 10 percent of the under-nutrition, and the level of significance (ortype 1 error) as 5 percent, the minimum required sample size forassessing the nutritional status was calculated to be 710, using theformulae,
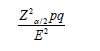
But since, cluster sampling through PPS Technique wasconsidered, to overcome design effect the sample size was multipliedwith a design effect of 2. Hence, the minimum required samplesize was calculated to be 1420. A 10 percent non response rate wasconsidered and the sample was rounded to 2000. In the next stageapproximately 66 number of eligible female in the age group of 15 to49 years was selected by simple random sampling from each cluster.
The randomly selected women was interviewed in their homeafter taking written informed consent from them and informationregarding Socio-demographic particulars, height & weightmeasurements, etc were taken.
The unit of analysis of this study i.e., the outcome variable is the‘underweight’. The ‘underweight’ status was measured from BMIwith the BMI being calculated as follows:
BMI = Weight in kg / (Height in meter)2
Thus, the BMI was classified according to WHO (2000) [3]:Underweight = BMI < 18.5 kg/m2, Normal weight = BMI 18.5 to 24.9kg/m2, Over weight = BMI 25.0 to 29.9 kg/m2, Obese = BMI ≥ 30.0kg/m2.
Results and Discussion
The study revealed that majority of the study participants werebetween 20 to 29 year age group (41.50%) and were Hindu by religion(84.30%). Majority of the participants belonged to Scheduled Tribe(33.90%) and 92.50% participants were married. The study alsoshowed that most of the participants were housewife (71.50%) withprimary education (52.10%) and had a per capita monthly income of< Rs 2500 (86.40%) (Table 1).
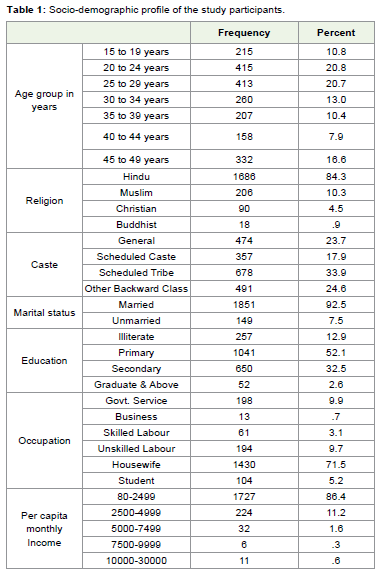
Table 1: Socio-demographic profile of the study participants.
The study revealed that 28.10% of the reproductive age womenhad a BMI of < 18.50 i.e. they were underweight, whereas 10.80% wereoverweight and 1.10% of the participants were obese (Table 2).
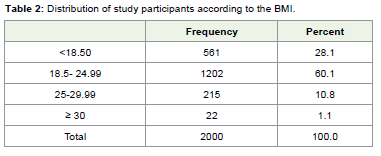
Table 2: Distribution of study participants according to the BMI.
Table 3 shows that majority of the underweight women werebellow 30 years of age and statistical analysis using chi-square testshowed that age of the participants were significantly associated withnutritional status (p value-0.00). Beside the study also showed thatthe religion (p value-0.02), community (p value- 0.00), occupation(p value-0.00) and income of the participants (p value-0.00) werealso significantly associated with the nutritional status. Again table3 also showed that the marital status and type of family were also significantly associated with the nutritional status of reproductive agewomen.
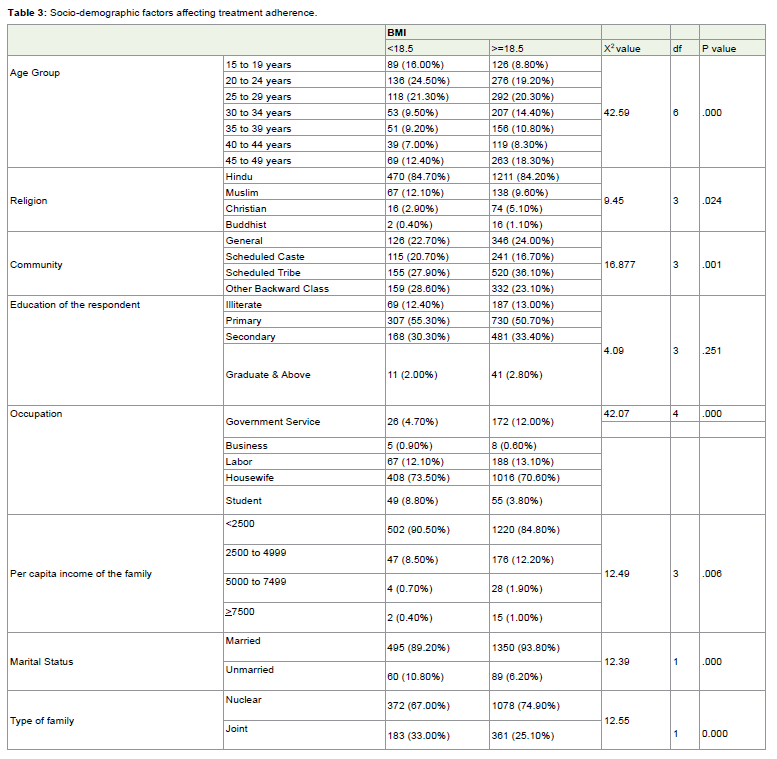
Table 3: Socio-demographic factors affecting treatment adherence.
Factors which were found to be significantly associated withunderweight; using bivariate analysis in Table 3 were used asindependent variables in Multiple logistic regression analysis in Table 4. The study revealed that women who were between 15-19 years of age were 1.95 times (1.24-3.05) more underweight compared to 45 to 49 year aged women. Similarly women who were between 20 to 24year age, and 25 to 29 year of age were 1.79 times (1.26-2.53) and 1.60times (1.13-2.26) more underweight compared to 45 to 49 year aged women. Again those women who belonged to scheduled tribe had32% less chance [OR-0.68 (0.51-0.91)] of having underweight and itwas statistically significant (p value-0.01). The study also revealed thatwomen who were at government service had 86% less chance [OR-0.24 (0.10-0.56), p value- 0.00] of having underweight and womenwho were skilled labor they had 71% less chance [OR-0.29 (0.11-0.77), p value- 0.01] of having underweight compared to students.Again women who belonged to nuclear family had 22% less chance[OR-0.78 (0.63-0.98), p value- 0.03] of having underweight comparedto women who belonged to joint families.
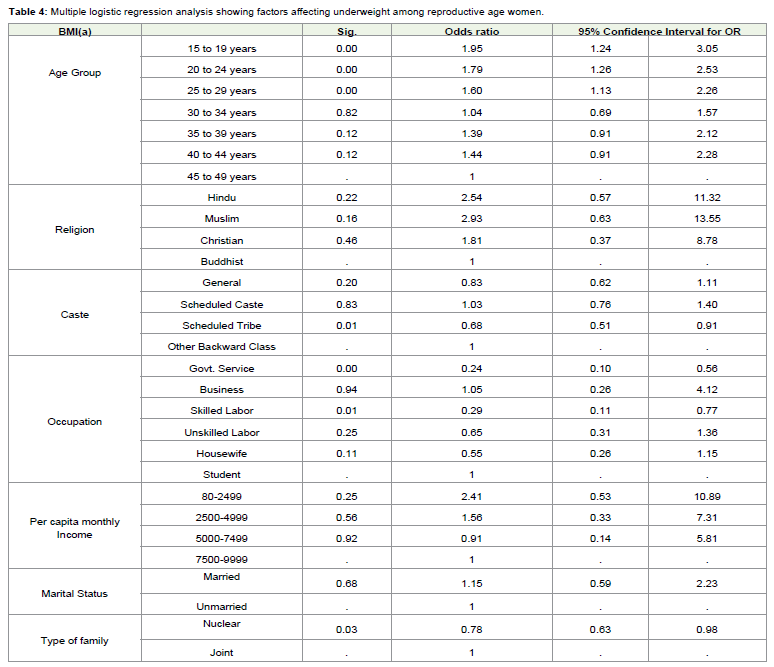
Table 4: Multiple logistic regression analysis showing factors affecting underweight among reproductive age women.
Discussion
The present study conducted among 2000 reproductive agewomen of Tripura selected through cluster sampling by PPStechnique revealed that the prevalence of underweight among thestudy population was 28.10%. This finding was lower than the NFHS3 report of India [1] in 2005-06 where 33% of the reproductive agewomen had Body Mass Index below normal. This finding was alsolower than what was found in Tripura in the NFHS 3 report [2] in 2005-06 where 35.10% of the reproductive age women had Body Mass Index below normal, Hence, it is evident that there has been animprovement of the nutritional status of reproductive age women inTripura.
However, the study finding is same to a study conductedin Bangladesh by Mostafa Kamal et al. [4] where 28.50% of thereproductive age women were underweight. The study finding was also similar to a study conducted in Kerala [5] where 18.90 % of thewomen were underweight, 60.30% women had normal BMI and20.90% women were overweight. Similar finding was obtained froma survey in Japan done in 2007 [6] where 25.20% of the women wereunderweight.
But the prevalence of underweight in the present study was veryhigh compared to the developed countries like United States [7] andEurope [8] where the prevalence of underweight was among women7.50% and 17.50% respectively.
The present study revealed that women who were between 15to 29 years of age were significantly more underweight compared towomen between 45 to 49 years of age. Similar finding was obtainedfrom a study conducted by Mostafa Kamal et al. [4] in Bangladesh,where women bellow 20 years of age were 1.52 times (95% C.I.-1.24-1.85) more underweight compared to women between 45 to 49 year age group. Again the same study showed that women between20 to 24 years of age were 1.23 times (95% C.I.-1.02-1.47) moreunderweight compared to women between 45 to 49 years. Similarfinding was obtained from a study conducted in Kerala [5] wherewomen between 35 to 49 years had 50.80% less chance of havingunderweight compared to women between 15 to 24 years of age(p value < 0.001). Thus the present study also showed that 15 to 29year age group is the most vulnerable period for underweight forthe women in reproductive age group which could be due to earlymarriages and too close pregnancies among them.
The present study revealed that tribal women had less chance[OR-0.68 (0.51-0.91)] of having underweight and it shows thatactivities focused to improve their nutritional status in the state havebeen quite successful.
The present study did not show any association between thenutritional status of the women and their education. But a studyconducted in Allahabad by Shankar H. et al. [9] showed significantassociation between education and underweight among women.Similarly a study conducted by Mostafa Kamal et al. [4] in Bangladeshshowed that underweight was 6.76 times (95% C.I. - 5.20-8.80) moreprevalent among women with no formal education. This study mighthave failed to show any association due to the fact that the literacyrate of the state is very high [10].
Women who were underweight had significantly higher oddsratios for overtime work in Scania by Sadiq Mohammad Ali et al.[8]. Similar finding was obtained in a study conducted by MostafaKamal et al. [4] in Bangladesh where working women were 1.11 timesmore underweight and it was statistically significant (p value < 0.05).But the present study revealed that women who were at governmentservice had 86% less chance of having underweight and women whowere skilled labor had 71% less chance of having underweight whichis a different finding compared to studies conducted in different partsof the world.
Again in the present study women who belonged to nuclear familyhad 22% less chance of having underweight compared to women who belonged to joint families. This shows that women from joint familiessuffer more from under-nutrition in the state.
Thus the present study revealed that over one-fourth of thewomen in the state suffer from underweight, which has a grave publichealth implication. Young aged women and women belonging to jointfamily were found to be more underweight. Hence, more systematicmonitoring and surveillance of the nutritional status is importantto address the widespread problem of underweight among them.Effective policies, information and health education programs withnutritional support for women are required to ensure adequate accessto health services and to reduce the high burden of underweightamong the reproductive age women.
References
- National Family Health Survey (NFHS-3), 2005-06. National Fact Sheet. Ministry of Health and Family Welfare, Government of India.
- National Family Health Survey (NFHS-3), 2005-06. Fact Sheet Tripura. Ministry of Health and Family Welfare, Government of India.
- World Health Organization (WHO) (2000) The Asia-Pacific Perspective: Redefining Obesity and its Treatment. International Association for the Study of Obesity (IASO), Western Pacific Region, World Health Organization.
- Mostafa Kamal SM, Md Aynul I (2010) Socio-economic Correlates of Malnutrition among Married Women in Bangladesh. Mal J Nutr 16: 349-359.
- Ramesh P (2000) Malnutrition among Women in Kerala: An Analysis of Trends, Differentials and Determinants.
- Ministry of Health, Labour and Welfare. Results of Year 2007 National Health and Nutrition Survey: Summary; 2007.
- Fryar CD, Ogden CL (2014) Prevalence of Underweight among Adults Aged 20 Years and Over: United States, 1960-1962 Through 2007-2010.
- Ali SM, Lindström M (2006) Socioeconomic, psychosocial, behavioural, and psychological determinants of BMI among young women: differing patterns for underweight and overweight/obesity. Eur J Public Health 16: 325-331.
- Shankar H, Dabral SB, Walia DK (2010) Nutritional Status Of Newly Married Women (Married Last 2 Years From Date Of Survey) In Rural Area Of Allahabad, India.
- Census info India (2011) Final population totals. Tripura profile.