Research Article
Age and sex differences in human body physique and its association with nutrition: A cross-sectional study among the Ao children from Nagaland, North-East India
Longkumer T
Department of Anthropology, North-Eastern Hill University, Shillong-22, India
Corresponding author: Temsumongla Longkumer, Department of Anthropology, North-Eastern Hill University,Shillong-22, India, Mobile: 4849193573; E-mail: temmong@gmail.com
Citation: Longkumer T. Age and sex differences in human body physique and its association with nutrition: A cross-sectional study among the A children from Nagaland, North-East India. Indian J Nutri. 2016;3(2): 132.
Copyright © 2016 Longkumer T. This is an open access article distributed under the Creative Commons Attribution License, which permits unrestricted use, distribution, and reproduction in any medium, provided the original work is properly cited.
Indian Journal of Nutrition | ISSN: 2395-2326 | Volume: 3, Issue: 2
Submission: 06/07/2016; Accepted: 21/07/2016; Published: 01/08/2016
Abstract
The variation in human body physique has been a subject of interest to physical anthropologists and human biologists since time immemorial. It is important to understand and analyze the factors associated with body physique, in order to have a better understanding of the morphological structure of the human body. The present study has been carried out on the age and sex differences in body physique and its association with nutrition. Heath and Carter method of somatotyping was employed to access body physique, and Body Mass Index (BMI) to access nutritional status among the Ao Naga children aged 8 to 18 yearsfrom Mokokchung district of Nagaland, North-East India. The comparison of the somatotype components and categories between the age groups and between sexes were tested using t-test and chi-square test, and the comparison of somatotype components within the BMI classification was analyzed using one-way analysis of variance (ANOVA). A significant level at 0.05 was used for all analyses employing MS office excel and SPSS 17 for windows software. The result showed that, the somatotype component ratings of boys and girls were found to be 1.88-3.90-3.67 and 3.11-3.50-3.09 respectively. There was a clear agerelated change of mean somatotype components among Ao girls, and only minor changes were evident among boys. Also, remarkable sexual dimorphism was revealed with regard to somatotype components. The classification of BMI revealed that, both underweight and overweight coexisted, although the prevalenceof underweight was significantly higher. There was also significant association between somatotype components and BMI, depicting that, the increase in endomorphy and mesomorphy components were a risk factor having predisposition toward certain diseases. Various intervention programs and preventive measures are required to improve the overall health status.
Keywords: Body physique; Somatotype; Nutrition; Body Mass Index; Endomorphy; Mesomorphy; Ectomorphy; Ao Naga
Introduction
The study of human variability in body size, shape, and proportionis an age-old research interest to physical anthropologists and humanbiologists, and more specifically to physical anthropologists regardingthe study on the morphological structure of the human body in orderto understand and analyze both ancient and living populations.The technique used to study human physique has been a subject ofinterest since the time of Hippocrates, a great Greek philosopher and physician of the 5th century BC. Although several different techniquesare useful to describe the physique, one method that has beenfrequently used to describe body type is somatotyping.W.H.Sheldon(in collaboration with S.S. Stevens and W.B. Tucker) in 1940introduced the concept of somatotype in the book “The varietiesof human physique”. Although Sheldon’s method of somatotypingprovided new techniques for the analysis and classification of humanphysique, there were many drawbacks in his method. Heath andCarter tried to modify the somatotype method that began with Heath (1963) and Heath and Carter (1967) [1,2], which was designedto avoid some of the limitations of Sheldon’s work [3]. It was adynamic and more useful physique classification, which is now in usethroughout the world. According to Heath and Carter, somatotypingcan be best thought as a numerical shorthand method of describingthe present morphological conformation in terms of body shape andcomposition independent of body size. It is one of the establishedmethods in human biology, which is widely applicable in the fieldsof growth, nutrition, sports activity, occupation, disease, etc. [4]. It is expressed in a three-number rating, representing three componentsof physique namely endomorphy, which refers to relative fatness;mesomorphy, which refers to musculoskeletal robustness relative toheight; and ectomorphy, which refers to relative linearity.
Somatotype has been applied in a variety of ways to demonstratesimilarities and differences between diverse groups or populations.Several factors such as age, sex, nutrition, physical activity,occupation, socio-economic differences, and genetic factors affectthe somatotype of an individual. The first and second components(endomorphy and mesomorphy) are very sensitive to changes inbody composition. For this reason, many authors have assessed therelation between somatotype and health. In fact, unlike ectomorphy,high endomorphy and mesomorphy have been related to an increasein risk of coronary diseases [5,6].
One of the major health problems in many developing countries ismalnutrition (under nutrition and over nutrition), which refers to animpairment of health either from a deficiency or excess or imbalanceof nutrients, which is of public health significance all over the world.It creates lasting effect on growth, development and physical fitnessof a person. Overweight or obesity assessed by Body Mass Index(BMI) during childhood is a strong predictor of overweight orobesity and coronary heart disease risk factors in young adulthood[7]. It is noteworthy that individuals with somatotypes high inectomorphy, and low in both endomorphy and mesomorphy, andthose low in endomorphy but high in mesomorphy, are rarely foundin distributions of coronary heart disease patients. Increasingly, highmesomorphy and high endomorphy in combination is believed toadd to the risk of cardiovascular disease [4]. However, till date, nosuch study has been reported among the Ao children. Under thisbackdrop, the present study has been taken up inorder to understandthe association between somatotypes and nutritional status amongthe Ao children.
Materials and Method
The present cross-sectional study has been carried out among theAo boys and girls of Mokokchung district in Nagaland, NortheastIndia. The Ao community is a major tribal group in Nagaland,belonging to the mongoloid ethnic stock, and speaks the Tibeto-Burman language. The people of Nagaland are well known for theirvaried ethnic groups, with their distinct cultures and traditions.Nagaland is situated on the easternmost region of India, and is one ofthe North Eastern states, covered mostly by high-altitude mountains.Mokokchung is one of the major districts of the State that became afull- fledged district in 1957. The district headquarter, Mokokchungtown, is considered the cultural center of the Ao People, and is economically and politically the most important urban center inNorthern Nagaland. The district is located at a height of about 1,326meters above sea level, and lies between 94.29 and 94.76 degrees eastlongitude, and 26.20 and 26.77 degrees north latitude. According to2011 census, the total population of the district was 193,171, out ofwhich, the urban population was about 55,654 and rural populationof about 1,37,517 [8].
For the present study, urban area in Mokokchung District hasbeen taken into account, where, seven wards were selected randomlyusing lottery method as mentioned in Snedecor and Cochran [9]. Nostatistical sampling of households and individuals was done for thepurpose of collection of data, instead an attempt was made to includeall those children who were willing to co-operate for the purpose ofthe present study. A total sample of seven hundred and ninety (790)Ao children were considered for the present study, out of which, fourhundred and four (404) were boys and three hundred and eighty six(386) were girls. The age range was from 8 to 18 years.
After computing the age-wise statistics for somatotype, thecomparison of the somatotype components and categories betweenthe age groups and between sexes were tested using t-test and chisquaretest, and the comparison of the somatotype componentswithin the BMI classifications was analyzed using one-way analysis ofvariance (ANOVA). A significant level at 0.05 was used for all analysesemploying MS office excel and SPSS 17 for windows software.
Result
The age-wise distribution of mean somatotype componentsin boys (Table 1) shows that, endomorphy component showed afluctuating pattern with no regular trend from 8 till 18 years of age,and very little differences between each age groups, with an overallincrease of 0.26 units. Mesomorphy component, on the other hand,showed a decreasing trend with a slight fluctuation,with very littlemean differences between each age group, and an overall decreaseof 0.24 units. Ectomorphy showed an increasing trend from 8 till 13years, and a decreasing trend thereafter, with an overall increase of0.41 units. On the whole, the somatotype component rating of the Aoboys was found to be 1.88-3.90-3.67, where, mesomorphy showed thehighest value, and endomorphy the lowest.
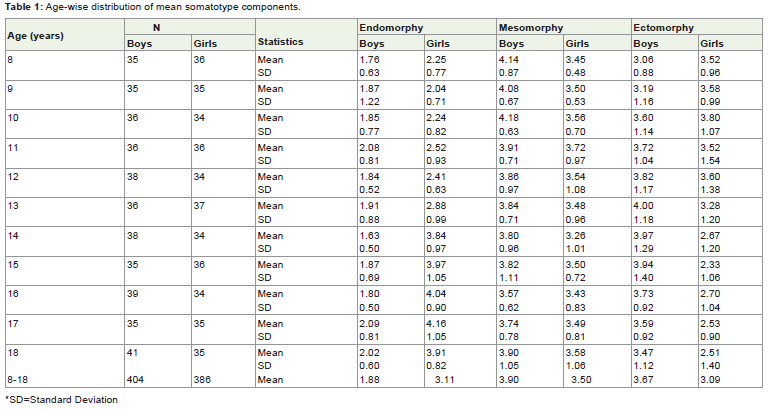
Table 1: Age-wise distribution of mean somatotype components.
The age-wise distribution of mean somatotype components ingirls (Table 1) shows that, endomorphy showed lower values duringthe younger age groups from 8 till 12 years, and became higher withthe advancement of age in a fluctuating pattern. An overall increaseof 1.66 units from 8 to 18 years was noticed. On the other hand,mesomorphy did not show much change with age, with an overallincrease of 0.13 units. Ectomorphy was noticed to be higher duringthe younger age groups from 8 till 12 years, and lower during 13 till18 years, and the trend showed a fluctuating pattern. There was anoverall decrease of 1.01 units from 8 to 18 years. On the whole, thesomatotype component rating of the Ao girls was found to be 3.11-3.50-3.09, where, mesomorphy and ectomorphy components werefound to have the highest and lowest values respectively.
Figures 1 and 2 presents the age-wise somatotype componentvariation in boys and girls respectively. As seen in Figure 1,endomorphy showed minor values compared to mesomorphy andectomorphy at all the age groups in boys. Mesomorphy showedhigher values than ectomorphy at 8, 9, 10, and 18 years of age, andsimilar values during 11 to 17 years of age. Among girls (Figure 2),endomorphy showed lower values from 8 till 13 years, and highervalues from 14 till 18 years. On the other hand, mesomorphy andectomorphy components showed similar values from 8 till 13 years,and mesomorphy showed higher values thereafter.
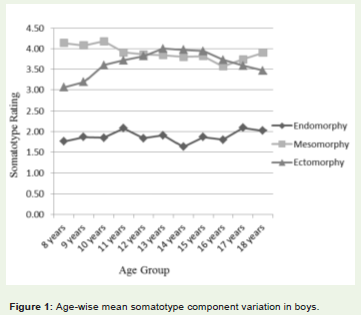
Figure 1: Age-wise mean somatotype component variation in boys.
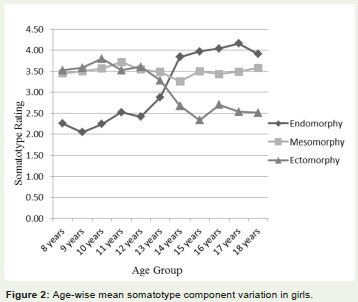
Figure 2: Age-wise mean somatotype component variation in girls.
Table 2 presents the age-wise comparison of the mean somatotype components in boys and girls. As seen from the table, no statistically significant difference was noticed in mean somatotypes between any of the age groups compared in boys. The age change in meansomatotype component ratings at 8 and 18 years in boys (Figure 3)also showed that, the somatotype components had similar values withno significant differences.
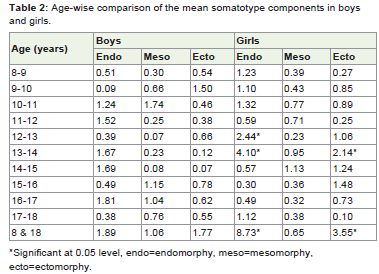
Table 2: Age-wise comparison of the mean somatotype components in boys and girls.
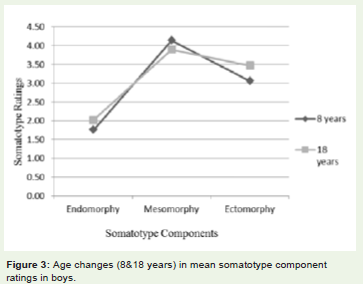
Figure 3: Age changes (8&18 years) in mean somatotype component ratings in boys.
Further, girls showed statistically significant differences inboth endomorphy and ectomorphy components according to age.The differences were noticed between the age groups of 12 and13 years (t=2.44, p< 0.05) and 13 and 14 years (t=4.10, p< 0.05) forendomorphy component, and between 13 and 14 years (t=2.14,p< 0.05) for ectomorphy component (Table 2). The age change in mean somatotype component ratings at 8 and 18 years in girls (Figure 4) showed that, endomorphy and ectomorphy components weresignificantly higher at 18 and 8 years respectively, and mesomorphycomponent showed similar values at both the age groups.
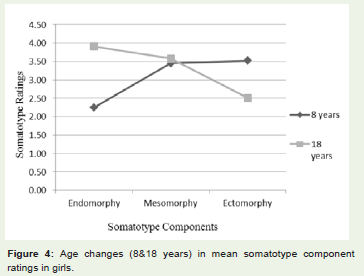
Figure 4: Age changes (8&18 years) in mean somatotype component ratings in girls.
Thus, from the above finding, it can be noted that, bothendomorphy and ectomorphy components were the main source ofsomatotype variations with regard to age in girls. Among boys, therewas no statistically significant difference noticed in the somatotypecomponents with regard to age.
Table 3 shows the age-wise comparison between boys and girls somatotype components. Remarkable differences were noticed in the somatotype components between boys and girls, more so within theendomorphy component. The endomorphy values were significantlyhigher among girls at all the age groups except during 9 years ofage. The values of the mesomorphy component were closer betweenboth sexes, although, at all ages, boys presented higher values inmesomorphy, and the statistically significant differences were noticedat 8, 9, 10, and 14 years. As for ectomorphy component, girls showedhigher values from 8 till 10 years, with a significant difference during8 years, and boys had higher values thereafter, with a significantdifference during 13 till 18 years of age. The overall perusal of table3 reveals that, the statistically significant differences in somatotypecomponents between boys and girls were seen to be highest inendomorphy component, followed by ectomorphy component mostly among the older age groups, and finally the mesomorphy component among the younger age groups.
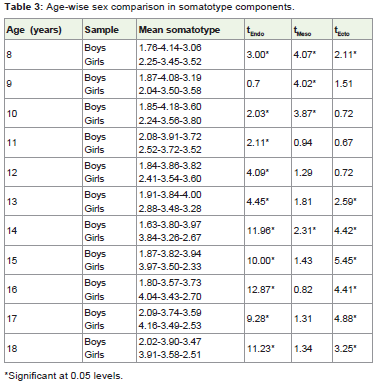
Table 3: Age-wise sex comparison in somatotype components.
The total frequency and percentage of boys and girls in varioussomatotype categories at all age groups combined (Table 4) shows that, the distribution of somatotype categories was more in girls than in boys. The maximum and minimum number of boys fell inmesomorph-ectomorph (34.41%) and mesomorphic endomorph(0.25%) categories respectively. As for girls, maximum number ofthem fell in mesomorph-endomorph category (18.91%) althoughthe margin was close to central type (18.39%), and minimumnumber of them fell in endomorphic ectomorph category (1.04%).A statistically significant difference (χ2 =232.06, p< 0.05) was noticed in the distribution of somatotype categories between boys and girls.
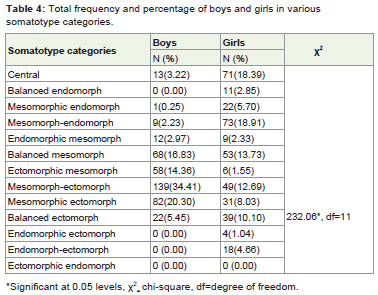
Table 4: Total frequency and percentage of boys and girls in various somatotype categories.
The mean of Body Mass Index (BMI) according to age in boys andgirls (Figure 5) reveals that, BMI increased with the advancement of age, with a slight fluctuating pattern at 10 years among boys and 16years among girls. Boys were found to have higher BMI during 8 till10 years, and it became higher in girls thereafter.
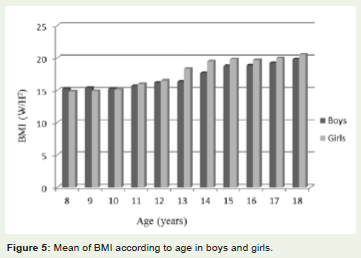
Figure 5: Mean of BMI according to age in boys and girls.
The distribution of BMI by age according to the classification byCole et al. (2000,2007) in boys and girls (Figures 6, 7) showed that,the prevalence of underweight was noticed at all the age groups inboys, and overweight at 9 (2.86%), 10 (2.78%), 11 (2.78%), 12 (2.63%),15 (5.71%), and 18 (2.44%) years. As can be seen from figure 6, theprevalence of underweight was higher among younger age groups,and declined with the advancement of age in a fluctuating pattern.The prevalence of overweight, on the other hand, did not show anyregular trend. Among girls (Figure 7), similar to boys, the prevalenceof underweight was noticed at all the age groups, and overweight atthe age of 9 (2.86%), 11 (8.33%), 13 (2.70%), 14 (2.94%), 15 (2.78%),16 (5.88%), and 18 (8.57%) years. The prevalence of underweightand overweight was higher among younger and older age groupsrespectively, in a fluctuating pattern. Overall, the prevalence ofunderweight was higher among boys (31.44%) than in girls (25.13%),and the prevalence of overweight was higher among girls (3.11%)than in boys (1.73%). A significant difference in the distribution ofBMI according to age was noticed in girls (χ2 =39.69, p< 0.05).
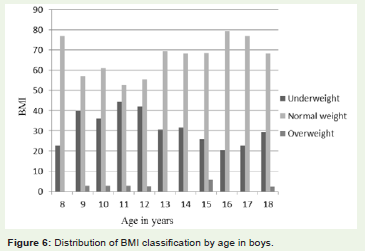
Figure 6: Distribution of BMI classification by age in boys.
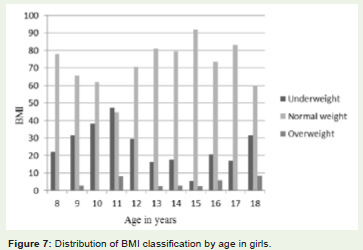
Figure 7: Distribution of BMI classification by age in girls.
Table 5 presents the comparison of mean somatotypecomponents within BMI classification (underweight, normalweight, and overweight). It was noticed that, among both boysand girls, endomorphy and mesomorphy components were foundto be significantly higher among those with the prevalence ofoverweight, and significantly lower among the underweight children.Ectomorphy, on the other hand, was found to be significantly higheramong those with the prevalence of underweight, and lower amongoverweight children. From this table, we can prove that, there is asignificant association between somatotype components and BMIamong children.
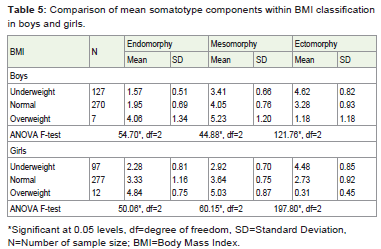
Table 5: Comparison of mean somatotype components within BMI classification in boys and girls.
Discussion
The present study showed a clear age-related change of meansomatotype components among Ao girls, and only minor changeswere evident among the boys. This finding was in consonance with various other studies conducted in different parts of the country[13,14]. Endomorphy and ectomorphy components contributedin girls, more so through endomorphy component in the presentstudy, where, endomorphy was found to be higher among the olderage groups and increased as the age advanced in a slight fluctuation.Ectomorphy component, on the other hand, tended to decreaseamong the older children. The decrease of the third component(ectomorphy) in late adolescence may be related not only to thedevelopment and widening of the skeleton, but also to the increase infat that takes place at these ages [15]. Furthermore, in the present study,there was a gradual decrease in the mesomorphic component with theadvancement of age, and the younger boys had higher mesomorphiccomponent than the older boys. The higher mesomorphy componentamong the younger age groups did not mean that the younger oneswere more muscular than the older ones, but partly because of the factthat mesomorphy was adjusted for height [13].
The remarkable sexual dimorphism revealed in the presentstudy with regard to somatotype components was in consonancewith several other studies [16-18]. The Ao boys presented a higher value in mesomorphy component than girls, which showed a greater musculo-skeletal development of boys. According to Carter and Heath, girls were more endomorphic and less mesomorphic than boys, because of the hormonal changes that brought about an increase of subcutaneous fat in girls. And though there may also bean increase in fatness among boys, secretion of androgens stimulates musculoskeletal development and, consequently, the mesomorphyincreases [1990]. The significantly higher mean ectomorphy in Aoboys during the older age groups delineates that boys had more linearphysique than girls during the older age groups. Succinctly, the Aoboys had lower mean endomorphy, and higher mean mesomorphyand ectomorphy than their female counterparts.
The distribution of somatotype categories revealed a dominantmuscular component with only marginally lower linear componentamong the Ao boys. The girls, on the other hand, had all the threecomponents well distributed with slight muscular componentdominant. The slightly higher mesomorphic ratings among theAo children could be attributed to physical activity includinghouseholdchores, which was found to be very common among thispopulation. Various other studies confirm the present study, where,apositive association was noticed between mesomorphic componentand physical activity [19,20].
BMI, which was used to assess the nutritional status of the childrenin the present study revealed that both underweight and overweightcoexisted, although the prevalence of underweight was significantlyhigher. Under nutrition among children and adolescents is a seriouspublic health problem internationally, especially in developingcountries [21]. The high prevalence of underweight among children inthe present study could be due to the imbalance between diet neededfor proper growth and regular energy expenditure through physicalactivity. Other studies also showed that low-fat diets and regularphysical activity contributed to weight loss and weight maintenance[22]. Also, the high prevalence of underweight among Ao childrencould be attributed to family income group, where, most of thechildren belonged to low income group (51.73% in boys and 59.07%in girls), without proper nutrients required for a proper body growth.Poor environmental conditions such as poor housing and hygienicconditions, unsafe drinking water, heavy workloads, lack of preventiveand control measures of locally endemic diseases and infections,have been found to be the causes of under nutrition in various otherstudies, which were the common characteristics of population groupsbelonging to low socio-economic strata of the society especially indeveloping countries [23,24]. On the other hand, the prevalence ofoverweight among children in the present study could be attributedto the reduction in energy expenditure accompanied by an increasein energy intake, which was in agreement with several other studies[25,26].
The significantly higher prevalence of overweight among Aochildren with higher endomorphy and mesomorphy componentsdepicts that, increase in endomorphy and mesomorphy componentswere a risk factor having predisposition toward certain diseases.Thesignificant positive association between somatotype components andBMI was also found in various other studies [27,28].
Conclusion
The present study clearly shows that the somatotype componentschanged significantly with age among girls, and there were remarkablesex differences with regard to all the three components, more sowithin the endomorphy and ectomorphy components. There was alsosignificant association between somatotype components and BMI, depicting that increase in endomorphy and mesomorphy was a riskfactor having predisposition toward certain diseases. It is well knownthat, in the recent times,the prevalence of overweight and obesity areincreasing rapidly in both developed and developing countries, andthat the situation is becoming more serious in developing countries,where the proportion of overweight and obese people now co-existwith those who are underweight. A similar result has been identifiedamong the Ao children, although the prevalence of underweight wassignificantly higher.
It is therefore recommended that, preventive measures shouldbe taken early in life to avoid diseases associated with malnutrition.It is important to educate children on health related issues, whereinactive living and unhealthy diet are increasing rapidly as an impactof urbanization, industrialization, and expansion of food markets,especially in developing societies. On the other hand, the highprevalence of underweight among the Ao children is a major concernthat should be taken into consideration. Poverty has been the greatestchallenge related to health problem, particularly undernourishment,in a country like India. Various intervention programs are requiredto eradicate under nutrition, especially among the urban poor. Aschildren spend a high percentage of their time at school, schoolscan become the key environment to educate and improve theirknowledge, attitude, and behavior towards health and lifestyle for thewell being of the individual and society as a whole.
Acknowledgement
This article is a part of my Ph.D. thesis. I am grateful for the financial support I received from University Grant Commission(UGC) Rajiv Gandhi National fellowship that helped me in thecompletion of the thesis.
References
- Heath BH (1963) Need for modification of somatotyping methodology. Am J Phys Anthropol 21:227-233.
- Heath BH, Carter JEL (1967) A modified somatotype method. Am J Phys Anthropol 27: 57-74.
- Sheldon WH, Stevens SS, Tucker WB (1940) The Varieties of Human Physique. New York: Harper Brothers.
- Carter JEL, Heath BH (1990) Somatotyping. Development and Applications. Cambridge, UK, Cambridge University Press.
- Herrera H, Rebato E, Hernandez R, Hernandez-Valera Y, Alfonso-Sanchez MA (2004) Relationship between somatotype and blood pressure in a group of institutionalized Venezuelan elders. Gerontology 50: 223-229.
- Kalichman L, Livshits G, Kobyliansky E (2004) Association between somatotypes and blood pressure in an adult Chuvasha population. Ann Hum Biol 31: 466-476.
- Janssen I, Katzmarzyk PT, Srinivasan SR, Chen W, Malina RM, et al. (2005) Combined influence of body mass index and waist circumference on coronary artery disease risk factors among children and adolescents. Pediatrics 115: 1623-1630.
- Census of India (2011) Provisional population totals: Nagaland.
- Snedecor GW, Cochran WG (1967) Statistical Methods. Iowa: The Iowa State University Press.
- Weiner JS, Lourie JA (1981) Practical Human Biology. London: Academic Press.
- Cole TJ, Bellizzi MC, Flegal KM, Dietz WH (2000) Establishing a standard definition for child overweight and obesity worldwide: International survey. BMJ 320: 1240-1243.
- Cole TJ, Flegal KM, Nicholls D, Jackson AA(2007) Body Mass Index cut offs to define thinness in children and adolescents: international survey. BMJ 335: 194-197.
- Gakhar I, Malik SL (2002) Age changes and sex differences in somatotypes among the Jats of Delhi. Anthropologist (Special Issue) 1: 115-125.
- Singh LD (2011) Somatotypes of the Affluent and Non-affluent Meitei Boys of Manipur, India. Anthropologist 13: 9-16.
- Claessens AL, Beunen G, Simon J (1986) Stability of anthroposcopic and anthropometric estimates of physique in Belgian boys followed longitudinally from 13 to 18 years of age. Ann Hum Biol 13: 235-244.
- Bhasin MK, Jain S (2007) Biology of the tribal groups of Rajasthan, India: Age changes in somatotype. Anthropologist 9: 257-265.
- Saranga SPJ, Prista A, Nhantumbo L, Beunen G, Rocha J, et al. (2008) Heritabilities of Somatotype Components in a Population from Rural Mozambique. Am J Hum Biol 20: 642-646.
- Vivek KS, Senthil KS, Vinayathan A, Krishnakumar R, Rajendran R (2016) Somatotyping in Adolescents: Stratified by Sex and Physical Activity. Int J Anat Appl Physiol 2: 32-38.
- Malik SL, Eiben OG, Prakash M, Mittal M (1986) Impact of high altitude on body shape. Anthropologiai kozlemenyek 30: 203-208.
- Ozener B, Duyar I (2008) The effect of labour on somatotype of males during the adolescent growth period. Homo 59:161-172.
- Pelletier DL, Frongillo EA (2003) Changes in child survival are strongly associated with changes in malnutrition in developing countries. J Nutr 133: 107-119.
- Bouchard C (2000) Introduction. In: Physical activity and obesity. Champaign, IL: Human Kinetics. p 3-19.
- Khongsdier R (2002) Body mass index and morbidity in adult males of the War Khasi in Northeast India. Eur J Clin Nutr 56: 484-489.
- De Onis M, Frongillo EA, Blossner M (2000) Is malnutrition declining? An analysis of changes in levels of child malnutrition since 1980. Bull World Health Organ78:1222-1233.
- Bodzsar EB, Zsakai A, Jakab K, Toth KB (2005) Body fatness and sexual maturation status. Anthropological Notebooks (Szlovenia)X(1): 12-17.
- Laxmaiah A, Nagalla B, Vijayaraghavan K, Nair M (2007) Factors affecting prevalence of overweight among 12 to 17 year old urban adolescents in Hyderabad, India. Obesity 15: 1384-1390.
- Nikolova M, Akabaliev V, Sivkov S, Mladenova S (2005) Body composition of children and adolescents from Plovdiv. In: Gruev B, Nikolova M, Donev A editors. Proceedings of the Balkan Scientific Conference of Biology in Plovdiv (Bulgaria) from 19th till 21st of May 2005. p 150-158.
- Widiyani T, Suryobroto B, Budiarti S, Hartana A (2011) The growth of body size and somatotype of Javanese children age 4 to 20 years. HAYATI Journal of Biosciences 18: 182-192.