Research Article
Elemental Profile of the Leafy VegetablesCommonly Consumed by Natives of North Eastern Region of India analysed using Energy Dispersive X-Ray Fluorescence
Renthlei L1, Birla Singh K2, Sudarshan M3, Ram SS3, Mohondas Singh N1*
1Department of Chemistry, School of Physical Sciences, Mizoram University, Aizawl-796004, India
2Department of Zoology, Pachhunga University College, Aizawl-796001, India
3UGC-DAE Consortium for Scientific Research, Kolkata Centre, Kolkata 700098, West Bengal, India
Corresponding author: Nongmaithem Mohondas Singh, Department of Chemistry, School of Physical Sciences, MizoramUniversity, Aizawl-796004, India, Contact No- +919612163894; E-mail: nmdas08@rediffmail.com
Citation: Renthlei L, Birla SK, Sudarshan M, Ram SS, Mohondas SN. Elemental Profile of the Leafy Vegetables Commonly Consumed by Natives of North Eastern Region of India analysed using Energy Dispersive X-Ray Fluorescence. Indian J Nutri. 2016;3(1): 126.
Copyright © 2016 Mohondas SN, et al. This is an open access article distributed under the Creative Commons Attribution License, which permits unrestricted use, distribution, and reproduction in any medium, provided the original work is properly cited.
Indian Journal of Nutrition | ISSN: 2395-2326 | Volume: 3, Issue: 1
Submission: 10/05/2016; Accepted: 30/05/2016; Published: 06/06/2016
Abstract
There is paucity of data in respect to elemental concentration in the foodstuffs consumed by the living population of North East Region of India. Thirteen elements (Ca, K, Cl, P, S, Fe, Mn, Zn, Cu, Se, Sr, Rb and Br) were detected by using versatile Energy Dispersive X-ray Fluorescence(ED-XRF) technique in eight selected leafy vegetable foodstuffs namely Brassica juncea, Colocasis esculenta L, Zanthaxylum rhetsa L, Clerodendron colebrookianum, Vigna unguiculata L, Gnetum gnemon L, Cucurbita pepo and Cucurbita maxima commonly consumed by natives of North East State of India. The analysis of the data revealed that the selected leafy vegetables contained high and elevated concentration of K, Ca, P, Cl, S and Fe and appreciable amount of Zn, Mn, Cu, Se, Sr, Rb and Br. The contents of Fe and all major elements recorded in this study were found to be above the permissible limit as proposed by the various regulatory organizations and pose a threat to health on long term consumption. The result of the study thus provides valuable database of the nutritional and chemical quality commonly consumed leafy vegetables foodstuffs by natives of North East Region India.
Keywords: Elemental analysis; ED-XRF; Leafy vegetables; North Eastern India.
Introduction
Vegetable foodstuffs serve as an indispensable constituent of the human diet supplying the body with essential elements in additionto vitamins, protein, certain hormone precursors and energy forwell being and good health [1]. Reliable database on the nutrientcomposition of foods including elements content are important inmany areas of endeavour including health assessment, formulationof appropriate institutional and therapeutic diets, nutritioneducation, food and nutrition training, epidemiological research on relationships between diet and diseases, plant breeding, nutritionlabelling, food regulation and consumer protection as well as a varietyof applications in agriculture research [2]. Sevenhuysen reported thatfood composition tables and element databases are available in mostof the countries, yet the data they contain are invariably criticised asbeing too inaccurate for many purposes for the reasons that differentworkers have used different techniques of analysis and that thesamples so analysed had undergone different sample preparationsleading to varying degrees of losses without ignoring the inherentvariable factors that affect food composition which are commonly not specified [3]. Thus, Kirk and Sawyer published that analysis plays an important role in the assessment and maintenance of food quality and safety, both in industry and for enforcement authorities at the national and international levels [4].
Mizoram is a State in the North Eastern Region of India and is apart of the Indo-Mayammar biodiversity hot spot of the world. TheState harbour variety of edible plant species including number ofmedicinal plants used in the traditional practices. Most commonlyconsumed vegetables foodstuffs of the native of this region comprisesof recipes of various leafy vegetables used for culinary purposes toimprove the quality of soup and also for their dietary purposes [5].The study of the elemental content of native vegetables commonlyconsumed by living population are relevant and imperative becausethese vegetables are not only major nutrient suppliers includingimportant essential elements acting on a metabolism of severalfunctions in human body but also produced hazard effects on healtheither due to their deficiencies or their presence at an elevated level.However, there is paucity of data in respect to elemental concentrationin the foodstuffs consumed by the living population of India especiallyNorth East Region of India. Only Singh and Taneja published traceelements and heavy metals concentration in the vegetables and meatfoodstuffs available in the State of Manipur [6]. However, this studydeals only with the analysis of two or three trace elements usingconventional spectroscopic method. Here, the major and minorelements in the selected leafy vegetables foodstuffs were analyzed byusing ED-XRF for the first time and their role in the human bodyhas been discussed. The use of direct and multi-elemental analysismethods of vegetation samples with XRF has increased over thelast few years. Simplicity of sample preparation, minimum need formanipulation, speed and opportunity of analyzing several differentelements have promoted XRF as a useful alternative to conventionalspectroscopic techniques. In addition to this, XRF’s versatility stemsfrom its rapid non-destructive multi-element determination fromppm to weight percent of elements [7]. Thus, looking at the paucityof data and detrimental role played by the elements in the humanbody, major and minor elements present in the leafy vegetablesfoodstuffs commonly consumed by the native of the North Eastern region of India was analysed using sophisticated and versatile EDXRFtechnique.
Materials and Methods
Raw materials
Eight commonly and widely consumed leafy vegetables in Mizoram, India namely Brassica juncea, Colocasis esculenta L, Zanthaxylum rhetsa L, Clerodendron colebrookianum, Vigna unguiculata L, Gnetum gnemon L, Cucurbita pepo and Cucurbita maxima were selected for analysis. The vegetables were purchased from the Central Markets of Aizawl, Mizoram, India during the month of August to December, 2015.
Sample preparation
The leaves of the collected leafy vegetables were destalked,thoroughly washed with triple distilled water to eliminatecontamination due to dust and environmental pollution, air-driedand then oven dried at 60 °C and stored in plastic bags until needed.After drying, the leaves were ground into fine powder using mortarand pestle, and stored in a well labelled air tight container for analysis. The powdered samples were then formed into pellets (150mg each). The die used was 13mm and pressure of 300kg/cm2 was used.
Analysis using ED-XRF Spectrometer
The elemental analysis of vegetables samples was carried outusing a Xenematrix Ex-3600 Energy dispersive X-ray fluorescenceED-XRF spectrometer installed at UGC-DAE Consortium forScientific Research, Kolkata Center, Kolkata, India, which consistsof an oil-cooled Rh anode X-ray tube (maximum voltage 50 kV).The measurements were carried out in vacuum using different filters(between the source and sample) for optimum detection of elements.For example, for P, S, Cl, K and Ca, no filter was used, and a voltage of6 kV and current of 200 mA were used and samples were run for 200sec. A 0.05-mm-thick Ti filter was used in front of the source for Mn,Fe, Cu and Zn, with an applied voltage of 14 kV and a current 900mA and samples were run for 400 sec. For higher Z elements such asSe, Br, Rb and Sr Fe filter of 0.05 mm thickness was used at a voltageof 23 kV and 200 mA current and samples were run for 600 sec. TheX-rays were detected using a liquid-nitrogen-cooled 12.5 mm2 Si (Li)semiconductor detector (resolution 150 eV at 5.9KeV). The X-rayfluorescence spectra were quantitatively analyzed by the softwarenext integrated with the system. This software uses the FundamentalParameter Method approach, which combines a theoretical basis ofX-ray emission and absorption with experimental measurements forunknown sample analyses. Here, all matrix corrections etc are takeninto account.
Statistical analysis of data
The experimental results were subject to statistical analysisusing Excel 2007 and SPSS package v.17.0. Values are present in thestandard error of mean (SEM).
Results and Discussion
The concentration of major elements (K, C, P, Cl and S) andtrace elements (Fe, Zn, Cu, Mn, Se Sr, Rb and Br) in the selected leafy vegetables i.e Brassica juncea, Colocasis esculenta L, Zanthaxylumrhetsa L, Clerodendron colebrookianum, Vigna unguiculata L, Gnetumgnemon L, Cucurbita pepo and Cucurbita maxima is presented in theTable 1,2 and 3. Typical ED-XRF spectra of the major elements of theleafy vegetables studied is shown in the Figure 1, while the photographof the parts of the leafy vegetables used is shown in Figure 2. Table 1,2 and 3 reveals wide variation in the major and minor elements concentration of the various leafy vegetables studied. The results of the present study reveals that K is observed generally higher in all the leafy vegetables studied as compared to other major elementsrecorded. The content of K, C, P, Cl and S in all the selected leafyvegetables ranged from 1436.04 ± 7.47 mg/100gm to 4288.36 ± 221.54mg/100gm, 391.74 ± 9.56 mg/100gm to 3473.04 ± 144.39 mg/100gm,310.01 ± 7.63 mg/100gm to 475.51 ± 30.24 mg/100gm, 336.33 ±3.92 mg/100gm to 2043.45 ± 237.36 mg/100gm and 170.55 ± 28.71mg/100gm to 562.50 ± 11.28 mg/100gm respectively. The highestcontent of K and Cl was recorded in the Colocasis esculenta L leaveswhile the highest content of Ca and P was in the Cucurbita maximawith Brassica juncea contained highest amount of S. The study revealsthat the leafy vegetables contained high and elevated amount of Kand Ca. Studies related to the contents of macro elements in thecommonly consumed leafy vegetables from other parts of the worldis limited. The values recorded in our study is in agreement with thosereported by Stihi et al. [8] and Masson et al. [9] however, is more thanthose reported by Vincevica Gaile and Klavins [10]. As revealed from the study, all the leafy vegetable samples contain varied mean levels of elements which could be attributed to factors such as variation in genetic makeup of plant species and competitive interaction between metal ions within the lithosphere or variation in the amounts of the mineral in the soils where the vegetables grew as published by Anyawu et al. [11]. Indian Council of Medical Research [12] has recommended that the recommended dietary allowances (RDI) for Ca is 600, 1200 mg, and 800 mg per day for adult, pregnant and lactating women and 10-18 years of boys and girls respectively. On the other hand the Recommended Nutrient Intake (RNI) for K and P is 1100 - 3750mg/day and 600-800 mg/day respectively for adults of both sexes. Similarly, the permissible limit of S in the solid food is 3100 mg/kg [13]. However, all the major elements concentration recorded in the leafy vegetables in the present study were above the permissible limit as reported by these regulatory organizations. It means that these vegetables foodstuffs were loaded with high amount of Ca, K, P, Cl and S and that may posed threat to health on long term consumption even though these elements are considered essential elements for human body. Salim et al. published that high concentration of major elements recorded in leafy vegetables in the present study may be due to high content of these metals in the soil [14]. Additionally foliar uptake of atmospheric heavy metals from emissions has also been identified as an important pathway of heavy metal contamination in vegetable crops as leafy vegetables accumulate higher metal contents than others [15]. Otten et al. [16] reported that K is one ofthe essential elements of human diet and play important role in vitalcellular mechanisms and K deficiency in the diet can create resistancein fat and muscle cells etc from insulin, increased serum triglycerides,may lower HDL and blood supply to the vital organs and increasethe chances of stroke. Like K, Ca is also an important element whichplays a pivotal in signal transduction pathways, where it acts as asecond messenger and contraction of all muscle cell types [17]. Cl is an element making up 0.14% of the concentration of elements in the human body and one of the important roles of Cl in the body is their electrolyte function. By combining with Na and K, Cl works well to keep all of our biological systems running smoothly [18]. P is an element that makes up 1% of a person’s total body weight and present in every cell of the body. The main function of P in the human body is in the formation of bones and teeth [19]. Baker reported that as a macro element of the body, the role of S on the body is to acts as an integral part of many important compounds found in all body cells which are indispensable for life [20].
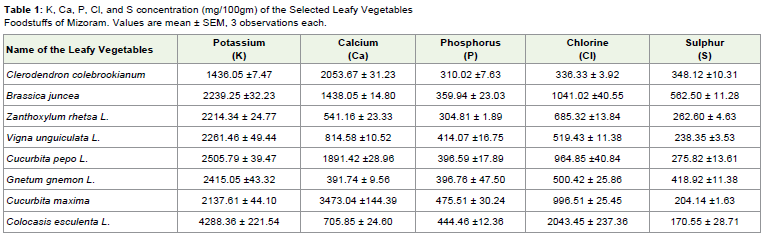
Table 1: K, Ca, P, Cl, and S concentration (mg/100gm) of the Selected Leafy Vegetables Foodstuffs of Mizoram. Values are mean ± SEM, 3 observations each. Values are mean ± SEM, 3 observations each.
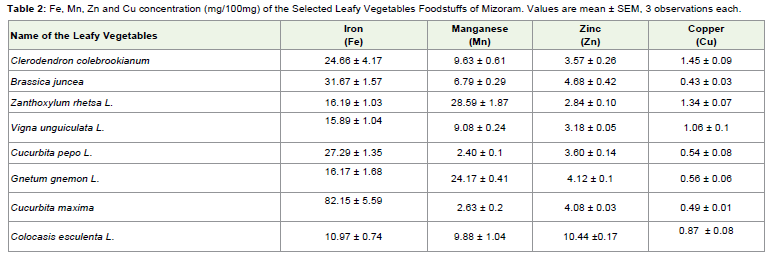
Table 2: Fe, Mn, Zn and Cu concentration (mg/100mg) of the Selected Leafy Vegetables Foodstuffs of Mizoram.
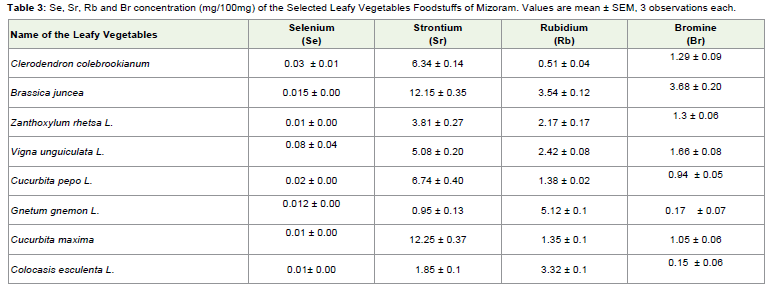
Table 3: Se, Sr, Rb and Br concentration (mg/100mg) of the Selected Leafy Vegetables Foodstuffs of Mizoram. Values are mean ± SEM, 3 observations each.
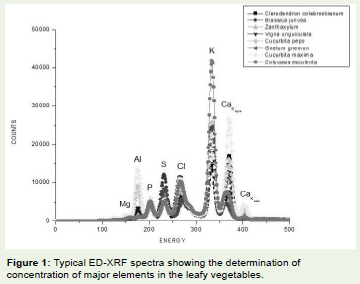
Figure 1: Typical ED-XRF spectra showing the determination of concentration of major elements in the leafy vegetables.
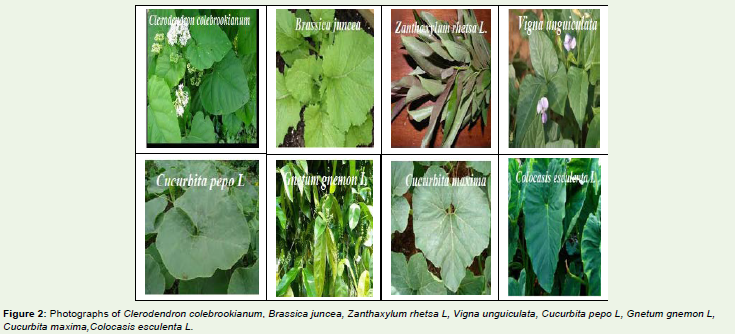
Figure 2: Photographs of Clerodendron colebrookianum, Brassica juncea, Zanthaxylum rhetsa L, Vigna unguiculata, Cucurbita pepo L, Gnetum gnemon L,Cucurbita maxima,Colocasis esculenta L.
Trace element plays an important role in human health because they participate in biological functions that contribute to growthand good health. Analysis of data revealed that among the traceelement studied, Fe concentration is found to be higher in all theleafy vegetables studied. The Fe content ranges between 10.97 ±0.74 mg/100gm to 82.15 ± 5.59 mg/100gm in all the leafy vegetablesstudied with the highest Fe content was found in Cucurbita maxima.The concentration of Fe recorded in our study is less than thosereported by Mohammed and Sharif [21] and Ismail et al., [22].
The high amount of Fe in the leafy vegetables may be due to thefoliar absorption from the surroundings air. Codex AlimentariusCommission published that the permissible limit for Fe in food isin the range of 2.5-5.0 mg/kg depending on the foodstuff and theminimum daily requirement of Fe is ranged from about 10 to 50mg/day [23]. Therefore, the value recorded in our study is above therecommended dietary allowances of Fe (10-15 mg/day) as per FAO/WHO [24] and NIN. Fe is a necessary nutrient element and is core component of RBC and needed for healthy immune system and for energy production [25].
Like Fe, Mn is one of the important essential elements required incarbohydrate metabolism as well as an antioxidant in SOD enzymes.Chaturvedi et al. published that Mn is also important in regulationof immune responses of the body by breakdown of amino acids,production of energy, by regulating the metabolism of Vitamin B1, C,E and by activation of various enzymes important for proper digestionand utilization of foods [26]. The content of the Mn recorded in thepresent study ranged between 2.40 ± 0.14 mg/100gm to 28.59 ± 1.87mg/100gm and Zanthoxylum rhetsa L. contained the highest. Thevalue of Mn obtained in our study is more than those reported bySingh and Taneja [6] and Gorbunov et al. [27]. As a contaminanthowever, no maximum permissible limit (MPL) has been fixed forMn in vegetables. Upper tolerable limit of Mn for human is 2-11 mg/day.
In the present study, Zn concentration was recorded in theranged between 3.18 ± 0.50 mg/100gm to 10.44 ±0.17 mg/100gm andthe highest Zn content was found in the Colocasis esculenta L. Theconcentration of Zn obtained in our study is in agreement with thosereported by Singh and Taneja [6] but greater than the values recordedin the earlier studies from Egypt and Latin America publishedby Salama and Radwan [28] and Olivares et al. [29] respectively.This disparity between the results of the present study and thosereported from other parts of the country could be explained by theindiscriminate used of excess Zn as micronutrients in Agriculturalpractices in India during the last decades [30]. Sandstead publishedthat Zn is an important trace element involved in numerous aspectsof cellular metabolism and required for the catalytic activity of morethan 200 enzymes [31]. Cu is known to play an important role inhuman metabolism, largely because it allows many critical enzymesto function properly. As an antioxidant, Cu scavenges or neutralizefree radicals and may reduce or help prevent some of the damage theycause [32]. As expected, Cu was found to be presented in appreciableamount in the selected leafy vegetables foodstuffs studied betweenthe ranged from the 0.43 ± 0.03 mg/100gm to 1.45 ± 0.09 mg/100gmand the highest level of the Cu was recorded from the Clerodendroncolebrookianum. The Cu content recorded in the present study is inagreement with Singh and Taneja (2010) but less than that publishedby Mohammed and Sharif [21]. The analysis of data from the presentstudy revealed that Se contents in the selected leafy vegetablesfoodstuffs ranged between 0.012 mg/100gm to 0.085 mg/100gm andVigna unguiculata L contained the highest. As contaminants no suchlimit for Se. Sunde [33] published that Se is one of the trace elementwhich behaves both as an antioxidant and anti-inflammatory agent.
Very interestingly, in the present study, Sr, Rb and Br were alsodetected in all the leafy vegetables studied with varying concentrationin the ranged between 1.85 ± 0.10 mg/100gm to 12.250 ± 0.37mg/100gm, 0.51 ± 0.04 mg/100gm to 5.12 ± 0.10 mg/100gm and0.15 ± 0.06 mg/100gm to 3.68 ± 0.20 mg/100gm for Sr, Rb and Brrespectively. The highest content of the Sr, Rb and Br were recordedfrom the Cucurbita maxima, Gnetum gnemon L and Brassica juncearespectively. Generally Sr, Rb and Br have no known essential rolein human or mammalian health however Ohly Julius [34] published that Rb ions are utilized by human body in a manner similarto potassium ions, being actively taken up by plants and by animalcells.
Conclusions
As revealed from the present study, ED- XRF spectrometry can beused for detailed analysis of element contents in the leafy vegetables.In addition, there was also the opportunity of analyzing some otherelements such as S that can hardly be determined by other techniques.The variation of elemental content from plant to plant in this studymay be mainly attributed to the differences in botanical structure,as well as in the mineral composition of the soil in which the plantsare cultivated and preferential absorbability of the plants, used offertilizers, irrigation water and climatic conditions. In this study,our result is well comparable with the finding of others. An elevatedlevel of the Ca, K, S, P, S and Fe recorded in this study more than themaximum acceptable levels proposed by the regulatory organizationsmay pose a threat to health on long term consumption. The resultsof the present study thus provide a valuable database of the chemicalquality of the commonly consumed leafy vegetables by natives of theNorth Eastern India.
Acknowledgement
The authors acknowledge the help rendered by the staff ofthe UGC- DAE Research Consortium, Kolkata and Department of Biotechnology (DBT), Ministry of Science and Technology, Government of India for providing financial assistance through DBT’s sponsored Twinning Major Research Project (Sanction no BT/238/NE/TBP/2011 dated 1/5/ 2012) to carry out this study.
References
- Oyenuga VA, Fetuga BL (1975) First National Seminar on Fruits and Vegetables. In: proc. and Recommendation and papers by NIHORT, Ibadan.
- Scrimshaw NS (1994) The importance of the International Network of Food Data Systems. Food Nutr Agric - Alimentation, Nutr et Agri 10: 6-11.
- Sevenhuysen GP (1994) Food Composition databases: current problems and solutions. Food Nutr and Agric-Alimentation, Nutr et Agric 12: 21-26.
- Kirk RS, Sawyer R (1991) In Pearson's Composition and Analysis of Foods, 9th Edition, Longman Scientific & Technical, London: 530-608.
- Lalramnghinglova H (2003) Ethnomedicinal plants of Mizoram. 1st ed. New Delhi: 1-256.
- Singh KB, Taneja SK (2010) Concentration of Zn, Cu and Mn in vegetables and meat foodstuffs commonly available in Manipur: a north eastern state of India. Elect J Env Agri Food Chem 9: 610-616.
- Margui E, Hidalgo E, Queralt I (2005) Multielemental fast analysis of vegetation samples by wavelength dispersive X-ray fluorescence spectrometry: Possibilities and drawbacks. Spectrochimica Acta Part B 60: 1363- 1372.
- Stihi C, Popescu IV, Gheboianu A, Frontasyeva MA, Dima AEG, et al. (2008) Mineral content of native vegetables obtained by energy dispersive x-ray fluorescence spectrometry. J Sc Arts 2: 331-334.
- Masson P, Dalix T, Bussière S (2010) Determination of major and trace elements in plant samples by inductively coupled plasma-mass spectrometry. Commu Soil Sc Plant Analy 41: 231-243.
- Vincevica-Gaile Z, Klavins M, Rudovica V (2011) Trace and major elements in food articles in Latvia: Root vegetables. Env Climate Techn 7: 119-124.
- Anyawu EC, Ijeoma EJE, Saleh MA (2004) Bioavailable of lead concentration in vegetable plants grown in soil from a reclaimed industrial site: Health implications. Int J Food Safety 6: 31-34.
- Indian Council of Medical Research (2009) Nutrient requirements and recommended dietary allowances for Indians. National Institute of Nutrition, Hyderabad.
- FAO/WHO (2014) General standards for contaminants and toxins in food and feed (CODEX STAN 193-1995)
- Salim R, Al-Sabu MM, Douleh A, Chenavier L, Hagemeyer J (1992) Effects of root and foliar treatments or carrot plants with lead and cadmium on the growth, uptake and distribution of metals in treated plants. J Env Sc Health Part A 27: 1739-1758.
- Aljassir MS, Shaker A, Khaliq MA (2005) Deposition of heavy metals on green leafy vegetables sold on roadsides of Riyadh city, Saudi Arabia. Bull Envi Contam Toxicol 75: 1020-1027.
- Otten JJ, Hellwig JP, Meyers LD (2006) Dietary Reference Intake: The essential guide to nutrient requirements. National Academies Press.
- Brini M, Cali T, Ottolini D, Carafoli E (2013) Intracellular calcium homeostasis and signaling. In Banci, Lucia, eds. Metallomics and the Cell. Metal Ions in Life Sciences, Springer.
- Mason JB (2011) Vitamins, trace minerals, and other micronutrients. In: Goldman L, Ausiello D,(eds). Cecil Medicine. 24th ed. Philadelphia, Pa: Saunders Elsevier.
- Anonym (2010) Committee to Review Dietary Reference Intakes for Vitamin D and Calcium, Food and Nutrition Board, Institute of Medicine. Dietary Reference Intakes for Calcium and Vitamin D. Washington, DC: National Academy Press.
- Baker DH (1986) Utilization of isomers and analogs of amino acids and other sulfur-containing compounds. Prog Food Nutr Sci 10: 133-178.
- Mohammed MI, Sharif N (2011) Mineral composition of some leafy vegetables consumed in Kano, Nigeria. Nig J Basic Appl Sc 19: 208-212.
- World Health Organization (2007) Growth Reference Data for 5-19 Years. Geneva.
- Miller JE, Rodgers YV (2009) Mother’s Education and Children’s Nutritional Status: New Evidence from Cambodi. Asian Development Review 26: 131-165.
- Abuya BA, Ciera J, Kimani-Murage E (2012) Effect of mother's education on child's nutritional status in the slums of Nairobi. BMC Pediatr 12: 80.
- Ehtisham A, Salman K, Zulfia K (2011) Nutritional status in children (1-5 yrs)- A Rural Study. Indian Journal of Community Health 2: 84-86.
- Kumari K (2007) Differentials of nutritional status in school-age children and the associated factors. Health and Population Perspectives and Issues 30: 268-277.
- Meyers A, Cutts D, Frank DA, Levenson S, Skalicky A, et al. (2005) Subsidized housing and children's nutritional status: data from a multisite surveillance study. Arch Pediatr Adolesc Med 159: 551-556.
- Henry FJ (1980) Environmental sanitation infection and nutritional status of infants in rural St. Lucia, West Indies. Trans R Soc Trop Med Hyg 75: 507-513.
- Priya B, Parul G (2011) Nutritional status and access to clean fuels: Evidence from South Asia. Paper presented in Agricultural and Applied Economics Association's 2011 AAEA and NAREA joint annual Meeting, Pittsburg, Pennglvania.
- Bisai S, Bose K, Ghosh A (2008) Prevalence of Under nutrition of Lodha Children aged 1-14 Years of Paschim Medinipur District, West Bengal, India. Iran J Pediatr 18: 323-329.
- Katoch OR (2012) Child undernutrition: Cause and Consequences Radix International Journal of Social Science 1: 1-12.