Research Article
Development of Antioxidant Rich, Low SugarJam From Green Tea Extract and Kiwi Pulp
Mahak Saini1*, Mahak Sharma2 and Lakhvinder Kaur3
1,2,3Department of Nutrition and Dietetics, Manav Rachna International University, Faridabad, India
Corresponding author: Mahak Saini, Department of Nutrition and Dietetics, Manav Rachna International University, Delhi Suraj kund Road, Sector 43, Faridabad, Haryana 121004 India, Ph no: 7503669556; E-mail: mahaksaini537@gmail.com
Citation: Saini M, Sharma M, Kaur L. Development of Antioxidant Rich, Low Sugar Jam From Green Tea Extract and Kiwi Pulp. Indian J Nutri. 2016;3(1): 124
Copyright © 2016 Saini M, et al. This is an open access article distributed under the Creative Commons Attribution License, which permits unrestricted use, distribution, and reproduction in any medium, provided the original work is properly cited.
Indian Journal of Nutrition | ISSN: 2395-2326 | Volume: 3, Issue: 1
Submission: 11/05/2016; Accepted: 24/05/2016; Published: 01/06/2016
Abstract
There is a considerable demand for fresh fruits as well as their products. Since many types of fruit are seasonal and their shelf life is limited, they must be processed to keep the quality. The fruits contain good amount of antioxidants and flavonoids which plays a very important role in preventing oxidative stress. The antioxidants in kiwifruit, most notably vitamin C, are among the most readily absorbed by the body. Similarly, green tea is also an antioxidant rich (flavonoid) which is Catechins, Epicatechin (EC), epigallocatechin (EGC), Epicatechin gallate (ECG) and epigallocatechin gallate (EGCG). Therefore it is recommended by nutritionists for consumption as it can prevent cancer, cardiovascular and other chronic diseases. The objective of the study was to develop a Green tea kiwi jam, by developing a standardized kiwi jam and incorporating different concentration (10%, 12%, and 15%) of green tea. The sugar of kiwi jam was replaced by sucralose. Sensory evaluation was done by composite scoring. Then the product was further analyzed for proximate analysis and antioxidant content of jam. The data revealed that as the green tea concentration increased the potassium, vitamin A, vitamin C content was also increased that means higher the concentration of green tea incorporated in jam had high antioxidant content. However there was decrease in the carbohydrate content and total sugar content as the concentration of green tea increased. The study concluded that low sugar green tea kiwi jam with 10% concentration of green tea is highly acceptable and could be recommended for the obese, overweight person, and diabetic person.
Keywords: Green tea; kiwi pulp; Flavonoids; Sucralose
Introduction
There is a considerable demand for fresh fruits as well as theirproducts. Since many types of fruit are seasonal and their shelf lifeis limited, they must be processed to keep the quality [1]. Processingmay include preservation by several methods, such as the additionof sugar to make a jam, fermentation, and drying. Jam processing isa fruit preservation method [2]. It is usually produced as a result ofcooking fruits with sugar and other additions such as pectin and citricacid [3]. Good jam has a soft even consistency without distinct piecesof fruit, a bright colour, good flavour and a semi-jelled texture that iseasy to spread but has no free liquid [4].
Sucralose is a sweetener that, although artificial, has excellentsensory profile and shares a considerable part of the worldwidecommerce for high intensity sweeteners. Sucralose is a powerfuland high quality sweetener stable at a wide range of pH. It is non- caloric and is obtained from the chlorination of sucrose resulting ina stable product with excellent physical and chemical characteristicsthat allows its application in various foods and beverages [5].
Kiwifruit are attributed to a high content of specific minerals,vitamins and phytonutrients like carotenoids and essential fatty acid.The antioxidants in kiwifruit, most notably vitamin C, are among themost readily absorbed by the body [6].
Green tea is one of the most popular beverages in the world[7]. The major polyphenol of green tea are flavonoids. The fourmajor flavonoids in green tea are the Catechins, Epicatechin(EC), epigallocatechin (EGC), Epicatechin gallate (ECG) andepigallocatechin gallate (EGCG) [8].
Therefore, the present study was done to develop the antioxidantrich and low sugar jam which will be beneficial in various medical conditions such as diabetes, obesity, cardiovascular disease, cancersetc.
Methodology
The study was done under four phases. Phase I was productdevelopment. The green tea kiwi jam was prepared by standardizedrecipe by using kiwi pulp, pectin, citric acid, 10% of green tea. Afterthe standardized of green tea kiwi jam, the sugar was replaced bysucralose. The three variation of green tea in low sugar jam were made,Sample A. Green tea 10%, Sample B. Green tea 12%, and Sample C.Green tea 15%. Phase II include sensory evaluation of the samples wasdone by composite score rating scale, carried out using 25 panelistsfrom Manav Rachna International University. Composite score cardhas been prepared which include the factor like appearance, texture,color, taste, aroma, mouth feel and overall acceptability etc. Jamswere evaluated by a 25 trained panelist for assessing the palatabilityand acceptability of jam. Phase III includes proximal analysis andantioxidant analysis of the product. The proximal analysis was donefor moisture, ash, and crude fiber contents were determined by theAOAC (2000). The total carbohydrate was determined by difference:Carbohydrate = 100 - (% moisture + % protein + % fat + % ash + %crude fiber). Potassium was determined using the standard methodof (AOAC, 2010), Ascorbic acid was determined by the titrationmethod as reported in AOAC. Vitamin A was determined byspectrophotometric. Ascorbic acid was determined by the titrationmethod as reported in AOAC.
The last phase was statistically test was done by using SPSS 20Version software. The analysis includes mean, standard deviation,ANOVA for comparative results.
Results and Discussion
Table 1 depicts mean acceptability score of attributes between the samples: green tea kiwi jam by composite scoring.
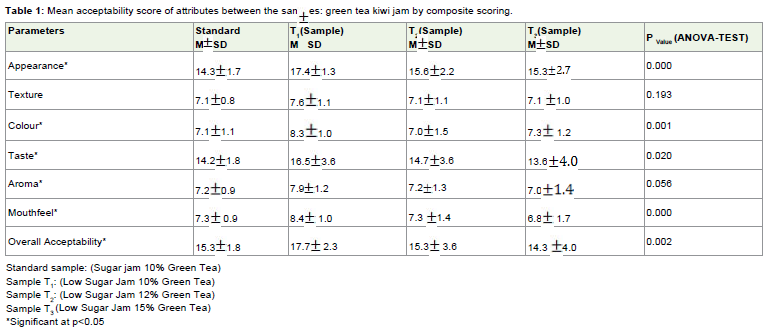
Table 1: Mean acceptability score of attributes between the samples: green tea kiwi jam by composite scoring.
In appearance, there was statistically significant differencebetween the sample as determined by one way ANOVA i.e. (p< 0.05). Sample T1 has the highest mean value i.e. 17.4 1.3 whereas standardsample has lowest mean value i.e. 14.3 1.7. The result revealed thatT1 was most acceptable regarding appearance as compared to othersamples.
Sample T1 had the highest mean value for texture i.e. 7.6 1.1whereas standard sample has lowest mean value i.e. 7.1 0.8. Butdifferences were not statistically significant among samples (p=0.193).The result revealed that T1 was most acceptable regarding appearanceas compared to other samples.
Regarding colour the highest mean value was of T1 (8.3 1.0)& lowest for sample T2 (7.0 1.5). However the differences arestatistically significant (p< 0.05) which means T1 was most acceptableregarding colour as compared to other products.
For taste, Sample T1 had the highest mean value i.e. 16.5 3.6whereas sample T3 has lowest mean value i.e. 13.6 and thedifferences were statistically significant among groups (p< 0.05).The results revealed that T1 was most acceptable regarding taste ascompared to other samples.
In aroma, there was statistically significant difference betweenthe sample as determined by one way ANOVA (p< 0.05). Sample T1has the highest mean value i.e. 7.9 1.2 whereas sample T3 has lowestmean value i.e. 7.0 which means that T1 was most acceptableregarding aroma as compared to other products.
Sample T1 had the highest mean value for mouth feel i.e. 8.4 1.0whereas sample T3 has lowest mean value i.e. 6.8 1.7. The differenceswere statistically significant among samples (p< 0.05). The resultdetermined that T1 was most acceptable regarding mouth feel ascompared to other samples.
The overall acceptability was highest for sample T1 with the meanvalue i.e. 17.7 2.3, however it was lowest for sample T3 with themean value 14.3 4.0 and the difference were statistically significant(p< 0.05). The results depicts the sample T1 (low sugar jam 10% GT) was more acceptable regarding all the attributes as well as had thehighest overall acceptability as compared to other products.
Table 2 depicts mean score of proximate analysis between thesamples. Regarding Carbohydrate, there was statistically significantdifference between the sample as determined by one way ANOVA(P< 0.05). Standard Sample had the highest mean value i.e. 24.2±0.2whereas sample T3 had lowest mean value i.e. 21.8±0.1. The resultrevealed Carbohydrate is decreasing as the concentration of green teais increasing.
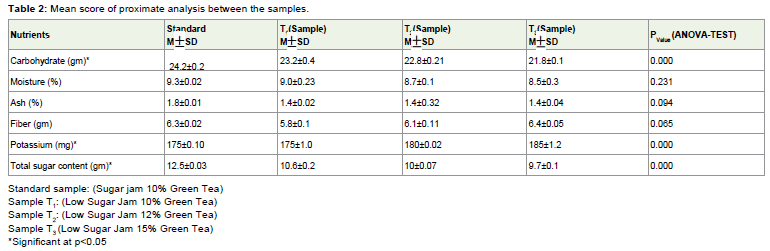
Table 2: Mean score of proximate analysis between the samples.
Standard Sample had the highest mean value for the presencemoisture in the product i.e. 9.3±0.02 whereas sample T3 has lowestmean value i.e. 8.5±0.3 but the differences were not statisticallysignificant among samples (P=0.231).
Regarding ash, the highest mean value was of standard sample(1.8±0.01) & lowest for sample T1 (1.4±0.02). However the differenceswere not statistically significant (P=0.094).
For fiber, standard sample had the highest mean value i.e.6.4±0.05 whereas sample T1 had lowest mean value i.e. 5.8±0.1 but thedifferences were not statistically significant among groups (P=0.065).
Sample T3 had the highest mean value for potassium i.e. 185±1.2whereas standard sample and sample T1 had lowest mean value i.e.175±0.10. The differences were statistically significant among samples(P< 0.05). As the green tea concentration increase the potassiumcontent is also increase.
The results indicated that total sugar content of jam showed amarked decrease in its content in all the variation. In standard sample,total sugar content was 12.5±0.03 which reduced to 9.7±0.1 in sample T3. There was statistically significant difference between the Samplesas determined by one way ANOVA (P< 0.05).
Table 3 depicts the mean score of antioxidant content between the samples.
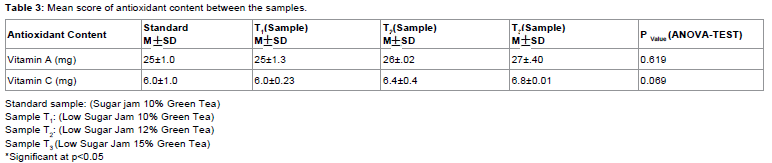
Table 3: Mean score of antioxidant content between the samples.
The results indicated that Vitamin A content of jam showed amarked increase in its content in all the variation. In standard sample,Vitamin A content was 25±1.0 which increase to 27±0.40 in sampleT3 but there no statistically significant difference between the Samples(P=0.619).
The results indicated that Vitamin C content of jam showeda marked increase in its content in all the variation. In standardsample, Vitamin C content was 6.0±1.0 which increase to 6.8±0.01in sample T3. There was no statistically significant difference betweenthe Samples (P=0.069). As the green tea concentration increased thevitamin c content was also increased that means higher concentrationof green tea incorporated jam had high antioxidant content.
Conclusion
Low sugar green tea kiwi jam (15% green tea) proved to be a highantioxidant rich product but the acceptability of the product contains10% of green tea was more as compared to 15%. Even the low sugargreen tea kiwi jam with 10% also have good potassium, vitamin A &vitamin C which full fill the ½ RDA of antioxidant content of theadult by just consuming 4 spoons per day. Moreover, they could berecommended for caloric reduced diets for obese and over-weightpersons. Likewise, the rather relative low carbohydrate content andtotal sugar content in the green tea kiwi jam with 10% green tea couldbe recommended for the diet regimen of diabetic persons.
Acknowledgement
I wish to express my sincere gratitude to my research supervisor Dr. Mahak Sharma and co-guide Mrs. Lakhvinder Kaur who wasabundantly helpful and offer invaluable guidance and support. Icannot express how much helpful was she to me in developing anidea and making it a reality.
References
- Åšcibisz I, Mitek M (2007) Antioxidant activity properties of high bush blue berry fruit cultivars. Food Sci Technology 10: 34.
- Kansci G, Koubala B, Lape I (2003) Effect of ripening on the composition and the suitability for jam processing of different varieties of mango (Mangifera indica). Afric J Biotechnology 2: 301-306.
- Abers JE, Worlstad RE (1979) Causative factors of colour deterioration in strawberry preserves during processing and storage. J Food Sci 44: 74-79.
- Schafer W, Wolf ID (1990) Making Jams, Marmalades, Preserves and Conserves. University of Minnesota Extension School.
- Shibao, Julianna, Santos, Gabriella Ferreira Alba dos, Gonçalves, et al. (2009) Edulcorantes em alimentos. São Paulo: Phorte editor :112.
- Prior R, Gu L, Wu X, Jacob RA, Sotoudeh G, et al. (2007) Plasma antioxidant capacity changes following a meal as a measure of the ability of a food to alter in vivo antioxidant status. J Am Coll Nutr: 170-181.
- Chan EWC, Soh EY, Tie PP, law YP (2011) Antioxidant and antibacterial properties of green, black and herbal teas of Camellia sinensis. Pharmacognosy Res. 3: 266-272.
- VR Sinija, Mishra HN (2008) Green Tea: Health Benefits. Journal of nutritional & environmental medicine. 17: 232 -248.