Research Article
Socioeconomic Factors, Living Conditions and Child Undernutrition among School going Children in Rural Areas of district Doda, Jammu & Kashmir, India: A Preliminary Study
Om Raj Katoch1, Aroon Sharma2
1Assistant Professor, Department of Economics, Govt. Degree College Ramban, Jammu & Kashmir
2Associate Professor, Department of Economics, University of Jammu, Jammu & Kashmir
Corresponding author: Om Raj Katoch, Department of Economics, Govt. Degree College Ramban, Jammu & Kashmir,Mob. 09419166014; E-mail: orkatoch@gmail.com
Citation: Katoch OR, Sharma A. Socioeconomic Factors, Living Conditions and Child Undernutrition among School going Children in Rural Areas of district Doda, Jammu & Kashmir, India: A Preliminary Study. Indian J Nutri. 2016;3(1): 123..
Copyright © 2016 Om Raj Katoch, et al. This is an open access article distributed under the Creative Commons Attribution License, which permits unrestricted use, distribution, and reproduction in any medium, provided the original work is properly cited.
Indian Journal of Nutrition | ISSN: 2395-2326 | Volume: 3, Issue: 1
Submission: 03/05/2016; Accepted: 18/05/2016; Published: 28/05/2016
Abstract
Background: Malnutrition especially undernutrition is a major health problem affecting the development of the children in many developing countries of theworld. It continues to be the principal cause of ill-health and pre-mature mortality and morbidity among children.Objectives: To assess the nutritional status of 6-14 year old school going children and the association among socioeconomic factors, living conditions andchild undernutrition.Methods: The present study was conducted in village Ganota of Doda district, Jammu & Kashmir to assess the nutritional status of 100 school going children(5-14 years). Nutritional status of the children was assessed in terms of anthropometric measurement. Weight for age (WAZ), height for age (HAZ) and bodymass for age (BMIZ) of the sample subjects were calculated and compared with WHO-2007 reference standard. Data were entered and analyzed usingstatistical software epi info 7 and Anthro Plus.Results: Results show that out of the total children screened (N=100), 36.00 percent were found stunted, 9.00 percent underweight and 2.00 percent wereobserved as wasted. It was further observed that female children were at higher risk of undernutrition in terms of stunting (42.86 percent of the female children),whereas underweight (11.39 percent and wasting (2.53 percent) were prevalent only in male children. Besides poverty, there are other socio-economic factors– (mother’s education, birth order in the family, joint family system, social and economic categories) and living conditions – (nature of sanitation, cooking areaand fuel used) that directly or indirectly affect the nutritional status of the school-going children. Conclusion: There is a great need to focus the attention of theleaders and policy-makers for intervening in such areas, as nutritional status of children is a main indicator of development and a pre-condition for the societyto progress.
Keywords: Undernutrition; Stunting; Wasting; Underweight; Socioeconomic factors; Living conditions
Introduction
Child undernutrition globally
Malnutrition especially undernutrition is a major health problemaffecting the development of the children in many developingcountries of the world. [1-3]. It continues to be the principal cause of ill-health and pre-mature mortality and morbidity among childrenof the developing countries. It has been estimated that in 2014, 23.8percent (159 million) of the children under-five worldwide sufferingfrom the problem of stunting (HAZ) and 7.5 percent (50 million)from wasting (HWZ). Approximately 1 out of every 13 children inthe world was wasted in 2014 [4].
As per UNICEF about 150 million children under five yearsold are underweight, and more than 20 million suffer from severemalnutrition. It is further estimated that 350 million women havenutritional anemia. Some 40 million children suffer from vitamin Adeficiency, some of whom go blind. Some 250,000 children go blindor partially blind and survive. Iodine deficiency disorders (IDD)affects 200 million to 300 million people with goiter, and at least 6million suffer from cretinism.
The picture of ill-health is much grim in developing countrieswhen compared to developed countries of the world. It is estimatedthat under-five mortality rate in the developing regions is estimatedat 72 children per 1000 live births, while in developed countries only6 children per 1000 live birth die before the age of five [5]. A studyconducted at international level revealed that nutrition has profoundeffects on health throughout the human life course and linked withcognitive and social development especially in early childhood. Theprevalence of stunting and wasting has affected at least 165 millionand 52 million respectively in 2011 globally. The fetal growthrestriction, which increases the risk of neonatal deaths is caused bymaternal undernutrition and it is estimated that undernutrition inaggregate is a cause of 45 percent child deaths in 2011 [6].
Indian Scenario
The children of today are the future of tomorrow; this powerfulquotation assumes a very special importance in the context of anation like India as children between the age group of 0-14 compriseone third of the total population in the country [7]. Despite the factthat India has made an impressive progressive in science, medicine,information technology and a tremendous economic performance,with the gross domestic product (GDP) rising 10.26 per cent in 2010-11 and 5.6 per cent in 2014-15 [8], human development still revealan unacceptable situation - contributing to India’s poor rank of 136among 183 countries on the Human Development Index (HDI) in2013. The lack of progress over the past decade and the current highlevels of undernourishment have led to India being recognized ashaving, perhaps, the worst undernutrition problem in the world.
As per a Joint Report of UNICEF, WHO & World Bank (2015),as compared to its neighbouring countries, India has the highestpercentage of children aged less than five years that are wasted (15.1 percent) [4]. In terms of underweight, it is at second place (29.4percent), Nepal is at first (30.1 percent). Stunting (38.7 percent)placed India at third place among its neighbours. The reduction rateof child undernutrition in India as per the Report was very low.
A study conducted by Subramanyam et al. by using data fromcross-sectional waves of the National Family Health Survey (NFHS)conducted in India for the years1992-93, 1998-99 and 2005-06 [9].The study found a substantial variation between the states in each ofthe anthropometric measure of undernutrition among the childrenof under three years of age. For example, in 2004-05 the prevalenceof underweight varied between 14.25 percent in Mizoram and55.22 percent in Madhya Pradesh, the prevalence of stunting variedbetween 25.72 percent in Goa and 49.25 percent in Bihar and thewasting varied between 9.69 percent in Mizoram and 33.18 percentin Bihar. The prevalence of underweight, stunting and wasting in2004-05 in Jammu and Kashmir were 23.59 percent, 32.38 percentand 18.34 percent respectively. As per another study these rates are,21.3 percent, 15.5 percent and 13.8 percent respectively [10]. Thishigh level of undernutrition in children in the country poses majorchallenge for child health and development.
Statement of the Problem
Nearly every nation has a serious health problem owing tomalnutrition in one of its forms [11]. The assessment of growthin children is important for monitoring health status, identifyingdeviation from normality and determining the effectiveness ofinterventions [12]. The significance of timely detection of poorgrowth in early life resides in its association with adverse functionalconsequences, including poor cognition and educational performance,low adult wages, lost productivity and, when accompanied by excessiveweight gain later in childhood increase the risk of nutrition-relatedchronic diseases [13]. Poor health and nutritional status among theschool going children may contribute to high rate of school dropout,absenteeism, and poor academic performance [14,15]. In addition,hungry school children tend to be nervous, irritable, disinterestedand unable to fully concentrate in the classroom [16,17].
The improved nutrition status helps to break the intergenerationalcycle of poverty, enhance labour force performance, income earning,and wage rate, generates broad-based economic growth, provides both a foundation for human development and the scaffoldingneeded to ensure to reach its full potential, and leads to a lot ofpositive consequences for individuals, families, communities , andcountries. It means that improving the nutrition status of the childrencan have significant payoffs in terms of generating economic benefitsand reducing costs. For example, a study conducted in Brazil inwhich a sample of more than 3000 individuals tracked over a periodof thirty years found that infants who were breastfed longer than 12months, achieved an additional year of education and higher incomesabout three times higher than those with less than 1 month [18]. Asper the Global Nutrition Report 2014, the scaling up nutrition specificintervention to address undernutrition has a benefit-cost ratio of 60.
There is surprisingly little research on nutritional status of schoolgoing children as most of the studies had stressed on the pre-schoolchildren. Perhaps this research vacuum or lack of quantity of literaturereflects a need to investigate into the nutritional status of school goingchildren as this age is the age of learning which enhance the efficiencyin the later life [17,19]. All this motivates to investigate the impacts ofsocio-economic factors and living conditions on the nutritional statusof the school going children. Using primary data from village Ganota,this study makes a modest attempt to answer two questions.
1) The first, which socio-economic factors are associated withthe nutritional status of the school-going children?
2) The second question is whether living conditions have anyimpact on the nutritional status of school-going children ornot?
Therefore, the purpose of this study was to know the impacts ofsocio-economic factors and living conditions on nutritional status ofschool-going children in rural areas of district Doda.
Objectives of the Study
The present study was carried out in village Ganota district Dodawith the following objectives:
1) To assess the nutritional status of 6-14 year old school goingchildren of village Ganota, district Doda.
2) To investigate the prevalence of stunting, wasting andunderweight in the village.
3) To investigate the association among socioeconomic factors,living conditions and child undernutrition.
Materials and Methods
The purpose of the present study was to assess the nutritionalstatus of the school going children of village Ganota in district Doda:
Area under Study: The study was carried out in village Ganotaof district Doda, Jammu & Kashmir, India. According to DistrictHandbook [20], the district Doda, like other districts has derived its name from its district headquarters at Doda. The records revealthat one of the ancient Raja of Kishtwar whose dominion extendedbeyond Doda persuaded on utensil maker namely Deeda a migrantfrom Multan (Pakistan) to settle permanently in his territory and setup a utensil factory there. Deeda is then said to have settled in villagewhich later on came to be known after him. With the passage of time,the name Deeda got distorted into Doda, the name which continuesto be known at present time.
Doda district lies in the outer Himalayan range in Jammu AndKashmir State. District Doda is located about 175 kilometer fromJammu and about 200 kilometer from Srinagar. It is comprised of 7tehsils and 10 CD blocks.
Sample size: 100 school-going children between the age groupof 6-14 years constituted the study subjects for the present study.The subjects were chosen randomly, as the study is a preliminaryinvestigation and the results show some trends of variation in terms ofnutritional status and socio-economic factors and living conditions.
Questionnaire: After getting consent from the parents, theinformation regarding anthropometric characteristics of the childrenand demographic features of the family and mothers were collectedthrough a well designed questionnaire cum interview schedule byvisiting their houses either from the mothers themselves or any otherfamily member.
Factors studied: For the association with the nutritional statusof the school going children; the factors studied included, socioeconomicfactors - family type, family size, mothers’ educational levelsocial caste, income of the family, economic category i.e BPL/APL,social category, land owned, age, sex and birth order of the child andliving conditions - house sanitation/nature of house, type of cookingarea and fuel used.
Anthropometric Measurement: The present study was basedon Anthropometric Assessment (indirect approach13) to identify theundernourished school aged children. Anthropometry now-a-dayshas become a practical tool for determining the nutritional status ofchildren and the well being of the children is indicated in a best way bythe nutritional status globally [21]. The anthropometric informationwas collected with the help of a self design questionnaire.
Digital Weighing Scale: For weighing children a digital weighingscale was used. The scale had a maximum capacity 0f 200 kg. Theweight measurement was recorded to the nearest 0.5 kg.
Stature Meter: A stature meter/height measuring tape has beenused for measuring the height of the children. The instrument hada maximum capacity of 200 CM. The stature meter was fixed alongwith the wall and children were allowed to stand in bare foot formeasurement. The height measurement was recorded to the nearest 0.5 cm.
The z-scores system were used to classify three measures ofchild undernutrition i.e. height for age (stunted), weight for age(underweight) and body mass index for age (wasting), following theinternationally accepted cut-off points with reference to WHO 2007 standard [22]. A child who is below minus two standard deviation(-2SD) from the median of a reference population in terms of heightfor-age, weight-for-age and body-mass-index for age is considered asstunted, underweight and wasted respectively.
Statistical Analysis
Data was entered and analyzed using statistical software epi info7(available at www.cdc.gov). Z-scores system was used to assess thenutritional status of the children by using software -WHO AnthroPlus (version v1.0.4) by comparing with WHO reference 200714.Statistical techniques were used for testing the significance ofassociation between the socioeconomic factors, living conditions andnutritional status of the school going children.
Results and Discussion
A total of 100 school-going children (Male - 79, Female - 21)were examined. The findings of the study revealed that the Girls wereslightly taller (except for age group 7) and heavier (age groups 6 and14) than boys (Table 1). Both the boys and girls were shorter (exceptfor 7 & 8) and lighter (except for age groups 7, 8 and 9) compared tothe Indian Council for Medical Research (ICMR) reference data fortheir ages and sex.
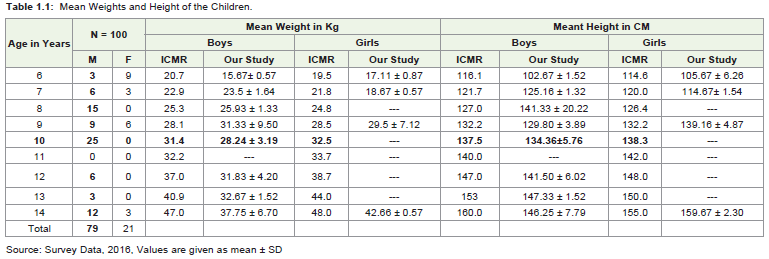
Table 1: Mean Weights and Height of the Children.
Table 2, shows that out of the total children screened (N=100),36.00 percent were found stunted, 9.00 percent underweight and2.00 percent observed as wasted. It was further observed that femalechildren were at higher risk of undernutrition in terms of stunting(42.86 percent of the female children), whereas underweight (11.39percent and wasting (2.53 percent) were prevalent only in malechildren. But no significant association was found.
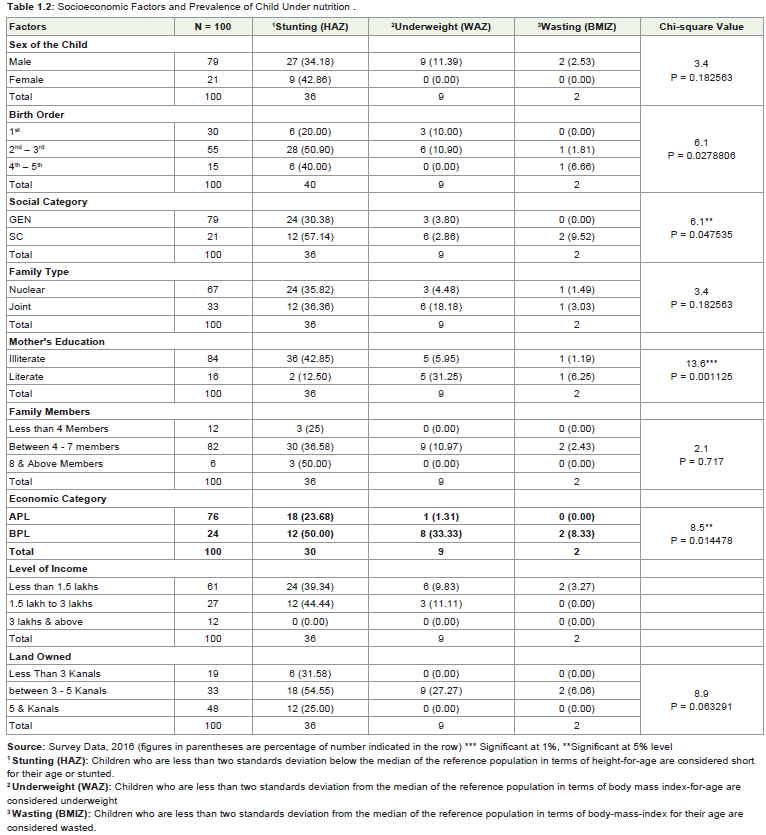
Table 2: Socioeconomic Factors and Prevalence of Child Under nutrition .
Undernutrition in the present study was lower for first births andconsistently increases with increasing birth order for all measures ofnutritional status (except for stunting for birth orders 4th – 5th). Ourfindings are similar to that of NHFS-3, where the rate of undernutrition for the first birth in 2005-06 was 41.00 percent, it is 47.80 percent ifthe birth order is 2nd - 3rd, 54.30 percent for birth order 4th – 5th andit is 61.00 percent for the birth orders 6th and above. This may be thereason that after the birth of a new baby, the old one gets neglected.No significant association was found between birth order and childundernutrition. Social category is also an important determinant ofundernutrition, as majority of the children belonging to ScheduleCaste category (57.14 percent) were suffering from stunting.
The findings of the present study revealed that all the three levelof undernourishment - stunting (36.36), underweight (18.18 percent)and wasting (3.03 percent) were prevalent more among the childrenbelonging to the joint families as compared to nuclear families.This may be the reason that the per-capita calories consumptionbecomes less in joint family system. But no significant associationwas found. Economic category determines the purchasing power ofthe households to purchase the commodities from the market. It wasfound that the children belonging to the Below the Poverty Line (BPL)category were suffering from stunting (50.00 percent), underweight(33.33 percent) and wasting (8.33 percent).
Table 2 show that 61. 00 percent of the children belong to lowfamily income level, out of which stunting, underweight and wastingwere 39.34 perc ent, 9.83 percent and 3.27 percent respectively.At higher level of income no case of malnourishment has been found.
It was found that 84.00 percent of the children belong toilliterate mothers, 42.00 percent of them were stunted, 5.95 percentunderweight and 1.19 wasted.
Significant differences (p< 0.05) were found among the mother’s and the prevalence of child undernutrition. These results agree withseveral studies carried out by Jane E Miller et al, [23], Abuya B A et al,[24], Ahmad E et al, [25] and Kumkum Kumari [26].
Living Conditions and Child Undernutrition
The living conditions depend upon the factors like type of house,the availability of safe drinking water, sanitation, type of cookingarea, type of cooking fuel used, health environments and the natureof the head of the family. The living conditions are very importantfactor needed for the proper growth of the child. For example, astudy conducted in USA in which 11723 low-income families wereinvestigated. The findings of the study shows that the children of lowincomefamilies, who receive public housing subsidies are less likelyto have anthropometric indications of undernutrition than those oflow-income not receiving housing subsidies [27].
Table 3 shows that all the measures of undernutrition weremore associated with the household cooking inside the bedroom(60.00 percent stunting, 22.22 percent underweight and 7.40percent wasting) or in an open space (44.44 percent stunting). Thehouseholds use wood as fuel for cooking the food were at higherrisk of stunting (39.13 percent) as compared to the households usedLPG. A higher number of children were suffering from the problemof stunting (60.00 percent), underweight (15.00 percent) and wasting(5.00 percent) not having toilet facility at home and face unhygienicproblems.
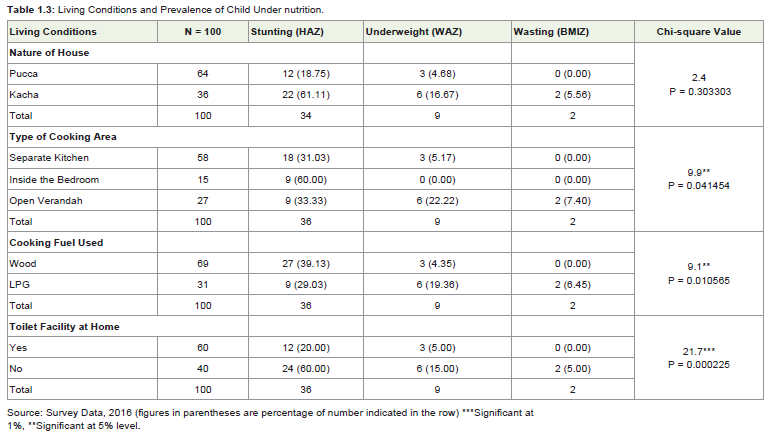
Table 3: Living Conditions and Prevalence of Child Under nutrition.
Significant differences (p< 0.05) were found between the typesof cooking area, fuel and toilet facility available at home and theprevalence of undernutrition. These results agree with several studiesreported [28,29].
Summary and Conclusions
Undernutrition among children is increasingly recognized asa major prevalent and important public health problem in manydeveloping countries including in India, which has a long-termconsequences for the human and economic development [30].Income is the most important and influential determinants of childundernutrition, as greater incomes at household level make it easyto invest more in food consumption, access to clean drinking water,good hygiene and adequate health and child care arrangements [31].
It was found that besides poverty, there are other socio-economicfactors - (mother’s education, birth order in the family, joint familysystem, social and economic categories of the children) and livingconditions – (nature of sanitation, cooking area and fuel used) thatdirectly or indirectly affect the nutritional status (undernutrition)of the school-going children. The present study showed a higherprevalence of stunting (36.00 percent) among the selected schoolgoing children as compared to other studies - NHFS-3, Subramanyamet al. [9] and Yasmeen & Nelofar, [10]. This is possible due to that thesample drawn from a particular village having lower socio-economicstatus and this cannot be compared to the national findings in thesame age group.
There is a great need to focus the attention of the leaders andpolicy-makers for intervening in such areas, as nutritional status of children is a main indicator of development and a pre-condition forthe society to progress.
Conflict of Interests
The authors declare that there is no conflict of interests regarding the publication of this paper.
Acknowledgement
The authors gratefully acknowledge the support and co-operation given by the parents and children participated in the field survey.
References
- Smith LC, Lawrence H (1999) Explaining Child Under nutrition in Developing Countries: A Cross-Country Analysis. Food Consumption and Nutrition Division International Food Policy Research Institute FCND Discussion Paper NO. 60.
- Nandy S, Irving M, Gordon D, Subramanian SV, Smith GD (2005) Poverty, Child Under nutrition and Morbidity: New Evidences from India. Bulletin of World Health Organization: the International Journal of Public Health 83: 210-216.
- Thakur R, Gautam RK (2014) Prevalence of Under nutrition among school going boys (5-18 years) of a central Indioa city (Sagar). Human Biology Review 3: 364-383.
- UNICEF - WHO - World Bank Group joint child Under nutrition estimates Key findings of the 2015 edition, Levels and trends in child under nutrition.
- United Nations (2010) Human Development Report. The Real Wealth of Nations: Pathways to Human Development. UNDP; New York USA.
- Black RE, Victora CG, Walker SP, Bhutta ZA, Christian P, et al. (2013) Maternal and child under nutrition and overweight in low-income and middle-income countries.
- Census of India 2011, District and Census Handbook Doda. Directorate of Census operation J&K.
- Economic Survey 2014-15, Government of India Ministry of Finance Department of Economic Affairs Economic Division February, 2015.
- Subramanyam MA, Kawachi I, Berkman LF, Subramanian SV (2011) Is Economic Growth Associated with Reduction in Child Under nutrition in India? PLoS Med 8: e1000424.
- Khan Y, Khan N (2012) Nutritional status of Children (0-24 months) in Jammu, Kashmir & Ladakh regionsâ€. International Journal of Scientific and Research Publications, 2.
- Global Nutrition Report (2014) Actions and Accountability to accelerate the world's progress on nutrition. IFPRI; Washington DC, USA.
- World Health Organization (1995) Under nutrition: the global pictureâ€; Geneva.
- Victoria CG, Adair L, Fall C, Hallal P, Martorell R, et al. (2008) Maternal and Child Under nutrition: Consequences for Adult Health and Human Capital. The Lancet 371: 340-357.
- Rausch R (2013) Nutrition and Academic Performance in School-Age Children The Relation to Obesity and Food Insufficiency. J Nutr Food Sci 3: 190.
- Tate WF (2013) How does health influence school dropout? Washington University in St. Louis.
- Soemantri AG, Pollitt E, Kim I (1985) Iron deficiency anemia and educational achievement among school age children in a rural community in Indonesia. Am J Clin Nutr 42: 1221-1228.
- Chinyoka K (2014) Impact of poor nutrition on the academic performance of grade seven learners: A case of Zimbabave. International journal of learning & development 4: 73-84.
- UNICEF (2009) Strategy for improved nutrition of children and women in developing countries" UNICEF, New York, NY USA.
- Veugelers PJ, Fitzgerald AL (2005) Dietary intake and risk factors for poor diet quality among children in Nova Scotia. Can J Public Health 96: 212-216.
- Census of India 2011, District and Census Handbook Doda. Directorate of Census operation J&K.
- de Onis M, Oxyango AW, Borghi E, Siyam A, Nishida C, et al. (2007) Development of a WHO growth reference for school age children and adolescents. Bulletin of the World Health Organization 85: 660-667.
- World Health Organization (2007) Growth Reference Data for 5-19 Years. Geneva.
- Miller JE, Rodgers YV (2009) Mother’s Education and Children’s Nutritional Status: New Evidence from Cambodi. Asian Development Review 26: 131-165.
- Abuya BA, Ciera J, Kimani-Murage E (2012) Effect of mother's education on child's nutritional status in the slums of Nairobi. BMC Pediatr 12: 80.
- Ehtisham A, Salman K, Zulfia K (2011) Nutritional status in children (1-5 yrs)- A Rural Study. Indian Journal of Community Health 2: 84-86.
- Kumari K (2007) Differentials of nutritional status in school-age children and the associated factors. Health and Population Perspectives and Issues 30: 268-277.
- Meyers A, Cutts D, Frank DA, Levenson S, Skalicky A, et al. (2005) Subsidized housing and children's nutritional status: data from a multisite surveillance study. Arch Pediatr Adolesc Med 159: 551-556.
- Henry FJ (1980) Environmental sanitation infection and nutritional status of infants in rural St. Lucia, West Indies. Trans R Soc Trop Med Hyg 75: 507-513.
- Priya B, Parul G (2011) Nutritional status and access to clean fuels: Evidence from South Asia. Paper presented in Agricultural and Applied Economics Association's 2011 AAEA and NAREA joint annual Meeting, Pittsburg, Pennglvania.
- Bisai S, Bose K, Ghosh A (2008) Prevalence of Under nutrition of Lodha Children aged 1-14 Years of Paschim Medinipur District, West Bengal, India. Iran J Pediatr 18: 323-329.
- Katoch OR (2012) Child undernutrition: Cause and Consequences Radix International Journal of Social Science 1: 1-12.