Research Article
Effect the Industrial Process and the Storage Periods on the Nutritional Value of Tomato Juice
El-Dengawy RAH1, El-said SMM2, El-Kadi SML3, Shalata AAM1
1Food industries, Department of Faculty of Agriculture, Damiutta University, Damiutta, Egypt
2Food Science and Technology, Department of Faculty of the Home Economics, Al-AzharUniv., Tanta Egypt
3Microbiology Department, Faculty of Agriculture, Damiutta University, Damiutta, Egypt
Corresponding author: Shalata AAM, Food industries, Department of Faculty of Agriculture, Damiutta University,Damiutta, Egypt; E-mail: amro.shalata@yahoo.com
Citation: El-Dengawy RAH, El-said SMM, El-Kadi SML, Shalata AAM. Effect the Industrial Process and the Storage Periods on the Nutritional Valueof Tomato Juice. Indian J Nutri. 2016;3(1): 121.
Copyright © 2016 El-Dengawy RAH, et al. This is an open access article distributed under the Creative Commons Attribution License, which permits unrestricted use, distribution, and reproduction in any medium, provided the original work is properly cited.
Indian Journal of Nutrition | ISSN: 2395-2326 | Volume: 3, Issue: 1
Submission: 05/03/2016; Accepted: 21/03/2016; Published: 28/03/2016
Abstract
In this study, the effect of processing and storage time on the chemical composition, physical properties and active compound contents of raw and tomato juice was evaluated. The raw tomato had 95% of moisture, 5% total soluble solids, acidity 0.45, PH4.2, 15.6mg vitamin C/100g, 31.5 mg/ kg lycopene, phenolic compound 22.68 mg GAE /kg and flavonoids 6.43 mg RE /kg. The study investigated the effect of storage for tomato juice during 18 months in zero times, 6months, 12 months and 18 months, there was slightly differences through this period in PH from 4.5 to 4.2, acidity from 0.81 to 0.65, phenolic compound between 34.18 and 30.2 mg GAE /kg, flavonoids ranged from 10.51 to 9.0 mg RE /kg vitamin C ranged from 24.50 to 20.18 mg /100g and lycopene from 85.41 to 79.22mg /Kg.
Keywords: Tomato juice; Lycopene; Phenolic; Antioxidant; Phytochemical; Processing; Microorganisms
Introduction
Tomato (Lycopersicumesculentum) is one of the most consumedfruits in the world, either as a raw fruit or as a processed product.In fact, in the entire world, tomatoes are second only to potatoes ineconomic importance and consumption and are used in the foodstuff industry as raw material for the production of several productssuch as juices, sauces, purees, pastes, and canned tomatoes. In recentdecades, the consumption of tomatoes has been associated with theprevention of several diseases. Consumption of processed tomatoproducts is rising in western countries. Between 1996 and 2001, thequantity of processed tomatoes increased from 7.88 to 8.45 milliontons in the EU Tomato, as a fresh or transformedproduct, possesses a high nutritional value, due to its contentof different types of micronutrients: vitamins (C and E), folates,carotenoids and phenolic compounds [1,2]. Fruit juice colour is aprimary factor considered by the consumer in assessing juice quality and sensory acceptance [3]. The nutritional quality of tomato juiceis primarily related to the ascorbic acid content and the presenceof bioactive compounds, such as lycopene, which is responsible fortomato juice colour [4-6]. Lycopene has been shown to have strongantioxidant activity; it exhibits the highest physical quenching rateconstant with singlet oxygen; it induces cell-to-cell communication;and it modulates hormones, immune systems, and other metabolicpathways [7]. Carotenoids, other antioxidant compounds such asphenolics also contribute to the beneficial effects of tomato products.Phenolics possess reducing character, capacity of sequesteringreactive oxygen species (ROS) and several electrophiles, tendencyto self-oxidation and capacity to modulate the activity of some cellenzymes [8].
Thermal processing is conventionally used to inactivatemicroorganisms and enzymes and extend the shelf life of juiceproducts. However, thermal processing can adversely affect the sensory and nutritive qualities of tomato juices [9,10].
The aim of this study, estimate the quality of the tomato juice byfinding out the effect of processing, storage process on the propertiesof the physical, chemical and active compound.
Material and Methods
Tomato and juice preparation
Tomatoes fruits (Licopersicon esculentum) were purchased fromsanad farm, Damietta Governorate, Egypt during the month ofAugust 2013. Only ripe and fresh tomatoes were used in this study.The tomato juice was prepared according to the method of [11].Tomato fruits were washed in water manually, chopped, squeezedin a blender (BRAUN 4184, Czech), cold extracted and sieved (0.8mm holes) to remove seeds and peels. The extract was concentratedto 9% T.S.S (juice) by using a rotary evaporator at 18 °C for 2h undervacuum and packaged in glass cans of 350g net weight. The cans weresterilized at 100 °C for 30 min. and were analyzed after (zero, 6, 12and 18 month) at room temperature.
Chemical composition
Chemical composition (moisture, proteins, fat, carbohydratesand ash) using the AOAC procedures (AOAC [12],). The crudeprotein content (N × 6.25) of the samples was estimated by themacro- Kjeldahl method; the crude fat was determined by extractinga known weight of powdered sample with petroleum ether, using aSoxhlet apparatus; the ash content was determined by incineration at600±15 °C. Total carbohydrates were calculated by difference.
Physical properties
PH value: PH value was determined according to the methoddescribed by A.O.A.C [12], as follows: A known weight of tomatoesand tomato products (juice, puree and ketchup) (10ml) were blendedwith (100ml) distilled water and PH of the slurry was then measuredusing (CRISON GLP 21) PH meter.
Total acidity
Total acidity was measured by titrating (10g) of tomatoes andtomato product (juice, puree and ketchup) with NaoH o.1N solutionusing (phph) as indicator. The results were expressed as % Citric acid,as described by A.O.A.C [12].
Color measurements
The Color measurement in tomato products was determined byMert [13]. The samples were filled into a clear glass Petri dish and color Parameters (a*and b*) were determined using a Minolta colorimeter(laboscientificas.r.l. - parma; Italy model: LS 2000). The Petri dishwas placed on the colorimeter sensor during measurements. Threemeasurements were taken for each sample and average values werereported.
Taste index and the maturity
A taste index and the maturity were calculated using the equationproposed by Navez, et al., [14] and Nielsen [15] starting from the Brixdegree and acidity values which were determined in a previous paper[16].
Formulas
Determination of phytochemical compounds
Total phenolic compounds: Total polyphenolic compoundsin the crude extract of raw tomato and tomato products weredetermined by the folin - ciocalteu method according to Meda et al.[17] as follows:
0.1gm lyophilized powder of tomato samples was dissolved inl ml deionized water. This solution (0.1ml) was mixed with 208mlof deionized water, 2ml of 2% Na2Co3 and 0.1ml of 50% folinciocalteaureagent. After incubation at room temperature for 30 min.The reaction mixture absorbance was measured at 750 nm against adeionized water blank on a spectrophotometer (JENWAY 6315 madein England). The concentration was calculated using gallic acid (GA)as standard and results were expressed as mg gallic acid equivalents(GAE)/gm lyophilized powder. Finally, the results were converted tomg GAE / 100gm fresh matter of tomato.
Total flavonoid
The total flavonoid content was determined according as thealuminum chloride colorimetric method described by Chang etal. [18]. Briefly, aliquots of 0.1 g of tomato and tomato productssamples were, respectively, dissolved in 1 ml deionized water. Thissolution (0.5 ml) was mixed with 1.5 ml of 95% alcohol, 0.1 ml of 10%aluminum chloride hexahydrate (AlCl3), 0.1 ml of 1 M potassiumacetate (CH3COOK), and 2.8 ml of deionized water. After incubationat room temperature for 40 min, the reaction mixture absorbancewas measured at 415 nm against a deionized water blank on aspectrophotometer (JENWAY 6315 made in England). Quercetinwas chosen as a standard using a seven point standard curve (0-50mg/l).
Antioxidant activities
Determination of Total ascorbic acid: Total ascorbic acid (vit.C) was estimated according Kapur et al., [19]. Samples of tomatoproducts and raw tomato were first chopped and homogenized ina laboratory homogenizer. Approximately 0.23mL of 3% brominewater were added into4 mL of centrifuged sample solution to oxidizethe ascorbic acid to dehydroascorbic acid and after that 0.13 mLof 10 %thiourea to remove the excess of bromine. Then 1 ml of 2,4 dinitrophenylhydrazine solution was added to form osazone. Allstandards, samples and blank solution were kept at 37 °C temperaturefor 3 hours in a thermostatic bath. After it all were cooled in icebath for 30 minutes and treated with 5 mL chilled 85% H2SO4, withconstant stirring. As a result, a colored solution’s absorbance wastaken at 521 nm on a spectrophotometer (JENWAY 6315 made inEngland).
Determination of lycopene
Extraction method was performed according to Fish et al., [20].Samples of tomato products and raw tomato were first chopped and homogenized in a laboratory homogenizer. Approximately 0.3 to 0.6g samples were weighed and 5 mL of 0.05% (w/v) BHT in acetone, 5mL of ethanol and 10 mL of hexane were added. The recipient wasintroduced in ice and stirred on a magnetic stirring plate for 15 min.After shaking, 3 mL of deionized water were added to each vial andthe samples were shaken for 5 min on ice. Samples were then left atroom temperature for 5 min to allow the separation of both phases.The absorbance of the hexane layer (upper layer) was measured in a1-cm-path-length quartz cuvette at 503 nm blanked with hexaneon aspectrophotometer (JENWAY 6315 made in England).
Statistical analyses
All results were performed in three replicates and the results werestatistically analysed. Significant statistical differences of observedchemical parameters means of tomato juices were determined by theFisher´s least significant differences (LSD) test, after the analysis ofvariance (ANOVA) for trials set up according to the RCB design.
Results
Chemical composition
Proximate chemical composition of fresh juice and processedjuice are presented in Table 1. Moisture 95 and 91%, protein 0.78and 1.50%, fat 0.49and 0.90% , fiber 1.13 and 1.58% , ash 0.90 and1.20%, carbohydrate 1.70 and 3.28% , total soluble solid (T.S.S) 5and9% and total energy 14.33and 27.22% respectively. From Table 1 alldifferences between fresh juice and processed juice were significantexcept ash there was no difference significant among there. Theresults were in agreement with that reported by Kamil et al. [21].
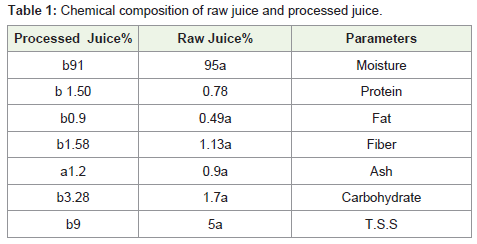
Table 1: Chemical composition of raw juice and processed juice.
Chemical composition of processed juices were determinedduring the storage period and presented in Table 2. From that table it was found that the moisture content is slightly reduced after 18month storage period comparing other storage periods.
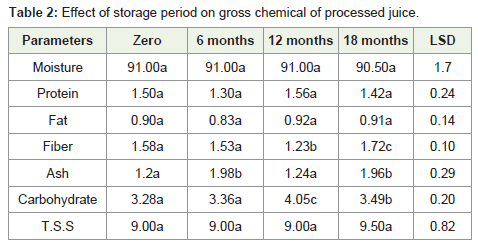
Table 2: Effect of storage period on gross chemical of processed juice.
No significant differences obtained during storage periods inprotein, fat and T.S.S content for tomato juice. Whereas there weresignificant differences in fiber, ash and carbohydrates during storageperiods. Similar results were reported by [21].
Physical properties of raw juice and processed juice:
As indicated in Table 3, there was significant difference in pHfor raw juice and processed juice 4.2 and 4.5, likewise acidity was0.45 and 0.81 raw juice and processed juice respectively. Whereas nosignificant differences in color and maturity between raw juice andprocessed juice. Such results were in general agreement with thosereported by Adekunte et al. [22] and Kamil, et al [21].
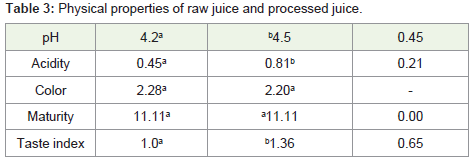
Table 3: Physical properties of raw juice and processed juice.
Effect of storage period on physical properties forprocessed juice
The analysis in Table 4 shows the pH of the processed juicesranged between 4.20 and 4.54 there was no significant differences.Whereas acidity ranged from 0.65 to 0.98, on other hand there wasvariation on color after 12 months and also maturity ranged from 9.18to 14.62 among storage periods. There was no significant differencesin taste index among storage periods.
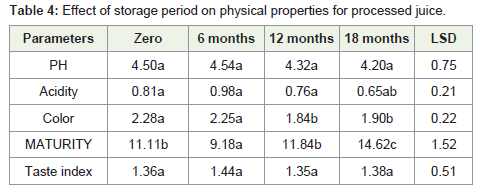
Table 4: Effect of storage period on physical properties for processed juice.
Effect of Thermal treatment on phytochemicals in freshjuice and processed juice
There were high increases in the lycopene contents of theprocessed juices than the contents determined in the fresh juice as shown in Table 5. Processing of food may improve the bioavailabilityof lycopene and hence its concentration by breaking down cell walls,which weakens the bonding forces between lycopene and tissuematrix, thus making lycopene more accessible and enhancing thecisisomerization [23]. The lycopene content in the processed juicefrom recorded the highest value of 85.41mg/100 g as compared to thefresh juice (31.5mg/100 g). The increasing of lycopene after processingis attributed to the fact that the trans isomers are converted to the cisisomers which are more bioavailable [24].
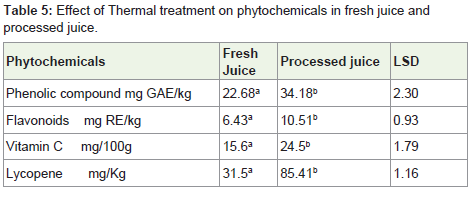
Table 5: Effect of Thermal treatment on phytochemicals in fresh juice andprocessed juice.
Total phenolic compound content in processed juice alsoincreased with increased heating time from 22.68 in fresh juice to34.18 (mg GAE/kg).
Vitamin C content in fresh juice was 15.6 mg/100g when theratio of T.S.S. 5 whereas the content of vitamin C in processedjuice 24.5mg/100g when the ratio of T.S.S. 9. As shown the ratioof vitamin C was decreased in processed juice compared fresh juicewhen taking into consideration the ratio of T.S.S.Flavonoids contentof fresh juice was 6.43,while the content of flavonoids after thermalprocessing increased to 10.51mg RE/kg.
Effect of storage periods in processed juice
As shown in Table 6 phenols, lycopene and vitamin C ratiosdecreased significantly among storage periods from zero time to 18months. While there was no significant differences in flavonoidsratio during storage periods in processed juice from zero time to 18months. Similar result reported by Odriozola-Serrano et al., [25] andOdriozola-Serrano et al., [26].
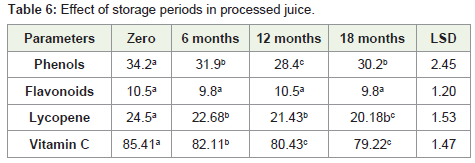
Table 6: Effect of storage periods in processed juice.
References
- Beecher GR (1998) Nutrient content of tomatoes and tomato products. Proc Soc Exp Biol Med 218: 98-100.
- 2. Periago MJ, Garcia-Alonso J (2009) Bioactive compounds, folates and antioxidant properties of tomatoes (Lycopersicumesculentum) during vine ripening. Int J Food Sci Nutrb60: 694-708.
- Carreno J, Martinez A, Almela L, Fernandez-Lopez JA (1995) Proposal of an index for the objective evaluation of the colour of red table grapes. Food Research International 28: 373-377.
- Erdman JW, Ford NA, Lindshield BL (2009) Are the health attributes of lycopene related to its antioxidant function? Arch Biochem Biophys 483: 229-235.
- Giovannucci E, Rimm EB, Liu Y, Stampfer MJ, Willett WC (2002) A prospective study of tomato products, lycopene, and prostate cancer risk. J Natl Cancer Inst 94: 391-398..
- Hsu KC (2008) Evaluation of processing qualities of tomato juice induced by thermal and pressure processing. LWT - Food Science and Technology 41: 450-459.
- Rao AV, Agarwal S (1999) Role of lycopene as antioxidant carotenoid in the prevention of chronic diseases: A review. Nutrition Research 19: 305-323.
- Robards K, Prenzler PD, Tucker G, Swatsitang P, Glover W (1999) Phenolic compounds and their role in oxidative processes in fruits. Food Chemistry 66: 401-436.
- Youssef AH, Rahman A (1982) Nutritional value of some canned tomato juice and concentrates. Food Chemistry 9: 303-306.
- Goodman CL, Fawcett S, Barringer SA (2002) Flavor, viscosity, and color analyses of hot and cold break tomato juices. Journal of Food Science 67: 404-408.
- EL Dengawy RAH, Ramadan BR, Garbe LA, Kurz T (2009) Carotenoids and Tocopherol Content of Tomato Fruits and Tomato Products. Journal of Agriculture Sciences. 34: 2945- 2951.
- AOAC (2000) Official methods of analysis. Association of official analysis chemist. EUA.
- Mert B (2012) Using high pressure microfluidization to improve physical properties and lycopene content of ketchup type products. Journal of Food Engineering 109: 579-587.
- Navez B, Letard M, Graselly D, Jost M (1999) Les criteres de qualite de la tomate. Infos-Ctifl, 155: 41-47.
- Nielsen S (2003) Food analysis (3rd ed.). New York: Kluwer Academic.
- Suarez MH, Rodrıguez RE, Dıaz Romero C (2007b) Analysis of organic acid content in cultivars of tomato harvested in Tenerife. European Food Research and Technology 226: 423-435.
- Meda A, Lamien CE, Romito M, Millogo J, Nacoulma OG (2005) Determination of the total phenolic, flavonoid and praline contents in Burkina Fasan honey, as well as their radical scavenging activity. Food Chemistry 91: 571-577.
- Chang CC, Yang MH, Wen HM, Chern JC (2002) Estimation of total flavonoid content in propolis by two complementary colorimetric methods. Journal of Food and Drug Analysis 10: 178-182.
- Kapur A, Haskovic A, Copra-Janicijevic A, Klepo L, Topcagic A, et al. (2012) Spectrophotometric analysis of total ascorbic acid content in various fruits and vegetables. Bulletin of the Chemists and Technologists of Bosnia and Herzegovina 38: 39-42.
- Fish WW, Perkins-Veazie P, Collins JK (2002) A quantitative assay for lycopene that utilizes reduced volumes of organic solvents. J Food Compos Anal 15: 309-317.
- Kamil MM, Mohamed GF, Shaheen MS (2011) Fourier transformer infrared spectroscopy for quality assurance of tomato products. J Am Sci 7: 559-572.
- Adekunte A, Valdramidis VP, Tiwari BK, Slone N, Cullen PJ, et al. (2010) Resistance of Cronobacter sakazakii in reconstituted powdered infant formula during ultrasound at controlled temperatures: a quantitative approach on microbial responses. Int J Food Microbiol 142: 53-59.
- Maguer M, Shi J (2000) Lycopene in tomatoes, chemical and physical properties affected by food processing. 4th ed. Chapman and Hall, NY. pp. 293-294.
- Barret E, Garcia M (2005) Assessing Lycopene content in California processing tomatoes. J Food Process. Preserv 30: 56-70.
- Odriozola-Serrano I, Soliva-Fortuny R, MartÃn-Belloso O (2008) Changes of health-related compounds throughout cold storage of tomato juice stabilized by thermal or high intensity pulsed electric field treatments. Innovative Food Science & Emerging Technologies9: 272-279.â€
- Odriozola-Serrano I, Soliva-Fortuny R, Hernández-Jover T, MartÃn-Belloso O (2009) Carotenoid and phenolic profile of tomato juices processed by high intensity pulsed electric fields compared with conventional thermal treatments. Food Chemistry 112: 258-266.â€