Research Article
Determinants of Nutrition and Risk ofDeveloping Non-Communicable Diseases in Adult Women
Sowmya G Rao*and Shashikala Puttaraj
Department of Studies in Food Science and Nutrition, Manasagangothri, University of Mysore, Mysore 570 006, Karnataka,India
Corresponding author: Sowmya G Rao, Department of Studies in Food Science and Nutrition, Manasagangothri,University of Mysore, Mysore 570 006, Karnataka, India; E-mail: raosowmya23@gmail.com
Citation: Rao SG, Puttaraj S. Determinants of Nutrition and Risk of Developing Non-Communicable Diseases in Adult Women. Indian J Nutri. 2015;2(2): 116.
Copyright © 2015 Rao SG, et al. This is an open access article distributed under the Creative Commons Attribution License, which permits unrestricted use, distribution, and reproduction in any medium, provided the original work is properly cited.
Indian Journal of Nutrition | ISSN: 2395-2326 | Volume: 2, Issue: 2
Submission: 01/12/2015; Accepted: 21/12/2015; Published: 25/12/2015
Abstract
The present study was conducted on women in the group of 20-60 years in Mysore city of Karnataka. The study group consisted of 250 Normal women and 250 women affected by Diabetes, CVD, obesity and arthritis. A preformed questionnaire was used to record personal data, anthropometric measurements, dietary intake and activity record of the selected women. Majority of women from both the groups belonged to nuclear type of family. The dietary pattern of these women in the group irrespective of their normal or disease status followed a similar pattern comparable to that prevalent in Mysore city, Karnataka. Anthropometric data revealed that the heights and weights of the women were significantly different with women in the normal group being taller and less heavy than the women in the disease groups. Results also showed that women in the Normal group were more physically active in terms of household work, office work despite the time spent in personal care being similar in both the groups. The results of the study statistically analyzed using multiple variant analysis (correlation coefficient and regression concepts) indicated age and menopausal status to be influencing most of the dependant variables like energy intake, energy expenditure, protein and fat intake independently followed by physical activity and stress factors in the selected women. The determinants of the nutrition for both groups appeared to be age, energy, protein intake, fat intake, physical activity and educational levels being influenced by stress and age at marriage to a greater extent. The study concluded that the negative influence of these independent variables would certainly increase the risk of NCD among the selected women.
Keywords: Non-communicable diseases; Somatic Status; Food intake; Adult women
Introduction
Nations worldwide are experiencing epidemiologic transitionswith increase in the population life expectancy and chronic Noncommunicable diseases (NCDs)–such as obesity, diabetes, cardiovasculardiseases, osteoporosis, arthritis etc emerging as a leading cause ofmorbidity and mortality [1]. The stages and patterns of epidemiologictransition may vary across nations, but several common factors arereported to underlie these trends [1].
The risk factors of today are stated to be the diseases of tomorrow.Hence, identifying these risk factors in populations occupies a central place as lagged time exist between exposure and disease in any givenindividual / population. Therefore, strategies of prevention of diseasesneed to be based on not only identifying risk factors in population,but also understanding the profile of risk factors in different settings[2,3].
Chronic diseases result from genetic, behavioral andenvironmental factors and the interactions between them. Thesefactors generally termed risk factors, produce molecular andstructural changes in organ system and may produce signs of diseasebut often after a long period of time, even decades for most chronicdiseases. Several risk factors clustering together may contribute to the development of NCDs [4].
NCDs account for most of the global burden of disease as aconsequence of past and cumulative risks. Hence, the future burdenwill be determined by current population exposure to risk factors.Although the major risk factors for NCD epidemics are morecomplex than those for infectious diseases, they are well known andaccount for almost all such events; many are common to the maincategories of NCDs and most are modifiable and operate in the samemanner in all regions of the world, with some quantitative differences[5-7]. Therefore, the present study was undertaken to assess thedeterminants of nutrition and to analyze the risk for developing NCDin women.
Materials and Methods
The target group of the study comprised of 250 women having anormal BMI and also 250 women affected with NCD viz, Arthritis,Cardiovascular disease (CVD), Type 2 Diabetes Mellitus (DM),Obesity and cluster group with combinations of DM,CVD, arthritisand obesity in the age group of 20-60 years (y).
The study was conducted at Vikram hospital and clinic locatedin Mysore city. Women visiting hospital outpatient department werescreened by measuring their body weight and for the presence orabsence of a specific NCD.
Normal women -Executives (EX), Non- Executives (NEX) andwomen not gainfully employed (NE) in the age range of 20-60 y withno diagnosed disease/disorders having BMI within the normal rangeas far as possible were drawn from different locations which includedaccompanying persons with patients, working in specific institutionsand from selected households in Mysore city.
Permission from Human Ethical Committee of University ofMysore as well as the concerned Hospital authorities was obtained toconduct the study on human subjects.
A preformed questionnaire was used to record personal data,anthropometric measurements, dietary intake, activity record, andstress scores of the selected women.
The food intake of all the women was assessed by interviewing thewomen with the help of household measures relevant to Indian cuisinemodels to construct the individual women’s 24-hour food intake. Rawamounts for the cooked food items were derived by standardizing thepreparatory methods of different menu items. The total energy intakewas derived by the amount of macronutrients included in the diet [8].The energy intake of the women was compared against recommendeddietary intake for ensuring the appropriateness of intake derivedbased on the Recommended Dietary Allowances for age, gender andactivity [9].
Anthropometric measurements- Height (cm), Weight (kg),Mid-upper arm circumference (MUAC), Waist (cm), Hip(cm),Triceps Skin Fold (TSF)(mm), measurements using the standardprocedure [10,11] were recorded for all the 500 subjects. Waist andhip measurements were used to calculate waist -hip ratio (WHR).Other Indices like Mid-upper arm muscle circumference (MUAMC),Conicity index, Broka’s index, Body Fat percent (BF%), Lean body mass index (LBMI), Lean body Mass (LBM), and Body density (BD)were calculated using formulas.
Energy expended in different activities for two consecutive dayswas computed using the data on time use recalls of the subjects as perthe Food and Agriculture Organization/World Health Organizationestimates [12] of energy required per minute for specified class ofactivities.
The computed data was analyzed for statistical significance usingdifferent statistical tools. These tests include mean, standard deviationand percentages, which are used in simple comparison of differentcategories and frequencies. Chi- square was applied to find out thesignificance of variance in the study groups. Multiple variant analyses- correlation coefficient and regression concepts was used to findout the significant contribution made by the different independentvariables on the dependent variable.
Results and Discussion
Demographic characteristics of women in Normal and Diseasegroup as shown in Table 1 and 2 indicated that majority of thefamilies in both the groups were of nuclear type. Except for the familycomposition, other demographic characteristics were not significantin the disease group.
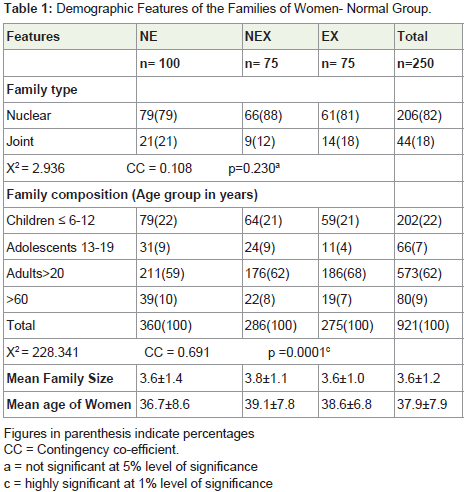
Table 1: Demographic Features of the Families of Women- Normal Group.
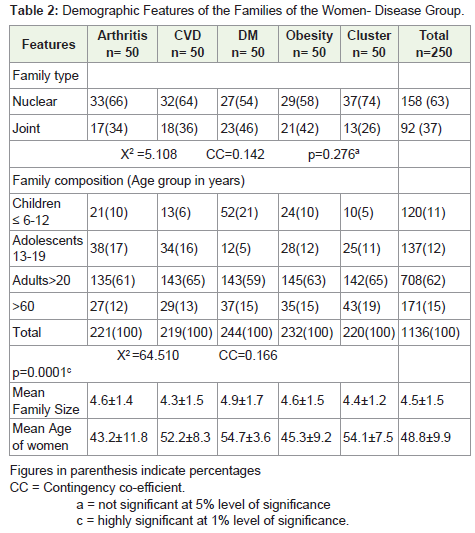
Table 2: Demographic Features of the Families of the Women- Disease Group.
Socio economic characteristics of Normal women are presentedin Table 3. Majority of the women (92%) in the study group belongedto ‘Hindu’ by religion. Educational status of the women in EX wasfound to be better and higher than the NEX with women in NE (63%)having only graduation. It was found that 89% of women in EX werepost graduates as compared only to 47% in case of NEX. However,53% of NEX was found to be graduates.
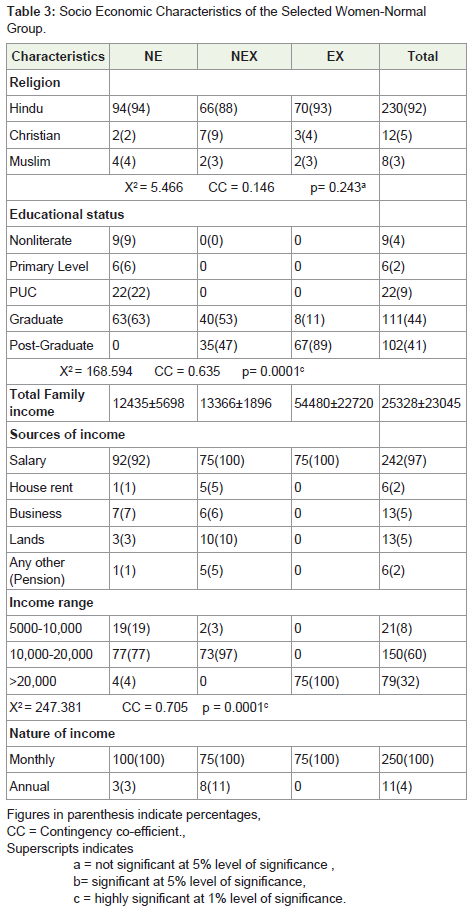
Table 3: Socio Economic Characteristics of the Selected Women-NormalGroup.
As shown in Table 4, 94% of the women in the Disease group, belong to Hindu by religion. The educational status was found tobe low with 34% being Nonliterate and 42% having studied up toprimary level. Thus, the educational status was found to be low forthis group of women.
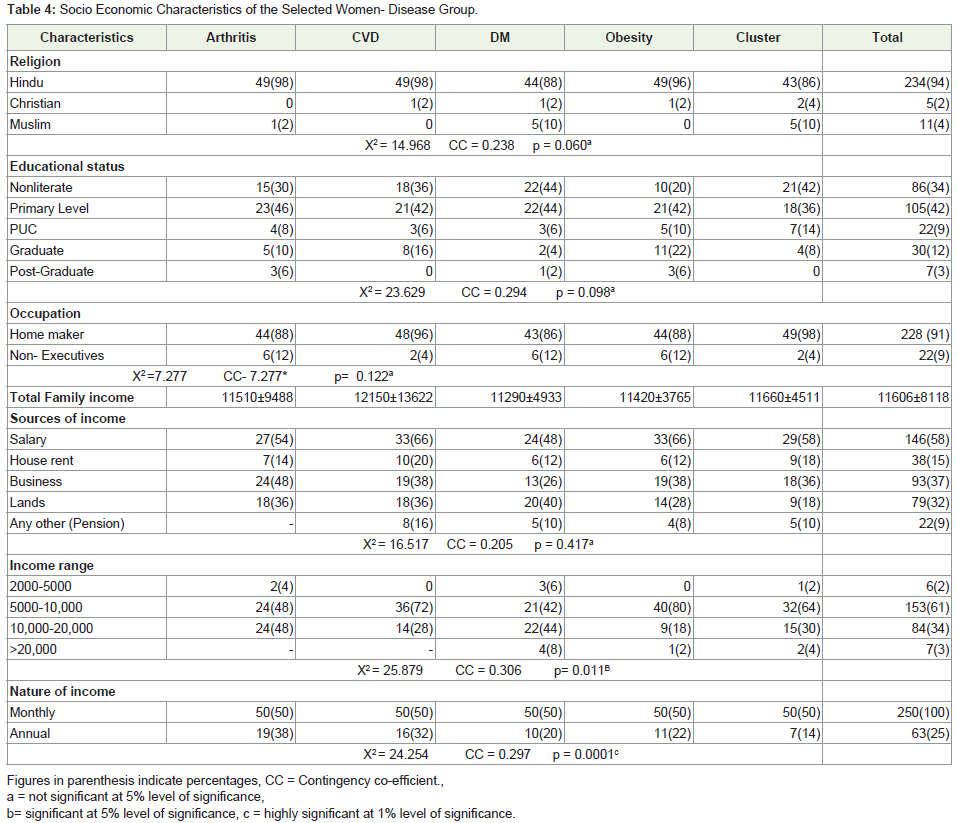
Table 4: Socio Economic Characteristics of the Selected Women- Disease Group.
An appraisal of marital status of women in the normal grouprevealed that 95% were found to be married. Distribution of womenby their marital status between the groups was found to be significant.Age at menarche, marriage and menopause was found to be in theacceptable range generally indicated for women in India Table 5. Themean age at menarche was found to be significantly higher in NEXand EX group. Most of the women (79%) reported having a regularmenstrual cycle. Mean age at menopause was in the range of 44 to46 y for these women. The number of women who had undergone‘Hysterectomy’ was found to be very low (7%). The information onthe method of family planning used was collected only from thosewomen who were currently using different contraceptives. Thedistribution of women using different methods of family planning(currently) was found to be significant with most of the couples (47%)adapting ‘condom’, followed by ‘pills’ (10%), ‘copper T’- (8%).
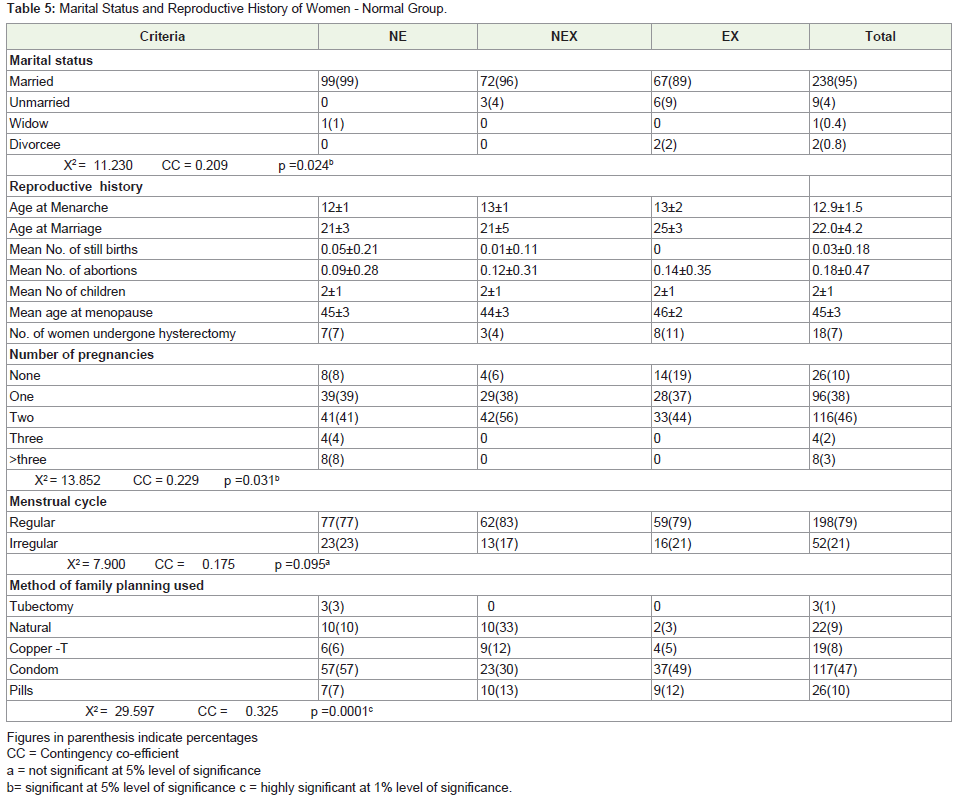
Table 5: Marital Status and Reproductive History of Women - Normal Group.
Marital status of women (Table 6) in the Disease group showedthat 87% to be married with distribution of women between thegroups to be significant. While age at menarche was found to bein the normally acceptable range, age of menopause was found tooccur early, at a mean age of 44.7 y. Women experiencing irregularmenstrual cycle were found to be in greater percentage in OB (48%)followed by cluster group (34%). Higher percentage of women(46%) having CVD had undergone hysterectomy followed by OBand women showing cluster of diseases (30%). The most commoncausative factor for undergoing hysterectomy was the presence of fibroid. The method of family planning used as reported by thewomen was found to be ‘pills’. Though, number of women adaptingfamily planning methods currently was small, the distribution ofwomen using different methods of family planning was significant.
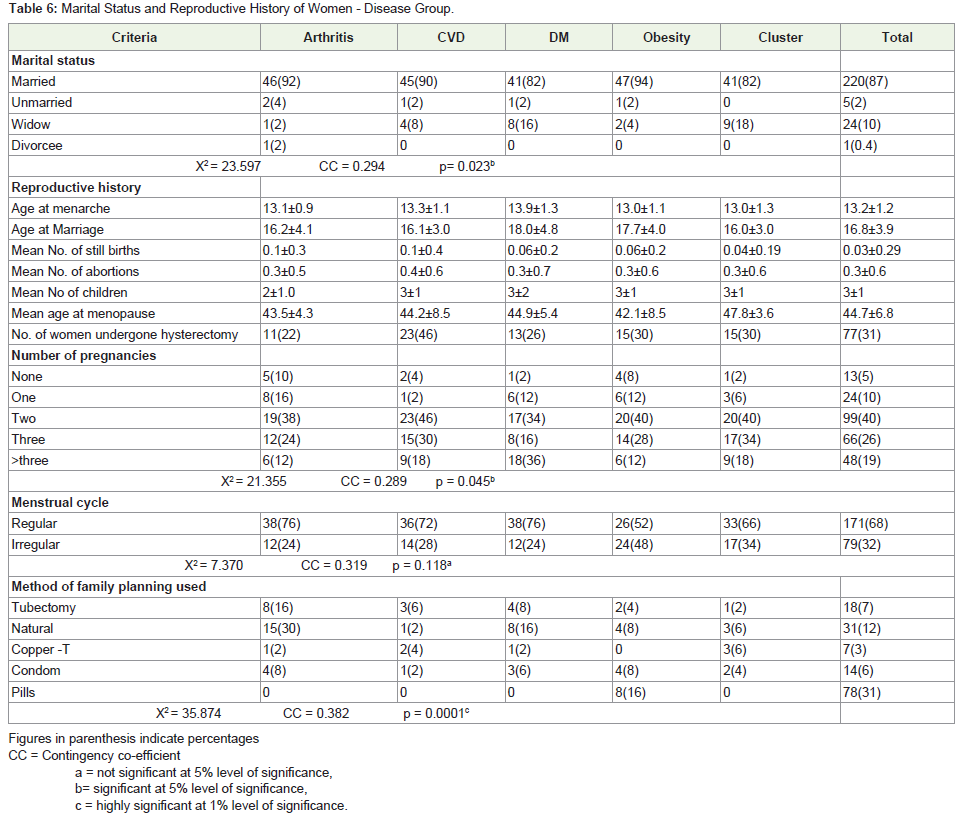
Table 6: Marital Status and Reproductive History of Women - Disease Group.
The food intake of women in the study group-normal anddiseased group is shown in Table 7. Among the food groups, exceptfor the intake of cereals and pulses all other foods excluding fats/oils showed considerable differences in being highly significantbetween the normal and disease groups. The differences were seenin the intake of green leafy vegetables, other vegetables, milk and itsproducts and fleshy foods like chicken, fish and mutton being higherin the normal group as compared to the disease group. The exception was nuts and oilseeds /coconut which were higher in the diseasegroup than the normal. The mean intake of energy and nutrients ofwomen in the normal and disease groups are shown in Table 8. Theintake of energy, protein and carbohydrate were significantly higherin the normal group than the disease group. So also the intake ofall micronutrients was higher in the normal group than the diseasegroup. The micronutrients which were adequate in both the groupswere calcium, thiamine and ascorbic acid. The nutrient that weredeficient in both the groups were iron and niacin which were muchbelow the RDI besides the women in the disease group were alsodeficient in the intake of retinol, riboflavin with ascorbic acid beingjust adequate. However, due to the wide variation in the SD, bothretinol and ascorbic acid could be adequate in few of the women inthe disease groups.
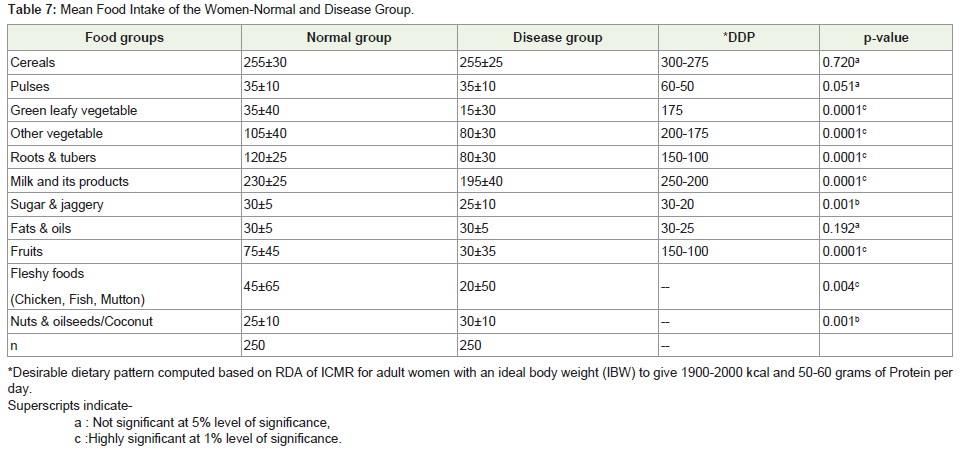
Table 7: Mean Food Intake of the Women-Normal and Disease Group.
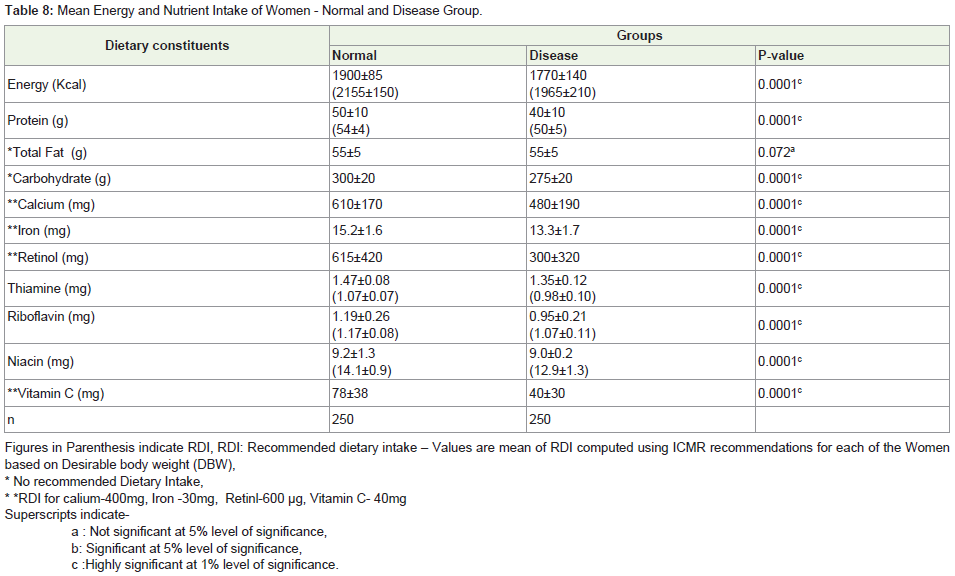
Table 8: Mean Energy and Nutrient Intake of Women - Normal and Disease Group.
Somatic status of the women in the normal and disease groups arepresented in Table 9 and 10. The heights and weights of the women were significantly different with women in the normal group being taller andless heavy than the women in the disease groups. Both BMI and WHRwere found to be higher in the disease group than the normal. Though, theindicators of protein and fat status-MUAC, MUAMC and TSF were similarbetween the normal and disease groups, waist and hip measurementssignificantly differed. However, body fat in Kg, Body fat percentage weremuch higher in the disease groups and body density much lower, all theseadditional anthropometric indices being highly significant.. Broka’s index, which is similar to BMI, was higher for the women in the disease groupbeing above the normal range. LBMI was higher in the normal womenindicating higher lean body mass. Thus, somatic status indicated greaterbody compositional changes towards increased fat mass and decreasinglean body mass for women in the different disease groups as compared tothe women in the normal group.
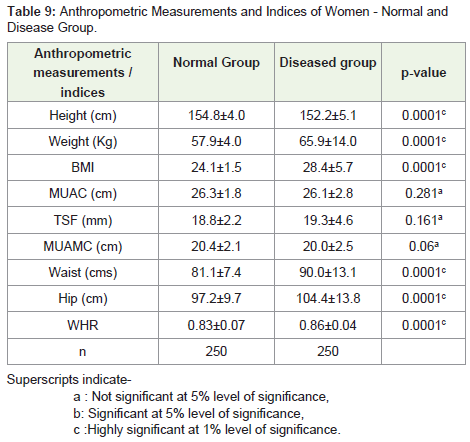
Table 9: Anthropometric Measurements and Indices of Women - Normal andDisease Group.
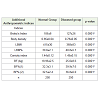
Table 10: Additional Anthropometric Indices of Women - Normal and DiseasedGroup.
The findings of the study indicated that the women in the Normalgroup were more physically active in terms of household work, office work despite the time spent in personal care being similar in boththe groups (Table 11). Time spent in recreation and sleep was highlysignificant being higher in the disease group. However, the time spentin actual physical activity was not much different between the twogroups. The energy expended in the daily work/activity reflecting thetime spent (minutes) pattern showed higher energy expenditure forthe normal group than the disease group (Table 12 and 13).
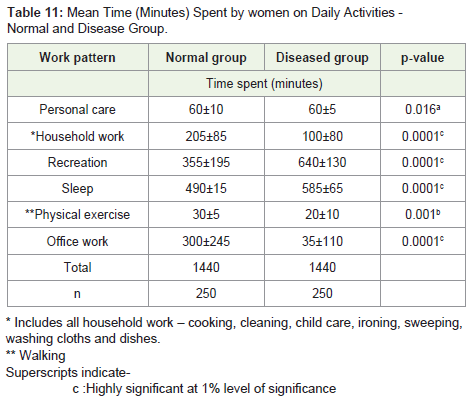
Table 11: Mean Time (Minutes) Spent by women on Daily Activities - Normal and Disease Group.
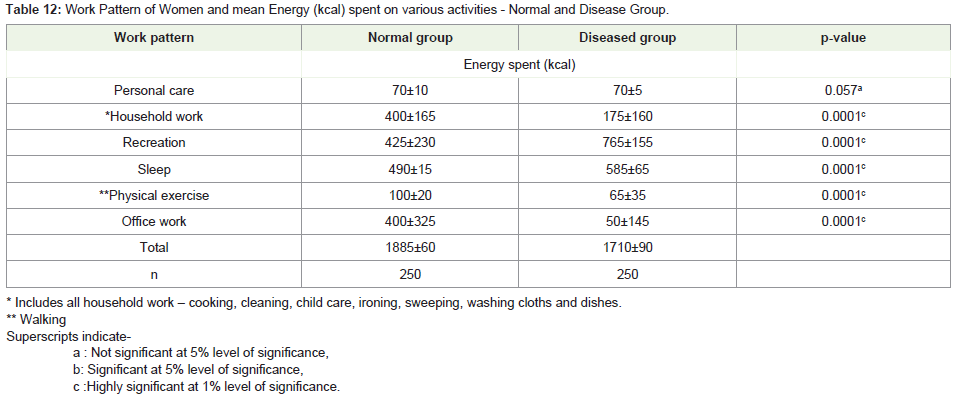
Table 12: Work Pattern of Women and mean Energy (kcal) spent on various activities - Normal and Disease Group.
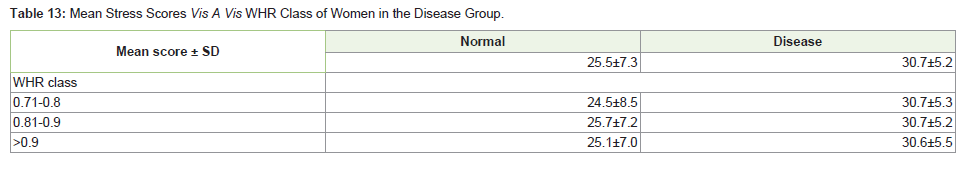
Table 13: Mean Stress Scores Vis A Vis WHR Class of Women in the Disease Group.
Multiple regression analysis and correlation co-efficient ofindependent variables and their influence on the dependent variableswas carried out. The independent variables considered were age,education, income, size of family, age at menarche, marriage and menopause, physical activity and stress. The dependent variableswere energy intake, energy expenditure, protein intake, fat intake,MUAC, BMI, WHR, TSF, body fat%, LBMI . In case of both normaland disease groups, a highly significant relationship was seen betweenage with energy intake and energy expenditure. As seen in Table 14,independent variables- age and education were found to be highly corelatedwith all the dependent variables indicating that each of thesefactors are independently influencing the determinants of nutrition.Age at menopause was found to be highly significant correlating withall the dependent variables except protein intake. Age at menopausewith WHR and education with MUAC was found to be significant at5% level. Both Age and age at menopause was found to be negativelyrelated to energy intake, energy expenditure, protein and fat intake,MUAC, WHR and LMBI. While, education was found to be positivelyrelated to all the dependent variables, age and age at menopause werepositively related BMI, TSF, and body fat percent.
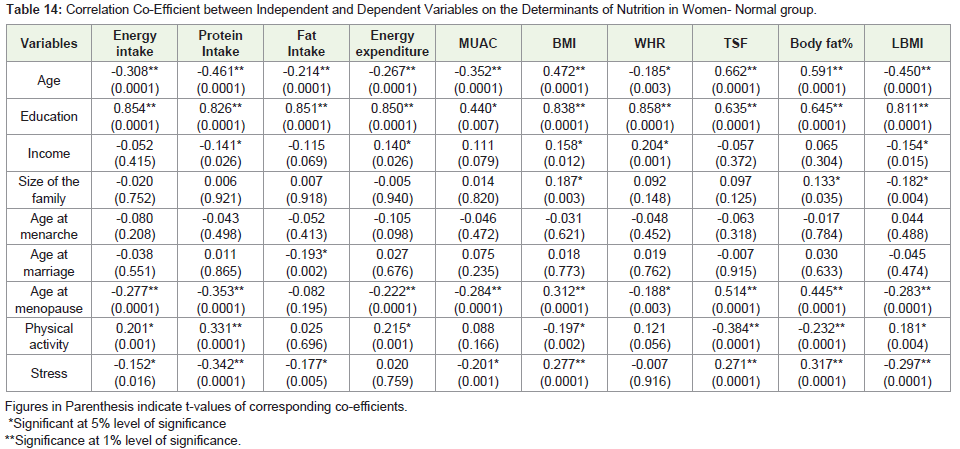
Table 14: Correlation Co-Efficient between Independent and Dependent Variables on the Determinants of Nutrition in Women- Normal group.
Size of the family was found to be significant with BMI, body fat percent and negatively with LBMI. Age at marriage was found to benegatively influencing the protein intake. Data indicated that the ageat menopause, education, physical activity, stress were found to beindependently acting as determinants of nutrition and their influencein either promoting increase in the fat stores or decrease in the LBMIwas likely to determine the risk levels of developing NCD in the studygroup.
Results of the analysis in case of women in the disease groupsindicated a similar trend, but the independent variable-age, education, ageat menopause, physical activity and stress attained significance with fewof the dependent variables (Table 15). Age was found to be significantlycorrelating with BMI, TSF and body fat percent and negatively withLBMI. However, age at menopause did not appear to be correlating withany of the dependent variables mentioned above. Education was foundto be significantly correlating with energy intake and MUAC and age atmarriage to be significant with energy expenditure, negatively with protein intake. Overall, among the independent variables, age appeared to bethe most important determinant followed by physical activity, stress, ageat menopause, education and age at marriage. Age and physical activity,with or without menopausal effect were found to be the most importantindependent factors determining the risk for the development of NCD inthe study group.
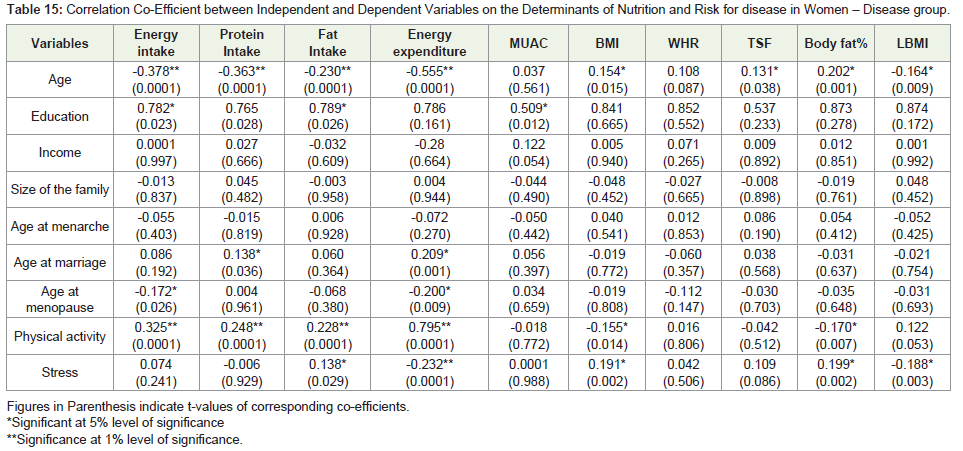
Table 15: Correlation Co-Efficient between Independent and Dependent Variables on the Determinants of Nutrition and Risk for disease in Women – Disease group.
Regression concepts between independent and dependent variablesof the women in the two groups- Normal and disease are presented inTable 16 and 17. Age was found to be a determinant of all the dependentvariables, negatively with energy intake, energy expenditure, proteinintake, fat intake, MUAC, WHR, LBMI and positively with BMI, TSF,body fat percent thus, indicating age as a most important determinant forthe increase in overall body size (> BMI) along with fat deposits (>TSF,>body fat %) while, with reducing the lean body mass and protein intake.Some of the socio-economic factors such as income, size of the family,age at marriage were also found to be influencing the factors leading to increase in BMI, WHR and reducing the LBMI and protein intake.
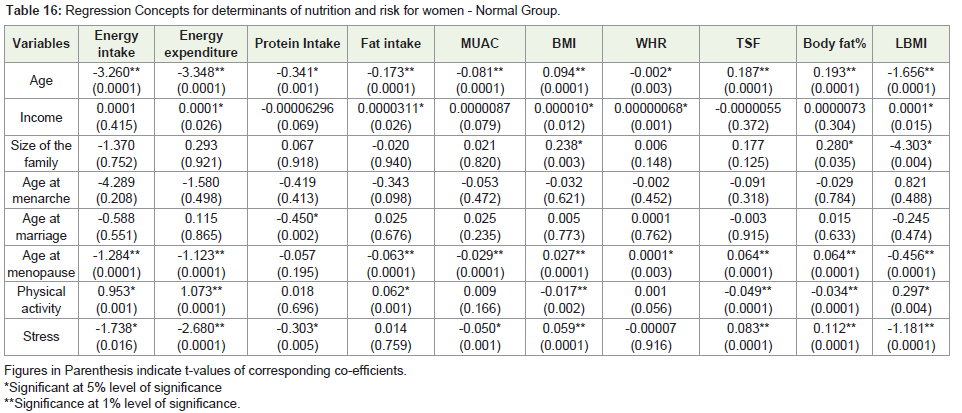
Table 16: Regression Concepts for determinants of nutrition and risk for women - Normal Group.
Regression concepts for women in the disease group showed thatage was the most significant variable determining the energy, proteinand fat intake, energy expenditure, LBMI-negatively, and BMI,TSF, body fat percent positively among which the first two variables were highly significant and others significant at 5% level (Table 17).Thus, age appeared to be the most important determinant followedby physical activity, stress and age at menopause as determinants ofnutrition and risk for developing disease for the women in the diseasegroup.
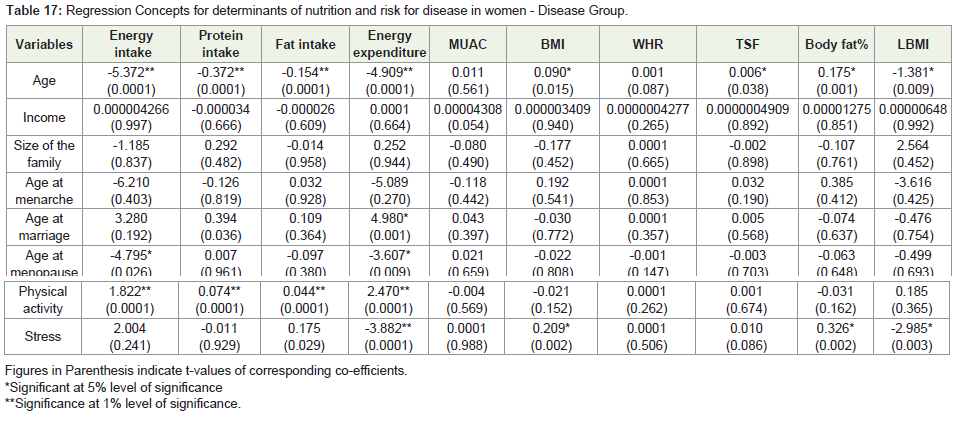
Table 17: Regression Concepts for determinants of nutrition and risk for disease in women - Disease Group.
Irrespective of their normal or disease status, the significantdeterminant of nutrition and risk for developing disease was the ‘age’of the women.
Thus, the results of the study are indicative of the fact thatdietary inadequacies, physical inactivity may lead to increase in fatmass over and above through the life span starting as early as in thechildhood through adolescence to adulthood. Age is associated withmodifications of body composition - increase in body fat mass and adecrease in protein mass [13]. The amounts of fat and fat free mass(FFM) in adults change with increasing age as a function of multiplevariables from physical activity to menopausal status to nutrition anddisease. The status of the fat and FFM compartments is associatedwith and serves as established risk factors for a range of chronic diseases affecting the persons in middle to old age and considerabledifferences do exist between men and women [14].
It has been evident from studies that the body compositionalters during growth as the age advances [15]. It has been notedthat changes in body weight generally reflect a change in the ratio ofwater, protein, fat and minerals. Studies have suggested that changesin body composition are dependent upon the total duration of theenergy deficit and excesses [15,16]. It has been well documented thatpositive energy balance implies a gain in energy stores in the formof carbohydrate, fat and protein [17]. It has been found that shortterm day to day energy balance is mostly accounted by rapid changesin carbohydrate load whereas, long term energy balance by the fatstores [17]. Body storage of protein in fat free mass and carbohydratestorage as glycogen in liver is limited and water component iscomparatively variable. Hence, weight gain has always been linkedto increased protein and fat intake during adolescence [17]. It hasbeen reported that girls having menarche at a younger age showeda marked trunk oriented fat pattern as compared with girls with anolder age at menarche [18,19].
The research evidence points to the changes in body compositionto be at the root of the problem for development of NCDs. Thenutrition and health issues concerning women are likely to becomplicated in the backdrop of low awareness / knowledge andpractice of nutrition concepts. Thus, as chronic disease epidemicsgather pace in India and threaten harm to individuals, families, andthe society at large, a comprehensive strategy for their prevention andcontrol is needed [20].
Summary and Conclusion
The findings of the study are indicative of the fact that primedeterminants are unhealthy dietary pattern, deficient intake ofprotein, and other micronutrient (iron, niacin, retinol, riboflavin)along with being physically inactive. These factors contributing tobody compositional changes towards increase fat is in turn mostlikely to position the women at risk of developing NCD - earlier or later depending on the emergence of one or the cluster of risk factorsbreaking the homeostatic balance in the expression of these diseases -arthritis, CVD, DM or combination of these with or without obesity.
The rapid growth of socio economic status in developingcountries suggests that the break out of NCDs as epidemic imminentparticularly affecting women from the pre menopausal stage itself.
The data from the present study suggest that a human orienteddevelopment towards improving the fetal growth, reducing overweight in later life and controlling the diet and environmental factorsthat stimulate body compositional changes is important for theprevention of NCD.
In conclusion, on a practical level, improving the nutrition and growth of a girl child, avoiding obesity in children and adults andcontrolling environmental factors including pollution levels need tobe given high priority.
Acknowledgement
The authors express sincere thanks to The University of Mysore for granting Post Graduate fellowship, Dr. S. Bhaskar, for granting permission to conduct the study in Vikram Hospital and clinic, and Mr. Lakshmi Narayan, for his help in analyzing the research data statistically.
References
- Posner BM, Franz M, Quatromoni P (1994) Nutrition and the Global risk for chronic diseases: the INTERHEALTH nutrition Initiative. Nutr Rev 52: 201-207.
- Preventing Chronic disease: a vital investment. Geneva, World health Organization, 2005.
- Non Communicable Diseases- Non-Communicable diseases now account for majority of deaths in Low-and middle income countries. Disease control Priorities project, July 2006.
- Diet, Nutrition and the prevention of chronic diseases. WHO technical report 916, Report of a Joint WHO/FAO Expert consultation. WHO, Geneva 2003.
- Shah Bela (2005) Risk factor surveillance for non-communicable diseases (NCDs): the multi-site ICMR-WHO collaborative initiative. Presentation made at Forum 9, Mumbai, India, September 12-16.
- Marquez PV, Suhrcke M (2005) Combating non-communicable diseases. Editorial BMJ 331: 174.
- Beaglehole R, Yach D (2003) Globalization and the prevention and control of Non-communicable disease: the neglected chronic diseases of adults. The Lancet 362: 903-908.
- Gopalan C, Sastry BV, Balasubramanian SC (1993) Nutritive value of Indian Foods. ICMR publications, NIN, Hyderabad.
- Indian Council of Medical Research. Report of an expert committee on recommended dietary allowances for Indians, New Delhi, 1987.
- Jelliffee DB (1966) The Assessment of Nutritional status of the community. Monogr Ser World Health Organ 53: 3-271.
- Macrae R, Robinson RK, Sadler MJ (1993) Encyclopaedia of Food Science, Food Technology and Nutrition 5.
- Joint WHO/UNO/FAO: Expert consultation on Energy and protein requirements, WHO Technical report. 1985, 724.
- Tessari P (2000) Changes in Protein, Carbohydrate, and Fat metabolism with Aging: Possible role of Insulin. Nutrition Reviews 58: 11-19.
- Guo SS, Zeller C, Chumlea WC, Siervogel RM (1999) Aging, body composition, and lifestyle: the Fels Longitudinal study. Am J Clin Nutr 70: 405-411.
- Henry C, Lukashi (1987) Methods for assessment of human body composition: traditional and new. Am J Clin Nutr 46: 537-556.
- IDAL Aquatra (2000) Nutrition for weight management. In: Krauses Food, /nutrition and Diet therapy. 10: 478-510.
- Schulz Y, Tarrow JS (1998) Energy and substrate balance and weight regulation. In: Nutritional science 137-148.
- Coker RH, Williams RH, Kortebrin PM, Sullivan DH, Evans WJ (2009) Influence of exercise intensity on abdominal fat and adiponectin in elderly adults. Metab Syndr Relat Disord 7: 363-368.
- Rolland Y, Lauwers-Cances V, Pahor M, Fillaux J, Grandjean H (2004) Muscle strength in obese elderly women: effect of recreational physical activity in a cross-sectional studyAm J clin Nutr 79: 552-557.
- Reddy KS, Shah B, Varghese C, Anbumani R (2005) In: Chronic diseases 3 - Responding to the threat of chronic diseases in India, Vol 366, Nov 12.