Research Article
A Study on Nutrient Intake and Energy Balance of Women- Home Makers, Gainfully Employed Non-Executives and Executives
Sowmya G Rao* and Shashikala Puttaraj
Department of Studies in Food Science and Nutrition, Manasagangotri, University of Mysore, Mysore 570 006, Karnataka,India.
Corresponding author: Dr. Sowmya G Rao, Department of Studies in Food Science and Nutrition, Manasagangotri,University of Mysore, Mysore 570 006, Karnataka, India; E-mail: raosowmya23@gmail.com
Citation: Rao SG, Puttaraj S. A Study on Nutrient Intake and Energy Balance of Women- Home Makers, Gainfully Employed Non-Executives and Executives. Indian J Nutri. 2015;2(1): 114.
Copyright © 2015 Rao SG, et al. This is an open access article distributed under the Creative Commons Attribution License, which permits unrestricted use, distribution, and reproduction in any medium, provided the original work is properly cited.
Indian Journal of Nutrition | ISSN: 2395-2326 | Volume: 2, Issue: 2
Submission: 05/11/2015; Accepted: 21/11/2015; Published: 27/11/2015
Abstract
The present study was conducted in Mysore city of Karnataka, on 250 Normal women in the age group of 20-60 yrs consisting of Home makers who were not employed (NE) as well as women gainfully employed. The gainfully employed group of women was subdivided into Non-executives (NEX) and Executives (EX) comprising of 75 subjects for each of the category. A preformed questionnaire was used to record personal data, anthropometric measurements, dietary intake and activity record of the selected women. Majority of women in the study belonged to nuclear type of family with a dietary pattern similar to that prevalent in Mysore city, Karnataka. The mean heights of women irrespective of age group were similar. Body weights gradually showed an increase over the age gradient with both the employed groups of women - NEX and EX gaining higher weight than the NE women. The dietaries of these women revealed an intake below the suggested amounts in DDP except for the sugar/ jaggery, fats and oils. The intake of pulses and vegetables was considerably low particularly in EX women. As the age advanced, the energy and protein intake was found to be reduced. The study concluded that nutritional status of the women continues to be unsatisfactory despite having a satisfactory socio economic status in an acceptable demographic frame as women showed low protein and high fat status with a sedentary life style and increasing WHR values over the age gradient.
Keywords: Women; Food intake; Nutrient intake; Somatic status; Activity pattern, Energy balance
Introduction
Over the last five decades, there has been considerable progress in social and economic development in India [1]. The unprecedented population growth has imposed enormous demands on all fronts particularly food production, distribution and food security in order to promote nutrition and health. Considering the enormous hurdlethat India has faced the progress that has been achieved in the field ofnutrition and health on the whole is commendable [2].
The Indian population is passing through a transition phasewhere subsistence conditions are being replaced by plentiful foodbut reduced physical work and therefore, an understanding of thechanging nutritional scene is critical [1].
Women play a central role in child care and food processing evenwhen their economic roles require extensive time and physical energy[3]. Poor health has repercussions not only for women but also theirfamilies [4].
Affluence, progressive aging of the population, upward socioeconomicconditions and changed lifestyles lead to an increase inNon-communicable diseases. It has been projected that while theinfectious diseases would decline from 56% in 1999 to 25% in 2020,non-communicable diseases would increase from 29% in 1990 toover 57% in 2020 [5].
Women work twice as much as men equally at home as well asthe work place [6]. However, it is been argued that while the women’s additional work is helpful to increase the household income, it maynot always lead to an improved diet due to change in priorities [7].Hence, the present study was undertaken to determine the nutrientintake and energy balance of women.
Materials and Methods
The study was conducted in Mysore city of Karnataka, India.Permission from Human Ethical Committee of University of Mysorewas obtained to conduct the study on human subjects. The randomsampling procedure was employed to select the subjects for thestudy based on their willingness to participate and being availablefor collecting data on study needs. 250 Normal women in the agegroup of 20-60 years with BMI above 19 and below 25 were randomlyselected from different areas of Mysore city. Women- both workingoutside (n=150) and confined to household work only (n=100) wereincluded. The gainfully employed group of women was subdividedinto Non-executives and Executives comprising of 75 subjects foreach of the category.
Non -executive comprised of women who were working in collegesand schools as lecturers and teachers, clerks and accountants in bankand other firms. Executives comprised of Professors, Principals, andengineers working for software companies. The criteria for selectingexecutives were their income level which was higher compared tonon-executives.
A preformed questionnaire was used to record personal data,anthropometric measurements, dietary intake, and activity record ofthe selected women.
The food intake of all the women was assessed by interviewing the women with the help of household measures relevant to Indian cuisinemodels to construct the individual women’s 24-hour food intake. Rawamounts for the cooked food items were derived by standardizing thepreparatory methods of different menu items. The total energy intakewas derived by the amount of macronutrients included in the diet [8].The energy intake of the women was compared against recommendeddietary intake for ensuring the appropriateness of intake derivedbased on the Recommended Dietary Allowances for age, gender andactivity [9].
Anthropometric measurements- Height (cm), Weight (kg), Armcircumference (cm), Waist (cm), Hip(cm), Triceps Skin Fold (mm),measurements using the standard procedure [10,11] were recordedfor all the 250 subjects.
Energy expended in different activities for two consecutive dayswas computed using the data on time use recalls of the subjects as perthe Food and Agriculture Organization/World Health Organizationestimates [12] of energy required per minute for specified class ofactivities.
The data was tabulated and subjected to appropriate statisticalanalysis.
Results
Demographic characteristics of the women - Employed Executives(EX) and Non- executives (NEX) and not gainfully employed outside (NE) are presented in Table 1 and the Socio economic characteristicsare given in Table 2. Majority of the study group (80% ) belongedto nuclear type of family. The age distribution was highly skewedwith more than 60% being adults in the age group of 20-60 years.The demographic features of the study group were found to be moreor less similar between the employed and not employed groups ofwomen.
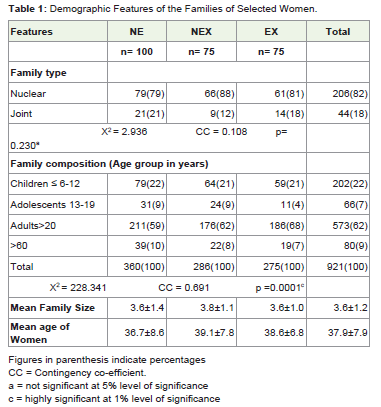
Table 1: Demographic Features of the Families of Selected Women.
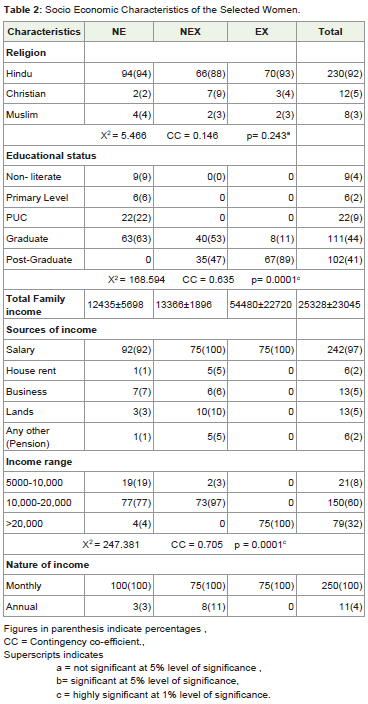
Table 2: Socio Economic Characteristics of the Selected Women.
An appraisal of marital status of women in the study grouprevealed that 95% were found to be married. Age at menarche,marriage and menopause was found to be in the acceptable rangegenerally indicated for women in India (Table 3). Most of the women(79%) reported having a regular menstrual cycle. The mean age at marriage was found to be higher for EX (25 y) than for NE or NX(21y). The mean number of pregnancies was significantly higherin NEX than NE or EX. However, mean number of children in thefamilies indicated a smaller family among these women. Mean age atmenopause was in the range of 44 to 46 y for these women.
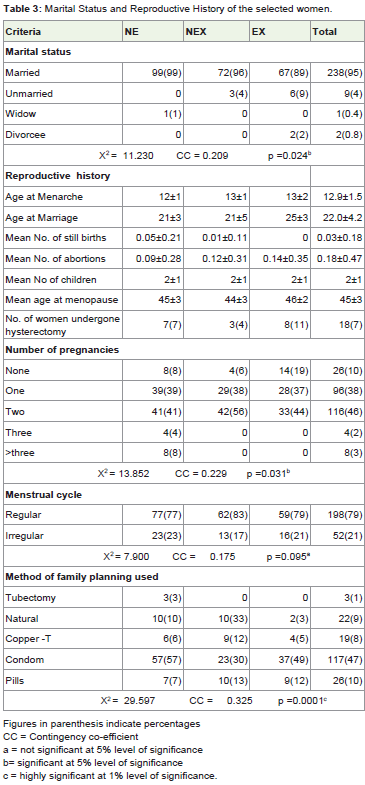
Table 3: Marital Status and Reproductive History of the selected women.
The Somatic status of women was assessed for all the 250 womenselected for the study and is presented in Table 4 and 5. The meanheights of women irrespective of age group were similar. Bodyweights gradually showed an increase over the age gradient withboth the employed groups of women - NEX and EX gaining higherweight than the NE women. While MUAC indicator of lean bodymass significantly decreased over the age range in case of EX women.The decrease was not significant in NE and EX women. Fat massas indicated by TSF showed a significant increase in all the threegroups of women over the age gradient. While hip measurementswere showing a similar pattern of increase as that of TSF over the agegradient, the waist measurements were not consistent either with the group or the age brackets.
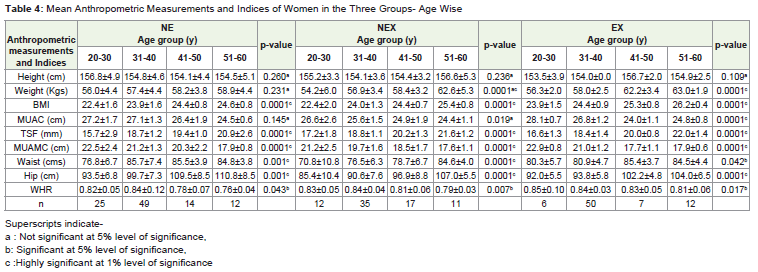
Table 4: Mean Anthropometric Measurements and Indices of Women in the Three Groups- Age Wise
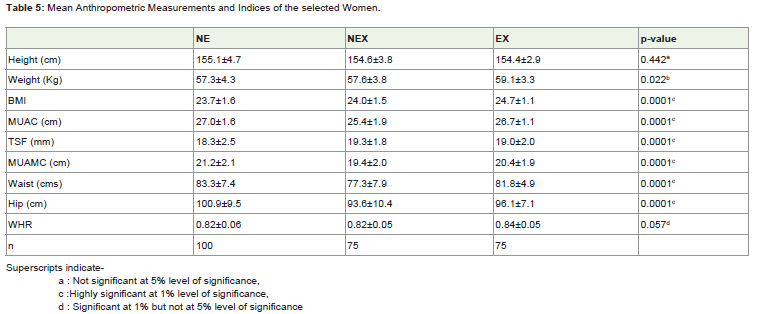
Table 5: Mean Anthropometric Measurements and Indices of the selected Women.
The anthropometric indices - Body mass index (BMI) showed agradual significant increase over the age range of 20-60 y whereas,WHR showed an increase up to 40 y and further decreased. However,in case of EX women WHR showed a gradual decrease over the agegradient. MUAMC, an indicator of protein status also showed asignificant decrease over the age gradient much higher compared toMUAC.
Between the groups while the heights of these women weresimilar, body weights were found to be higher in case of EX womenas compared to NE and NEX. On an average, the women in the threegroups were 155.4 to 155.1 cm tall and weighed 57.3 to 59.1 Kgs. BMI women followed by EX and NEX with significant difference betweenthe groups. However, WHR was similar in NE and NEX women; itwas significantly higher in EX women.
The data on the mean food intake of women- NE, NEX and EXare presented in Table 6 and 7. Cereals were the major items of foodincluded in the diet. The other major items were found to be milk andmilk products, other vegetables, roots and tubers and fleshy foods (incase of NE). The consumption of green leafy vegetables was found tobe low in all the three groups with nil intakes in case of EX women inthe age brackets of 31-40 y and 51-60y. However, differences existedin the intake of some foods over the age range of 20-60 y in eachof the groups. In case of NE the consumption of other vegetables,roots and tubers, milk and milk products, nuts, oilseed and coconutwas significantly different between the age brackets. In case of NEXamong all the foods the intake of only milk and milk products wassignificantly different over the age gradient. In case of EX seven out ofeleven foods – pulses, GLV, other vegetables, milk and milk products,sugar and jaggery, fruits, nuts and oilseeds were significantly differentfor women in the four age brackets. The intake of milk and milkproducts over the age range was significantly different for all thewomen irrespective of the groups- NE, NEX and EX. As compared to DDP except for milk and milk products, sugar and jaggery, fats andoils and intake of fruits in EX women 51-60 y, the intake of all otherfoods including cereals was low.
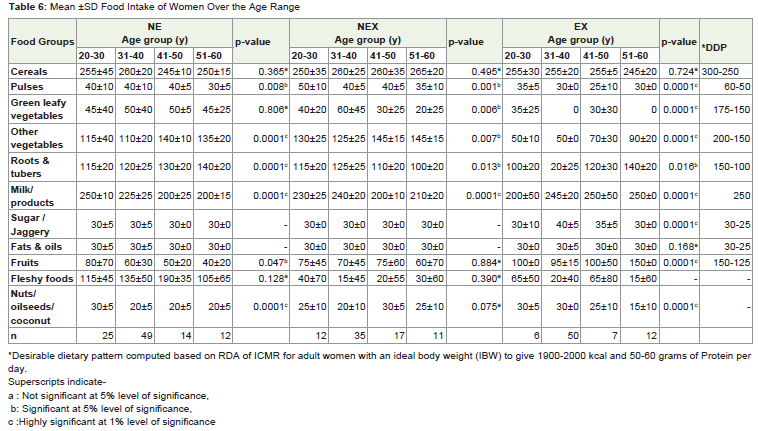
Table 6: Mean ±SD Food Intake of Women Over the Age Range
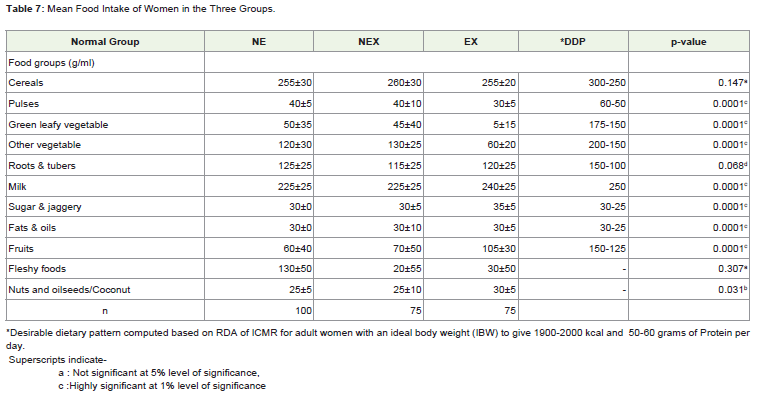
Table 7: Mean Food Intake of Women in the Three Groups.
Between the three groups of women except for the intake ofcereals all other foods were found to be significantly different overthe age range with differences in the amounts of foods consumed bythe women in each of the group. While the intake of pulses, GLV,roots and tubers were found to be higher in NE, the intake of ‘othervegetables’ was higher in NEX. EX women showed a higher intakeof milk and milk products, sugar and jaggery, fruits, nuts oilseedsand coconut. It was interesting to note that the intake of green leafyvegetables was almost negligible (5 ±15 g) and so also the othervegetables which was half of the amount that was being consumed bythe other two groups NE and NEX. The cereal pulse ratio was foundto be 6:1 in NE and NEX groups which are similar to the ratio asrecommended by the ICMR where as in case of EX women it was 8:1which is much below the recommendations.
Thus, the dietaries of these women revealed an intake below thesuggested amounts in DDP except for the sugar/ jaggery, fats and oils.The intake of pulses and vegetables was considerably low particularlyin EX women.
The intake of energy and macronutrients of women in the threegroups are presented in Table 8 and 9. Though, cereal intake wassatisfactory being ≥90% of the DDP it fell short of RDI. Over theage gradient- 20-60 y the energy intake showed a decrease whichwas not significant in all the three groups of women. Significantdifferences were seen in the protein intake over the age range in caseof EX followed by NE but not in NEX women except for the youngerwomen in the age bracket of 20-30 y of NE and EX all other womenirrespective of age brackets or groups showed a decreased proteinintake. In case of EX the differences seen in the intake of carbohydrateand fat was significantly different between the age brackets whereas, itwas not significant in NEX.
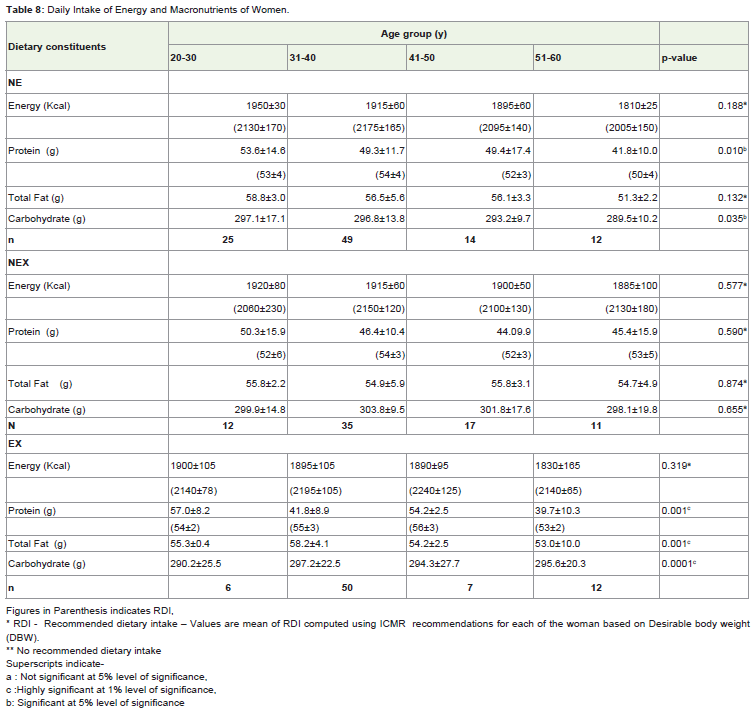
Table 8: Daily Intake of Energy and Macronutrients of Women.
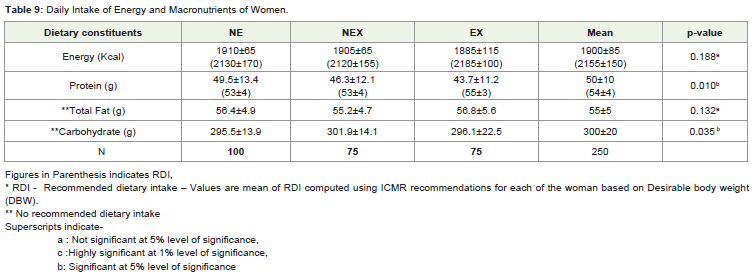
Table 9: Daily Intake of Energy and Macronutrients of Women.
NE women showed differences in the intakes of carbohydrate butthe intake of fat remained similar over the age gradient. As the ageadvanced, the energy and protein intake reduced. Overall, the energyand protein intake were much lower in the ≥30 age range irrespectiveof the group. Between the three groups- NE, NEX and EX the intakeof energy and protein was much lower in EX followed by NEXwomen. The intake of fat was found to be similar between the groupswith differences in the carbohydrate intake which was significant at5% level of significance. The distribution of woman’s intake of cereals,roots and tubers reflected the energy intake from macronutrients.The pattern of mean percent energy contributed from carbohydrateprotein and fat ranged from 62:10:28 in NE, 63:10:27 in NEX and63:9:28 in EX women. The protein from the animal source constitutedmore than one fourth of the total protein intake which is similar to therecommendation of ICMR. The diets were found to be high in polyunsaturated fatty acids due to the usage of sunflower oil. Since fewwomen were also using ground nut oil occasionally, some amount ofmonounsaturated fat is expected to be a component of total fat intake.
The micronutrient intake (Table 10 and 11) was found to be deficient in iron and Niacin. In addition, EX and NEX women inthe age brackets of 51-60y were also showing deficient intake ofretinol. Since, the intake of green leafy vegetable the main sourcesof iron was low it resulted in a deficient intake of iron. Over the agegradient significant differences in the intake was seen case of thiaminein NE women, iron, retinol riboflavin and vitamin C in case of EXwomen. None of the NEX women showed differences in the intake ofmicronutrient over the age gradient. Between the groups significantdifferences existed in the intake of all micronutrients with EX womenshowing greater deficiency in all the micronutrients. The mostdeficient micronutrients were iron, retinol, niacin in case of EX, ironand niacin in case of NE and NEX. However, the data indicated thatamong the micronutrients retinol was showing a wide variation in theSD implying that a few women might have had a normal intake of thisnutrient. The results indicated that cereals, roots and tubers, fruits,milk and milk products were the main sources of energy, protein,calcium and vitamin C. Milk and milk products was the main sourcesof protein, retinol and riboflavin. Though the diet promoted adequateintake of thiamine it fell short in niacin.
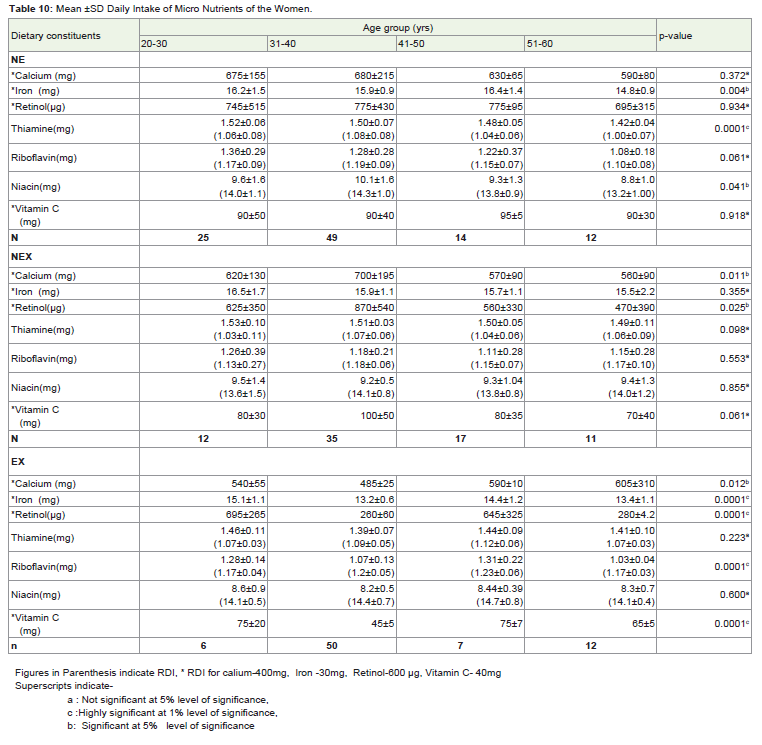
Table 10: Mean ±SD Daily Intake of Micro Nutrients of the Women.
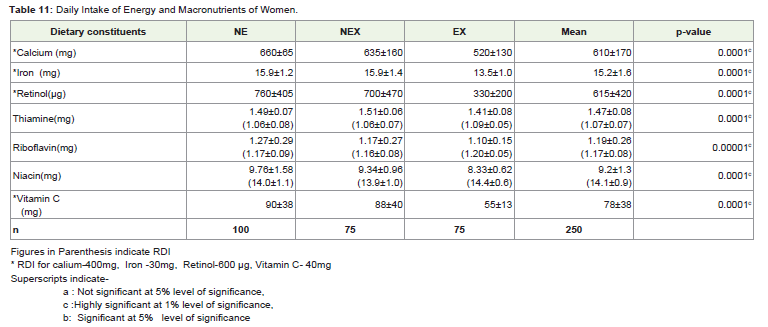
Table 11: Daily Intake of Energy and Macronutrients of Women.
Percent nutrient adequacy and nutrient quality index (INQ) ofthe diets consumed by the women in the study group are representedin Figure 1 and Figure 2. Nutrients as proportion of energy were morethan sufficient with respect to thiamine riboflavin and vitamin C butfell short in calcium, iron, retinol, niacin in all the women irrespectiveof their employment status and also in case of protein in case of EXwomen.
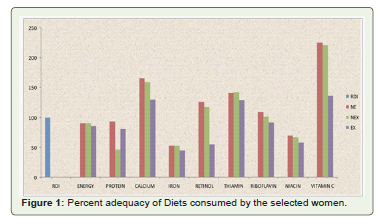
Figure 1: Percent adequacy of Diets consumed by the selected women.
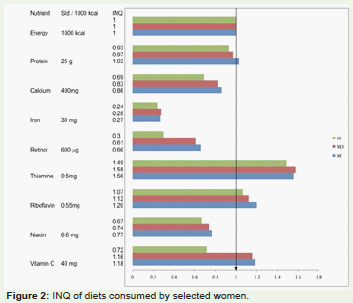
Figure 2: INQ of diets consumed by selected women.
Energy balance of the women in the study group is presentedin Table 12 and 13. Energy intake of these women regardless of thegroup showed a lower intake of energy when compared to RDI withan energy expenditure similar to that of the intake tending towards aslight excess ranging from 5 to 30 kcal in the four age brackets in eachof the group. Resting metabolic energy was found to be satisfactoryadequate to meet the internal functional demands. Between thegroups except for the resting metabolic energy which was found to bedifferent with EX showing a higher value followed by NEX and NE.Though energy intake was lower than the RDI, it matched the energyexpenditure. Thus all the women regardless of age brackets or groupsbased on the employment status were found to be in energy balance.
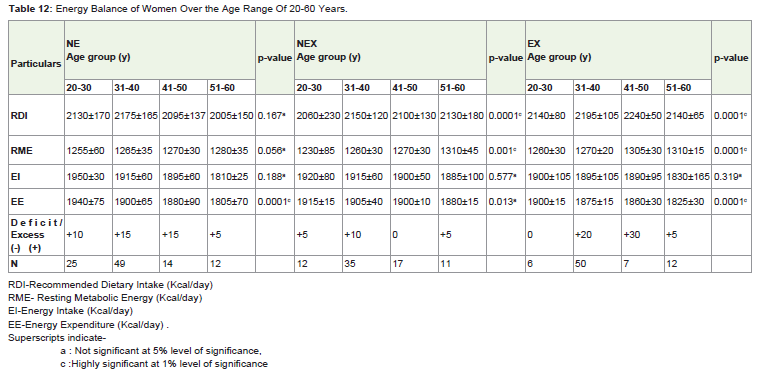
Table 12: Energy Balance of Women Over the Age Range Of 20-60 Years.
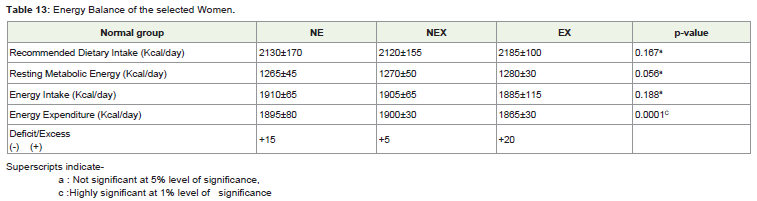
Table 13: Energy Balance of the selected Women.
Daily work pattern of women and the time spent on daily activitiesof each group of the women by their age brackets is presented inTable 14. The work pattern and the time spent by the women in thethree groups- NE, NEX and EX are shown in Table 15. Between thetwo working groups of employed women, NEX women were found to be spending more time on the household chores than the EX women.Thus, the time spent on household activities was comparativelyless than the work outside. Hence, between the groups as expectedNE women were spending more time on the household chores likedish washing, house cleaning, food preparation, child care etc. The actual time spent in household work by the NEX women was almostdouble that of the EX women. Over the age group the time spent inhousehold work gradually decreased still the older women (51-60 y)were also found to spend considerable time in the household work.
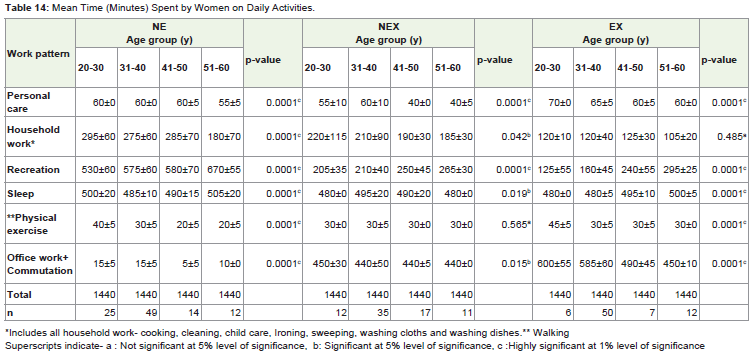
Table 14: Mean Time (Minutes) Spent by Women on Daily Activities.
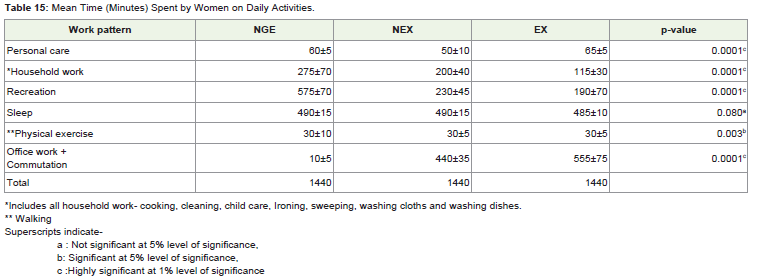
Table 15: Mean Time (Minutes) Spent by Women on Daily Activities.
The women in the age group of 51-60 y reported spending moretime in recreation. The total time spent in sleep by all the threegroups of women irrespective of age brackets was more or less similarranging from 480- 500 min (≥8 hrs). The time spent for personal careand physical activity was similar over the age brackets in all the threegroups - NE,NEX,EX except for NEX women in the age range of 41-50y, 51-60y, spending less time for the personal care.
Time spent in the physical exercise by the women in three groups over the age range of 20-60 y was found to be low rangingfrom 20-45 min, with younger women (20-30 y) spending more timein exercising. Daily work pattern of NEX and EX women indicatedthat more time was being spent at the work place rather than thehousehold. The time spent by the employed women in office workincluding commutation ranged from 440 min (7hrs) to 600 min (10hrs) highest time being spent by EX women in the younger age group20-30, 31-40 y. The working environment of most of the employedwomen could be termed as sedentary as it involved mostly ‘table’work. Moreover, most of the women irrespective of their employmentstatus reported having engaged the services of domestic helpers incarrying out the household works. Between the groups it was noted all the EX women utilised the help of domestic helpers to a maximumextent than the NEX or NE. Thus, the daily activity pattern was foundto be ‘sedentary’ in case of all the three groups of women.
Energy cost of different daily activities of women in the threegroups –NE, NEX, and EX are presented in Table 16 and 17. The totalenergy expended per day over the age brackets of 20-60 y ranged from 1805 kcal to 1940 kcal with the energy expanded showing a decreasein the older women (51-60 y). The total energy expended daily by thethree groups of women were found to be 1895 (NE), 1900 (NEX),1865 (EX) kcal/day. While the energy expended in household work,recreation were significantly higher in NE the energy expended inoffice work was significantly higher in EX (740 min) followed by NEX.
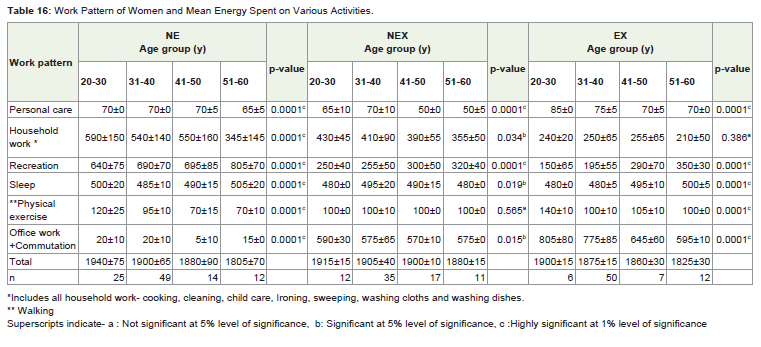
Table 16: Work Pattern of Women and Mean Energy Spent on Various Activities.
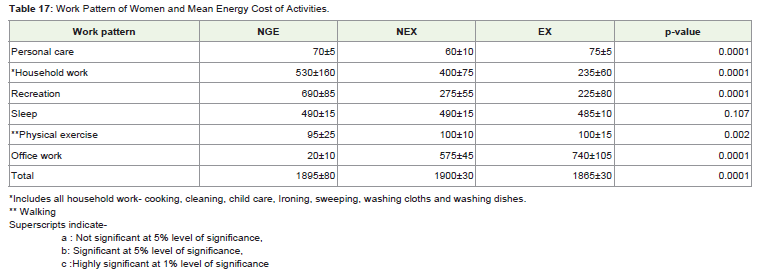
Table 17: Work Pattern of Women and Mean Energy Cost of Activities.
Though energy expended for personal work was found to be higherin EX than NEX it was more or less similar to the energy expended byNE for personal care. The energy expended in sleep was similar in all women irrespective of the age brackets or employment status.
Discussion
The results of the study are indicative of the fact that the nutritional status of the women continues to be unsatisfactory despite having asatisfactory socio economic status in an acceptable demographicframe. The family income was similar for all the women regardlessof their employment status. However, the women differed in theireducation levels with women EX having high level of education ascompared to NEX or NE. The educational levels of these women werebetter to the reported figures of women in India [13-15]. Researchevidence indicates a positive correlation between female literacy /education on health, nutrition and family size [16].
It has been shown that increasing educational levels result in betterpersonal hygiene, improved child rearing, small families, increasedincome, adaptation of better diets to cite a few [16-19]. Householdsize of the families of these women was small, age at menarche (13y),mean age at marriage (21-25 y), mean age of menopause (45y) wassimilar to the reported figures [17-21].
It is a fact that food diversity results when all the basic needs are satisfied [22]. The findings indicated a higher intake of milk and milkproducts as compared to other groups and preference for processedfoods, fast foods and eating out particularly in EX and NE women. Infact, the energy from fat component was high (28%). Food behaviouras these are generally associated with prosperity may lead to dietaryimbalances and at risk for developing NCD – hypertension, DM,CVD etc [12,23-26].
The characteristic dietary pattern of women was essential that ofhigh fat, moderate CHO and low protein with adequate energy levelsas indicated by energy balance. The actual food intake on daily basisshowed diversity with NE and NEX women showing similar pattern.Though, the intake of green leafy vegetables was low in all women,it was negligible in EX women. The better income and educationalstatus did not appear to translate to acceptable nutrient intakes asthe energy and protein was much lower in EX and NEX women. Infact, women NE were having a better intake due to consumption ofpulses, green leafy vegetables and other vegetables being higher in this group. The low intake of green leafy vegetable and pulses reflected inlow intake of iron and niacin in all women, which fell short of RDI.The low intake of iron reflected in most of the women having lowhaemoglobin levels, a most common nutritional problem in India[27]. The dietaries being high in fat - low in protein reflected in thebody size of these women.
Body size of adults notably indicates the overall nutritionand health status, also serve as pointers to the changes in SES anddemographic structure of the population [27]. Over the last century,clear cut increments in higher and weights of population groups havebeen noted in the developed and some of the developing countries[28]. However, in India, secular trends in heights are not seen amongthe low and middle income groups showing the effect of SES [29]. Theincreasing trend in body weights, MUAC, TSF, MUAMC and WHRagainst the age gradient is described as an age related phenomenonindependent of menopause effects [27,30]. This is attributed to acombination of reduced energy requirement, low intake of protein,reduced physical activity (sedentary lifestyle) and altered hormonalprofile both due to stress and related to menopause.
In the present study, though the secular trends in increments inheights were absent, the increments in weights showing an increasingtrend with advancing years indicated the effect of satisfactory incomelevels [31-33]. The women were showing high TSF and low MUAC,MUAMC values indicating a high fat and low protein status reflectingthe dietary intake patterns. Though, the BMI was within the range,WHR was higher particularly in EX women indicating increasedcentralized fat. Research evidence has shown a positive correlationbetween abdominal obesity and the risk of developing NCD [34]. Bothchildhood malnutrition and stress due to nutrient deficiencies andenvironment through the life span is reported to predispose excessdeposition of fat tissue, particularly leading to central obesity at theexpense of muscle mass [35]. The possible mechanisms are changesin the hypothalamic, autonomic nervous system and hormonalprofile during the period of malnutrition, with perturbation of thehypothalamic – pituitary axis [34,36], secondary to stress beingdeemed as an important factor. An increased waist circumferenceitself has been associated with elevated risk factors because of itsrelation with visceral fat accumulation and the mechanism mayinvolve excess exposure of the liver to fatty acid [37] though still beingdebated.
It has been demonstrated that increasing physical activity maydecrease the amount of intra-abdominal fat and further mitigate therisk of NCD both in pre and post menopausal women [30]. Womenin the present study were less active leading a sedentary lifestyle.Thus, relative physical inactivity with inappropriate diets high infat resulted in increase body fat as indicated by WHR and TSF. Itwas observed that only 27% of the study group women had attainedmenopause. The effects of menopause on body composition changestowards increase in fat and increase risk for NCD are well known [38].It is reported that decreased energy expenditure after menopause maydeteriorate the central body fat distribution further [30].
It is reported that an individual may remain normal despitehaving a BMI above the normal range as long as the vital parameters –blood pressure, blood glucose / lipid levels are within the homeostaticrange, as these processes are finely regulated and operate within therange of biological variability [1]. The individual is stated to be under physiological stress only when the body’s homeostatic limits are crossed.Thus, in a normal individual, shifting to a high fat diet and lower physicalactivity is liable to disturb the body’s homeostasis leading to a risk ofincrease body fat and related adult diseases subsequently [1].
Conclusion
From the results and the observations made in the study, itcould be stated that these women were still under homeostaticcontrol of vital processes as the biological risk factors - hypertension,dyslipidemia, IGT were still not apparent but still, these women couldbe at risk for developing NCD due to the fact that they had increasedfat attributable to unhealthy dietary patterns and physical activity.The findings from the study are important as they suggest that it isnecessary to initiate a program combining physical activity measureswith dietary modification- adequate protein, low fat and high fibre,increased green leafy vegetables and pulses for the retention of leanbody mass particularly at the entry of menopausal stage.
Acknowledgement
The authors express sincere thanks to The University of Mysore for granting Post Graduate fellowship, all the women who took part in the study and Mr. Lakshmi Narayan, for his help in analyzing the research data statistically.
References
- Rao S (2001) In: Nutritional Status of the Indian population J Biosci 26: 481-489.
- Gopalan C (1992) In: Nutrition in developmental transition in South-East Asia. Regional health paper, SEARO - WHO organization , New Delhi; No-21: 6-18.
- McGuire JS, Popkin BM (1988) The zero-sum game: a framework for examining women and nutrition. Food Nutr Bull 10: 27-32.
- Vekoff VA, Arjun A (1998) Women of the World- Women’s health in India-US Department of commerce economics and Statistics administration, Bureau of the Census.
- Rajagopalan MS (2000) Health and Nutritional profile in India. Health education in South-East Asia.15.
- Capoor I, Chetna (2000) Women and Nutrition- Victims or decision makers- Paper Presented at the Symposium on Nutrition and Development at Basel Switzerland Nov 30.
- Wandel M, Ottesen GH (1992) Maternal work, child feeding and nutrition in rural Tanzania. Food Nutr Bull 14: 49-54.
- Gopalan C, Sastry BV and Balasubramanian SC (1993) Nutritive value of Indian Foods. ICMR publications, NIN, Hyderabad.
- Indian Council of Medical Research (1987) Report of an expert committee on Recommended dietary allowances for Indians, New Delhi.
- Jelliffee DB (1966) The Assessment of Nutritional status of the community. WHO. Geneva.
- Encyclopaedia of Food Science (1993) Food Technology and Nutrition 5.
- WHO/UNO/FAO (1985): Expert consultation on Energy and protein requirements, WHO Technical report. 724.
- Nutrition in Industry (1946). International Labour organisation (montreal).
- India year book (1997) Publication division. Ministry of information and broad casting. Govt. of India.
- Office of Registrar general (1992, 1993, 1994), Office of the Registrar General and census commissioner (1987, 1992). Ministry of health and family welfare 1991, (1992).
- Daly JA, Davis JH, Robertson R, Correa H (1979) Determinants of health and nutritional status, Int: klein, Read, Riecken, Brown, pradilla, Daza, Evaluating the impact of nutrition and health problems, plenum press, New York. 7-37.
- Srinivasan K, Kanitkar T (1989) Demographic consequences of low status of women in Indian society in women and nutrition in India, Ed., Gopalan,C and Suminder Kaur, nutrition foundation of India, Special publication series 5: 17.
- Chatterjee M (1989) Socio-economic and socio cultural influences on women’s nutritional status and roles. In: Women and nutrition in India, Eds. Gopalan C, Kaur,s. Nutrition Foundation of India. Special publication series 5: 296.
- Gopalan C (1993) Women and nutrition in India - Some practical considerations, In: Problems and Polices, Ed., Gopalan C and Harvinder Kaur, Nutrition Foundation of India Special publication series 9: 47.
- Sundari TK (1990) Indian women: Having to run to stay in place? An overview of the status of Indian women. Proceedings of the Nutrition society of India 36: 27.
- Registrar general, India, New Delhi (1979) Survey on Levels, trends and differentials in fertility, Government of India, Ministry of health and family welfare, New Delhi.
- Meyer KA, Kushi LH, Jacobs DR, Slavin J, Sellers TA (2000) Carbohydrates, dietary fibre, and incident type 2 diabetes in older women. Am J Clin Nutr 71: 921-930.
- Khan ME, Tamang A K, Patel BX (1990) Work pattern of women and its impact on health and nutrition – some observations from the urban poor. J Fam Welf 36: 3-21.
- Chandra RK (1981) Immuno deficiency in under and overnutrition. Nutr Rev 39: 225-231.
- Dua A, veenu Seth (1988) Obesity- prevalence and association with food behaviour in married women (25-40y). Ind J Nutr Dietet 25: 338-344.
- Gupta S (1985) Studies on energy balance of Indian women. Doctoral dissertation, Ludhiana, india, Punjab Agrl. University.
- Srikantia SG (1989) Nutritional deficiency diseases. In; Women and nutrition in India, Eds. Gopalan C, and Kaur S. Nutrition foundation of India, special publication series 5: 224.
- Priyani soysa (1987) Women and nutrition in India in Energy nutrition of women, world review of nutrition and dietetics, Ed., Bourne, GH 52: 3.
- NNMB (1975-1979). Report on Diet and nutritional status of specific groups of urban population. NIN, Hyderabad, ICMR, 1984.
- Chang CJ, Wu CH, Yao WJ, Yang YC, Wu JS (2000) Relationships of age, menopause and central obesity on cardiovascular disease risk factors in Chinese women. Int J Obesity 24: 1699-1704.
- Alan Berg (1973) Nutrition factor, Published bookings institution: 1.
- Dhurandhar VN, Kulkarni PR (1992) prevalence of Obesity in Bombay. Int J Obes 16: 367-375.
- Campana AO, Burini RC, Anselmo MA (1987) Population surveys in Brazil. data on energy and protein intake and on anthropometric measurements of adult people. World Rev Nutr Dietet 52: 209-234.
- Dudeja V, Misra A, Pandey RM, Devina G, Kumar G, et al. (2001) BMI does not accurately predict overweight in Asian Indians in northern India. Br J Nutr 86: 105-112.
- Programming of chronic disease by impaired fetal nutrition: evidence and implications for policy and intervention strategies. Geneva, World Health Organization, 2002 (documents WHO/NHD/02.3 and WHO/NPH/02.1).
- Mensink RP, Katan MB (1990) Effect of dietary trans fatty acids on high-density and low-density lipoprotein cholesterol levels in healthy subjects. N Engl J Med 323: 439-445.
- Seidell JC, Pérusse L, Després JP, Bouchard C (2001) Waist and hip circumferences have independent and opposite effected on Cardiovascular disease risk factors: thr Quebec Family study. Am J Clin Nutr 74: 315-321.
- Heather C, Christine W (2008) Menopause, cholesterol and cardiovascular disease. Disease risk management, Europian Cardilogy, Touch briefings: 17-20.