Research Article
Association Between NOVA Food Processing Classification and Nutri-Score: A Cross-Sectional Analysis of 9,804 Global Food Products
Rahul RK1*, Aswathy M2 and Aswathy HV3
1Department of Acupuncture, Sree Ramakrishna Medical College of Naturopathy and Yogic Sciences, Kulasekharam, Tamil Nadu, India
2Department of Acupuncture, Sree Ramakrishna Medical College of Naturopathy and Yogic Sciences, Kulasekharam, Tamil Nadu, India
3Department of Nutrition and Herbology, Sree Ramakrishna Medical College of Naturopathy and Yogic Sciences, Kulasekharam, Tamil Nadu, India
2Department of Acupuncture, Sree Ramakrishna Medical College of Naturopathy and Yogic Sciences, Kulasekharam, Tamil Nadu, India
3Department of Nutrition and Herbology, Sree Ramakrishna Medical College of Naturopathy and Yogic Sciences, Kulasekharam, Tamil Nadu, India
*Corresponding author:Rahul RK, Department of Acupuncture, Sree Ramakrishna Medical College of Naturopathy and Yogic Sciences, Kulasekharam, Tamil Nadu, India. E-mail Id: terminousmac@gmail.com
Article Information:Submission: 14/05/2026; Accepted: 03/06/2026; Published: 10/06/2026
Copyright: © 2026 Rahul RK, et al. This is an open access article distributed under the Creative Commons Attribution License, which permits unrestricted use, distribution, and reproduction in any medium, provided the original work is properly cited.
Abstract
Background: Front-of-pack nutritional labelling systems and food-processing classification frameworks are increasingly used to guide public health nutrition policies and consumer food choices. Nutri-Score evaluates the nutritional profile of foods, while the NOVA classification categorizes foods according
to the extent and purpose of industrial processing. Although both systems are widely applied, the relationship between food processing and nutritional quality remains an important area of investigation.
Objective: To examine the association between NOVA food-processing classification and Nutri-Score grading among 9,804 global food products obtained from the Open Food Facts database, while also exploring discordance between nutrient-profile grading and food-processing classification across major food categories.
Methods: A cross-sectional analytical study was conducted using a dataset of 9,804 food products retrieved from the Open Food Facts database. Products were categorized according to NOVA food-processing groups (1-4) and Nutri-Score grades (A–E). Statistical analysis was performed using SPSS version 27.0. Descriptive statistics, cross-tabulation analysis, Pearson’s chi-square test, and Cramer’s V analysis were used to evaluate associations between food-processing level and nutritional quality.
Results: A statistically significant association was observed between NOVA classification and Nutri-Score grade (χ² = 2012.88, df = 12, p < 0.001). Minimally processed foods (NOVA 1) were predominantly associated with favourable Nutri-Score grades (A and B), whereas ultra-processed foods (NOVA 4) demonstrated a substantially higher proportion of unfavourable grades (D and E). Cramer’s V analysis indicated a moderate-to-strong association between processing intensity and nutritional quality. Important discordance was observed between nutrient-profile grading and food-processing classification, with several ultra-processed foods receiving favourable Nutri-Score ratings.
Conclusion: Higher levels of food processing were strongly associated with poorer Nutri-Score nutritional ratings. However, important discordance was identified between nutrient-profile grading and food-processing classification, suggesting that nutritional quality and industrial processing represent related but distinct dimensions of food evaluation. The findings support growing evidence that ultra-processed foods are more likely to possess unfavourable nutritional characteristics. Integrating nutrient-profile labelling with food-processing classification may improve consumer awareness and strengthen public health nutrition policies.
Keywords:NOVA classification; Nutri-Score; Ultra-processed foods; Food labelling; Nutritional epidemiology; Public health nutrition
Introduction
Background:
Over the past few decades, the prevalence of diet-related noncommunicable
diseases (NCDs) has significantly increased globally,
making them one of the main causes of death and disability. The
World Health Organization states that poor eating habits are a
major cause of metabolic syndrome, type 2 diabetes mellitus, obesity,
cardiovascular disease, hypertension, and several types of cancer.
In both developed and developing nations, the consumption of
highly processed commercial food products has increased due to
rapid industrialization of food systems, urbanization, aggressive
food marketing, and shifting consumer behaviour. (World health
organisation)Nutritional epidemiology has moved away from the conventional nutrient-centered approach and toward a more comprehensive understanding of food processing and quality in recent years. Individual nutrients including lipids, carbs, proteins, salt, sugar, and vitamins were the main emphasis of earlier nutritional models. However, new research indicates that the level of industrial food processing may have an independent impact on health outcomes [1,2]
The NOVA food-classification system, put forth by Monteiro and associates, is one of the most significant frameworks created to assess industrial food processing. Instead of focusing only on nutrient composition, the NOVA system classifies meals based on the type, degree, and intent of processing.[3] NOVA Group 1 includes unprocessed or minimally processed foods such as fruits, vegetables, grains, milk, eggs, and fresh meat. NOVA Group 2 consists of processed culinary ingredients including oils, butter, salt, and sugar. NOVA Group 3 includes processed foods manufactured through preservation or modification techniques such as canned vegetables, cheeses, and freshly baked breads. NOVA Group 4 represents ultra-processed foods (UPFs), which are industrial formulations containing additives, preservatives, flavour enhancers, emulsifiers, artificial sweeteners, and cosmetic ingredients designed to maximize palatability, convenience, and shelf life.
A growing body of research has connected the intake of ultraprocessed foods to negative health consequences. A NutriNet-Santé cohort study reported a positive association between ultra-processed food consumption and overall cancer risk [4]
Similarly, another study demonstrated that increased intake of ultra-processed foods was associated with elevated cardiovascular disease risk [5]
Another randomized controlled feeding trial has demonstrated that ultra-processed diets resulted in significantly greater caloric intake and weight gain compared with unprocessed diets despite matched macronutrients. [6]
Nutrient-profile labelling systems have become crucial instruments for raising consumer knowledge and encouraging better food choices, in addition to processing-based categories. One of the most popular front-of-pack nutritional labelling systems in Europe is Nutri-Score. Nutri-Score, which was first created in France, divides foods into five color-coded categories, with A denoting the best nutritious content and E the lowest
The scoring system incorporates both favourable nutritional components, such as protein, fiber, fruits, vegetables, nuts, and legumes, and unfavourable components including sodium, sugar, saturated fat, and energy density.[7] Research assessing Nutri-Score indicates that the system enhances consumers’ capacity to recognize healthier meals and may have a favourable impact on purchasing decisions [8]
However, there are still issues with nutrient-profile systems’ capacity to fully capture larger aspects of food quality, especially those related to industrial processing.
As a result, a significant scientific discussion over the connection between industrial processing and nutrient quality has arisen. Due to reformulation, fortification, artificial sweeteners, or altered nutrient composition, some highly processed items may nevertheless receive favourable Nutri-Score ratings even though ultra-processed foods frequently have poor nutritional profiles. This disparity raises the possibility that nutrient-profile algorithms may underestimate the possible health consequences connected to ultra-processing. Therefore, a significant topic of public health nutrition study is the link between NOVA classification and Nutri-Score. Future nutritional epidemiology studies, consumer education initiatives, food labelling regulations, and dietary guidelines may all benefit from an understanding of the similarities and differences between processing-based and nutrient-based systems.
Despite growing scientific interest, relatively limited studies have comprehensively evaluated the association between NOVA classification and Nutri-Score using large international food-product datasets. Therefore, the present study aimed to investigate the association between NOVA food-processing classification and Nutri- Score among 9,804 global food products obtained from the Open Food Facts database. The present study is novel in its evaluation of discordance between nutrient-profile grading and industrial food processing classification among a large international dataset of commercially available food products.
Research Objectives:
Primary ObjectiveTo evaluate the association between NOVA food-processing classification and Nutri-Score nutritional grading among global food products.
Secondary Objectives
1. To determine the distribution of Nutri-Score grades across NOVA food-processing categories.
2. To identify trends between increasing food-processing intensity and nutritional quality.
3. To assess whether ultra-processed foods are more likely to receive unfavourable Nutri-Score grades.
4. To evaluate discordance between NOVA food-processing classification and Nutri-Score grading among commercially available food products.
Research Hypothesis
Null Hypothesis (H0)
There is no significant association between NOVA food processing classification and Nutri-Score grading.
Alternative Hypothesis (H1)
There is a significant association between NOVA food-processing classification and Nutri-Score grading.
Null Hypothesis (H0)
There is no significant association between NOVA food processing classification and Nutri-Score grading.
Alternative Hypothesis (H1)
There is a significant association between NOVA food-processing classification and Nutri-Score grading.
Materials and Methods
Study Design
A cross-sectional analytical study was conducted using publicly available food-product data obtained from the Open Food Facts database.
Data Source
The dataset was obtained from Open Food Facts, an open-access international food-product database containing nutritional and ingredient information from commercially available food products marketed globally.
The database includes:
• Nutritional composition
• Ingredient lists
• Energy values
• Sugar content
• Sodium and salt levels
• Food-processing classification
• Nutri-Score information
• Country-specific product data
The dataset used for the present study contained 9,804 food products with complete NOVA classification and Nutri-Score grading.
Inclusion Criteria
• Products were included if they contained:
• Valid NOVA classification
• Valid Nutri-Score grade
• Complete nutritional information
• Product processing information
Exclusion Criteria
Products were excluded if they contained:
• Missing Nutri-Score grades
• Missing NOVA classifications
• Incomplete nutritional data
• Duplicate entries
Study Variables:
Independent Variable• NOVA food-processing classification:
• NOVA 1: Unprocessed or minimally processed foods
• NOVA 2: Processed culinary ingredients
• NOVA 3: Processed foods
• NOVA 4: Ultra-processed foods
Dependent Variable
Nutri-Score grading:
• Grade A
• Grade B
• Grade C
• Grade D
• Grade E
Statistical Analysis:
Data cleaning, coding, and statistical analysis were performed
using IBM SPSS Statistics version 27.0
Categorical variables including NOVA classification and Nutri-
Score grades were summarized using frequencies and percentages.
Cross-tabulation analysis was performed to evaluate the distribution
of Nutri-Score grades across NOVA food-processing categories.
The association between NOVA classification and Nutri-Score
grading was assessed using Pearson’s chi-square test of independence.
Expected cell frequencies were examined to ensure compliance with
chi-square assumptions.
Cramer’s V test was additionally calculated to evaluate the
strength of association between food-processing level and nutritional
quality.
A p-value less than 0.05 was considered statistically significant.Ethical Considerations:
The present study utilized publicly available anonymized food product
data from the Open Food Facts database and therefore did not
require formal institutional ethical approval. No human participants
or personal identifying information were involved in the study.Results
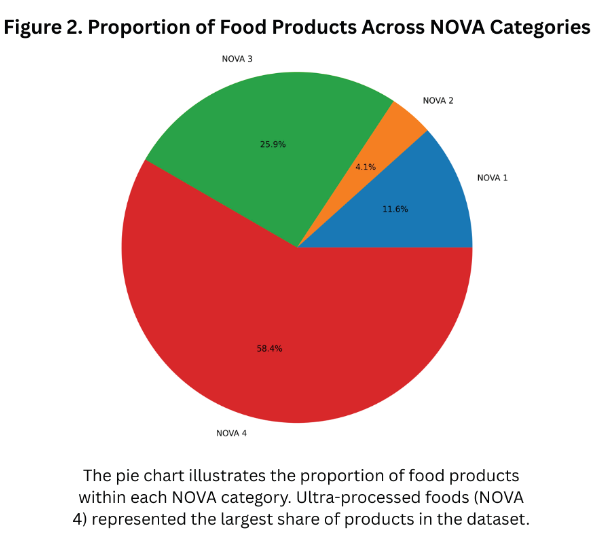
Product Distribution:
A total of 9,804 food products meeting the inclusion criteria were
analysed in the present study. Products represented multiple food
categories and countries, providing a broad overview of commercially
available global food products.Among the included products, ultra-processed foods (NOVA 4) represented the largest proportion of the dataset, whereas minimally processed foods (NOVA 1) accounted for a comparatively smaller proportion. Distribution across Nutri-Score categories demonstrated substantial variability according to processing intensity.
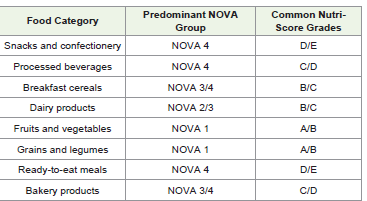
Categorization of food products demonstrated substantial variation in processing intensity and nutritional quality across different food groups. Snack foods, processed beverages, confectionery products, and ready-to-eat meals were predominantly classified as ultra-processed foods and commonly demonstrated unfavourable Nutri-Score grades. In contrast, minimally processed food categories such as fruits, vegetables, grains, and legumes were more frequently associated with favourable nutritional ratings
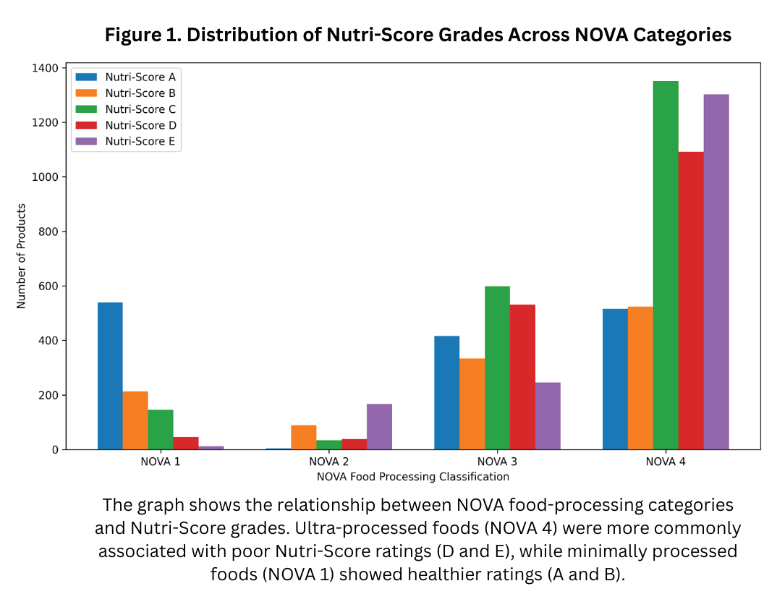
Distribution of Nutri-Score Grades Across NOVA Categories:
Cross-tabulation analysis demonstrated distinct differences
in Nutri-Score grading patterns across NOVA food-processing
categories.The findings demonstrated a progressive decline in nutritional quality with increasing levels of industrial processing.
NOVA 1 Foods:
Foods classified as NOVA 1 were predominantly associated with
favourable nutritional profiles. The majority of minimally processed
foods received Nutri-Score grades A and B, while only a small
proportion were categorized under grades D or E.NOVA 2 Foods:
Processed culinary ingredients demonstrated mixed nutritional
characteristics. Although some products received intermediate Nutri-
Score ratings, a substantial proportion fell within lower nutritional
categories, particularly grade E.NOVA 3 Foods:
Processed foods demonstrated broad variation across nutritional
categories, indicating heterogeneity within this processing group.NOVA 4 Foods:
Ultra-processed foods demonstrated the strongest association
with unfavourable nutritional quality. NOVA 4 products accounted
for the highest number of products categorized under Nutri-Score
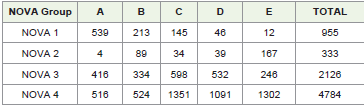
grades D and E.Pearson Chi-Square Analysis:
Pearson’s chi-square test demonstrated a statistically significant
association between NOVA classification and Nutri-Score grading:χ2=2012.88, df=12, p<0.001
The null hypothesis was therefore rejected, indicating that food processing level and nutritional quality were significantly associated.
The null hypothesis was therefore rejected, indicating that food processing level and nutritional quality were significantly associated.
Cramer’s V Analysis
Cramer’s V analysis demonstrated a moderate-to-strong association between food-processing intensity and nutritional quality:
Cramer’s V analysis demonstrated a moderate-to-strong association between food-processing intensity and nutritional quality:
Cramer’s V=0.45:
This finding indicates that increasing industrial processing was
meaningfully associated with poorer Nutri-Score ratings.Discordance Between NOVA Classification and Nutri- Score:
Although a significant overall association was observed between
NOVA classification and Nutri-Score grading, several discordant
patterns were identified within the dataset. A subset of ultraprocessed
foods (NOVA 4) received favourable Nutri-Score grades of
A and B despite extensive industrial processing. Conversely, certain
minimally processed foods demonstrated poorer Nutri-Score ratings
due to naturally high fat, sodium, or energy content.These findings suggest that nutrient-profile systems and processing-based classification systems represent overlapping but non-equivalent dimensions of food quality. While Nutri-Score primarily evaluates nutrient composition, the NOVA system evaluates the extent and purpose of industrial processing.
Discussion
The present study investigated the association between NOVA
food-processing classification and Nutri-Score grading among
9,804 global food products. The findings demonstrated a statistically
significant relationship between level of industrial food processing
and nutritional quality. Earlier narrative evidence from our research
group highlighted the potential role of micronutrient deficiencies
in depression and anxiety, further supporting the importance of
evaluating overall dietary quality and nutritional adequacy in modern
food environments [9]
While minimally processed foods were more frequently linked to
improved nutritional profiles, ultra-processed foods were significantly
more likely to obtain negative Nutri-Score scores. These results
corroborate the mounting evidence that industrial food processing
lowers nutritional quality and has negative health effects.
The findings are in line with earlier studies showing that high
sodium, added sugars, saturated fats, refined starches, additives, and
energy density are common characteristics of ultra-processed meals
[2] These goods are frequently designed to promote marketability,
palatability, convenience, and shelf stability—all of which can lead to
unhealthy eating habits and excessive calorie consumption.
The findings also align with a randomized controlled trial, which
demonstrated that ultra-processed diets resulted in significantly
greater caloric intake and body-weight gain compared with minimally
processed diets despite similar macronutrient composition [6] This
suggests that the adverse effects of ultra-processing may extend
beyond nutrient composition alone.
The current study’s key finding is that food processing level and
nutritional quality are closely connected but distinct categories.
Despite significant industrial formulation, certain ultra-processed
foods nonetheless received reasonably favourable Nutri-Score
evaluations. This draws attention to a significant drawback of using
nutrient-based labelling systems on their own.
Ultra-processed meals may have biological impacts that go
beyond traditional nutritional composition, according to prior
study. Changes in satiety signalling, eating speed variations, hyperpalatability,
disturbance of the gut microbiome, inflammation, and
exposure to food additives and toxins associated with packaging are
some of the suggested reasons [10,11]
Public health nutrition policy is significantly impacted by the disparity between processing-based categories and nutrient-profile systems. Due to favourable nutrient reformulation, consumers who solely rely on front-of-pack nutrient labels may mistakenly believe that certain ultra-processed items are healthy. Thus, a more thorough evaluation of food quality could be obtained by combining processing-based categories like NOVA with nutrient-profile methods like Nutri-Score.
One of the important findings of the present study was the identification of discordance between nutrient-profile grading and food-processing classification. Several ultra-processed food products achieved favourable Nutri-Score ratings despite extensive industrial processing. This observation suggests that nutrient-based labelling systems alone may not fully capture the broader implications associated with ultra-processing [12]
Previous evidence suggests that ultra-processed foods may influence health through mechanisms extending beyond conventional nutrient composition, including altered satiety signalling and hyperpalatability [13]
These findings have important implications for food-labelling policies, as consumers may incorrectly perceive certain reformulated ultra-processed foods as healthy based solely on favourable front of pack nutritional ratings.
The global nature of the dataset strengthens the relevance of the findings. The inclusion of food products from multiple countries and food categories reflects real-world food environments and enhances external validity.
Public Health Implications:
The findings of the present study support growing concerns
regarding the health implications of ultra-processed foods within
modern dietary environments. Integrating both nutrient-profile
systems and processing-based classifications may improve consumer
awareness and facilitate more informed dietary choices.
Future food-labelling strategies may benefit from combining
nutritional quality assessment with evaluation of industrial food processing
intensity.Consumer Awareness:
Integrating food-processing information alongside nutrient profile
labels may improve consumers’ understanding of food quality
and encourage healthier dietary choices.Nutritional Policy:
Public health agencies may benefit from incorporating both
nutrient-based and processing-based frameworks into dietary
guidelines and nutritional surveillance systems.Food Industry Reformulation:
The study highlights the growing need for the food industry to
reduce excessive industrial processing and improve overall food
quality rather than focusing solely on nutrient reformulation.Prevention of Non-Communicable Diseases
Reducing ultra-processed food consumption may contribute to prevention strategies targeting obesity, cardiovascular disease, diabetes mellitus, and metabolic disorders.
Strengths of the Study:
The present study possesses several important strengths:1. Large international food-product dataset.
2. Inclusion of both nutrient-profile and processing-based classifications.
3. Use of objective statistical analysis.
4. Real-world representation of commercially available food products.
5. Evaluation of the relationship between industrial processing and nutritional quality.
Limitations:
Several limitations should be acknowledged in the present study.
First, the Open Food Facts database is a community-driven database
and may contain incomplete, inconsistent, or variably updated
product information. Second, the cross-sectional design of the study
limits causal interpretation regarding food processing and nutritional
quality.Third, the analysis was conducted at the product level rather than the individual dietary intake level; therefore, actual consumption patterns and clinical health outcomes could not be evaluated. Fourth, food-product representation may differ across countries and food categories, potentially affecting generalizability.
Despite these limitations, the study utilized a large international dataset and provides important evidence regarding the relationship between food-processing intensity and nutritional quality.
Recommendations:
• Public health agencies should consider integrating NOVA
food-processing classification alongside nutrient-profile
labelling systems such as Nutri-Score.• Consumers should be educated regarding the potential health implications of ultra-processed foods beyond conventional nutrient composition.
• Policymakers should strengthen regulations concerning marketing and labelling of ultra-processed food products. • Future studies should evaluate longitudinal dietary intake and clinical outcomes associated with combined exposure to ultra-processed foods and poor nutritional profiles.
• Internationally standardized food databases should be developed to improve nutritional epidemiology research and food surveillance.
Conclusion
This cross-sectional analysis of 9,804 global food products
demonstrated a strong and statistically significant association between
NOVA food-processing classification and Nutri-Score grading.
Higher levels of industrial food processing were associated with
progressively poorer nutritional profiles. Ultra-processed foods were
substantially more likely to receive unfavourable Nutri-Score grades,
supporting growing concerns regarding the nutritional quality and
health implications of heavily processed commercial food products.
The findings also suggest that nutrient-profile systems alone
may not fully capture the broader implications of food processing.
Therefore, integrating processing-based classifications with nutrientprofile
labelling may provide a more comprehensive framework
for consumer education, nutritional policy, and public health
intervention strategies.
However, important discordance was identified between nutrientprofile grading and food-processing classification, suggesting that nutritional quality and industrial processing represent related but distinct dimensions of food evaluation.
Future research should investigate longitudinal health outcomes associated with ultra-processed food consumption and evaluate the effectiveness of combined labelling strategies in improving dietary behaviour and reducing non-communicable disease risk.
Acknowledgments
The author acknowledges Open Food Facts for providing openaccess
food-product data used in this study
References
Citation
Rahul RK, Aswathy M, Aswathy HV. Association Between NOVA Food Processing Classification and Nutri-Score: A Cross-Sectional Analysis of 9,804 Global Food Products. Indian J Nutri. 2026;13(1): 345.