Research Article
Food Variety Scores Reflect Diet Quality Better Than Dietary Diversity Scores – A Study on School Children in Mumbai City
G Bhide1, A Thorat2, A Goyal3* and SA Udipi4
1Graduate Student, SNDT Women’s University, Mumbai, India
2Visiting Faculty, SNDT Women’s University, Mumbai, India
3Research Fellow, Medical Research Centre – Kasturba Healthy Society, Mumbai, India
4Research Director and Head, Medical Research Centre – Kasturba Healthy Society, Mumbai, India
2Visiting Faculty, SNDT Women’s University, Mumbai, India
3Research Fellow, Medical Research Centre – Kasturba Healthy Society, Mumbai, India
4Research Director and Head, Medical Research Centre – Kasturba Healthy Society, Mumbai, India
*Corresponding author: Goyal A, Research Fellow, Medical Research Centre – Kasturba Healthy Society, Mumbai, India. E-mail Id: goyal.aditi157@gmail.com
Article Information: Submission: 15/04/2023; Accepted: 10/05/2023; Published: 17/05/2023
Copyright: © 2023 Bhide G, et al. This is an open-access article distributed under the Creative Commons Attribution License, which permits unrestricted use, distribution, and reproduction in any medium, provided the original work is properly cited.
Abstract
The present study examined the association between dietary diversity (DD), body mass index (BMI), and per cent body fat (PBF) in, 10-11-year-old school children (n=201) from two schools located in a central urban area of Mumbai, India. DD was assessed with FFQ using the FANTA food categories.
20% of the children were underweight, and 13% of the study sample was overweight/obese. Majority of the children were in the normal range of BMI and PBF categories. DD scores were quite high, with the mean DDS being 12.4 ± 0.7 out of a maximum possible score of 13. Mean DDS did not differ between BMI and PBF categories. DD was also assessed by calculating the total dietary score (TDS), its percentage, and food group diversity scores. Processed food items contributed to almost 25% of TDS whereas vitamin A-rich fruits and vegetables contributed very little. Consumption of food group ‘fried foods and snacks’ was significantly higher among the girls, suggesting they may favour such foods more. The study indicated good DDS, but the TDS indicated some food groups were overemphasized. It is necessary to empower the younger generation about the importance of healthy diet patterns and lifestyle, well-being, and good
health in the long term.
Keywords: School Age Children; Dietary Diversity; BMI; Percent Body Fat; Food Variety
Abbreviations
CNNS – Comprehensive National Nutritional Survey; BMI –
Body Mass Index; PBF – Per cent Body Fat; FFQ – Food Frequency
Questionnaire; BIA – Bioelectrical Impedance Analysis; IAP – Indian
Association of Paediatrics; DDS – Dietary Diversity Scores; FGS
– Food Group Diversity Score; TDS – Total Diversity Scores; SD –
Standard Deviation
Introduction
School age is a critical period covering almost two decades of life.
Food and nutrient intakes during this period form the foundation for
health and influence overall health status in the short and long term,
during adulthood and old age.
The Comprehensive National Nutritional Survey (CNNS) (2016-
2018) in India [1] reported that in the 5- 9 year-old age group, 22%
children were stunted, and 35% were underweight. The percentageof
children with low body mass index (BMI) was 15% at 5 years of age,
20% at 7 years of age, and the highest prevalence of 26% at 10 years
of age. The increasing prevalence of overweight and obesity is a cause
of concern in terms of public health along with undernutrition in
India. Lobstein and Jackson-Leach (2016) [2] estimated that by 2025,
India is likely to have 17.3 million overweight/ obese children, second
among all countries in the world.
Growth in young children has been found to be influenced by
dietary diversity [3,4]. Dietary diversity implies that a variety of
foods from different food groups are consumed thereby ensuring the intake of various essential nutrients that support health, growth and maintenance [5]. In young Indian and Cambodian children, those
with less stunting and better height-for- age were fed more diverse
diets [6,7]. A comparison of primary school children in Iran and
Mumbai showed that higher total food group scores were associated
with better height status, while severely and moderately stunted as
well wasted children had lower food group scores. Higher BMI was
associated with higher scores for cereal foods, fruits and vegetables, as
well as beverages, sweets and fats [8,9].
In India, the rising prevalence of overweight and obesity has been
attributed party to the easy access and availability of relatively cheap
and affordable energy-rich, nutrient-poor foods. Joseph et al (2015)
[10] observed that among 300 boys (Mean Age = 13.5 ± 0.9 years),
97.3% of children consumed fast foods and 14.4% consumed these
foods daily. More recently, Jain and Mathur (2020) [11], reported
from a study of 1030 adolescents, from low and middle- income
backgrounds, that ultra-processed foods contributed to 16.2% of their
total energy intakes. Also, children from middle-income families
consumed more such foods regularly than those from low-income
families.
While there are reports in the literature on consumption patterns
of school children, particularly fast foods, chips, chocolates, etc., not
many studies have been conducted on the dietary diversity of schoolaged
Indian children and their BMI as well as per cent body fat (PBF).
The present study examined dietary diversity and its association with
BMI and PBF among school children from Mumbai City, India.
However, the dietary diversity scoring pattern that has been widely
used [3] gives the same weight age to all food groups regardless of
whether they are more or less healthy. Also, this scoring pattern does
not reflect the diversity of foods within a specific food group and its
contribution to the total diversity scores. Therefore, in the present
study, we calculated food variety scores using a scoring system that
reflected the per cent contribution of different food groups consumed.
Research Design and Methodology
Sample Selection: The study sample consisted of 201 children
aged 10-11 years, who were in the Vth grade in two schools located
in Central Mumbai. These schools were selected based on their
willingness to allow the investigators to conduct the study. All the
children in the Vth grade of these two schools were included in the
study, after obtaining informed parental written consent and assent
from the children.
Ethics Approval: The study was approved by the Inter Systems Biomedica Ethics Committee, Mumbai. Data Collection: Weight, height, and dietary data was collected using a Food Frequency Questionnaire (FFQ). The age and gender of students were taken from the school records.
Anthropometry
The InBody-120 body composition analyzer was used to measure
weight, BMI, and PBF using bioelectrical impedance analysis (BIA).
Height was measured using a measuring tape fixed to a wall without
any skirting. The tape was calibrated against a stadiometer (least count
0.1cm). Children were asked to remove their shoes and stand straight with heels, buttocks and shoulders touching the wall and the tape, ensuring that the feet are parallel and placed together, arms naturally
hanging at the sides. They were instructed to look straight, such that
the line of sight is parallel with the floor. A headboard was used, the
hair was compressed and two measurements were taken.
BMI was calculated and the per cent categories for each child were
determined based on standards for Indian children recommended
by the Indian Association of Paediatrics (IAP) [12]. The percentile
categories were: underweight (<3rd percentile), normal weight (3rd –
85th percentile), overweight (85th – 95th percentile) and obese (>95th
percentile). PBF was categorized into percentiles as given by Khadilkar
et al., (2013) [13] and approved by the IAP. The percentile categories
were: low fat (<3rd percentile), normal fat (3rd – 85th percentile), high
fat (85th – 95th percentile) and very high fat (>95th percentile).
Dietary Diversity
A food frequency questionnaire (FFQ) consisting of 327
food items was used to assess dietary diversity. The frequency of
consumption was recorded as daily, thrice a week, twice a week, once
a week, once in fifteen days and occasionally/ seasonally or never.
1) Dietary Diversity Scores (DDS): The scoring was based on the
FANTA scoring system (2016) [14]. In the FANTA scoring system,
each food item consumed from 10 food groups mentioned is given a
score of 1, and those not consumed are given a score of 0. The food
groups considered in the FANTA system are (i) grains, white root,
tubers, and plantains;
(ii) pulses (beans, peas, lentils); (iii) nuts and seeds; (iv) dairy; (v)
meat, poultry, fish; (vi) eggs; (vii) dark green leafy vegetables; (viii)
other vitamin A-rich fruits and vegetables;
(ix) other vegetables and (x) other fruits. For this study, the
FANTA system was modified slightly to capture the typical diet
patterns of children in this city.
Cereals and white roots and tubers were treated as separate groups.
Also, sweets and savoury and fried snacks were added because they
are popular among large segments of the population in Mumbai city.
Thus, foods were categorized into thirteen food groups: (i) Cereals,
(ii) Pulses, (iii) White roots and tubers, (iv) Nuts and seeds, (v) Dairy
and milk products (vi) Meat, poultry and fish, (vii) Eggs, (viii) Dark
green leafy vegetables, (ix) Other vitamin A-rich vegetables and fruits,
(x) Other vegetables and fruits, (xi) Oils and fats, (xii) Sweets, (xiii)
Fried foods and snacks. DDS was calculated as follows: each group
was assigned a score of 1 if it had been consumed and if not, the score
assigned was 0. The total maximum possible score was 13.
1) Food Group Diversity Score (FGS) and Total Diversity Score
(TDS): These were calculated to assess the contribution of individual
food groups and to calculate the total score to reflect dietary diversity.
Therefore, in the present study a scoring system was developed for
assessing diversity within each food group and to reflect the extent to
which different food groups contribute to the diversity scores. Hence
the TDS scoring method was developed to calculate the contribution
of each food group and to identify whether the children’s diets were
healthy or not.
TDS was calculated by dividing all the food items that had been
consumed at least once in the preceding week by the total number
of items (327) listed in the FFQ. This was expressed as a percentage.
Each food item that was consumed was given a score of 1 and if it was
not eaten, the score was 0.
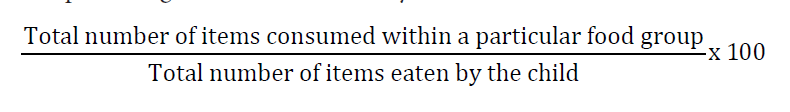
The FGS was calculated by adding the number of items within
each food group consumed and dividing this by the total number of
items eaten by the child. Scores were calculated for each food group
as a percentage of the total diversity score as follows:
Data analysis:
Three hundred and forty students were recruited. However,
anthropometric body composition measurements could be taken
for 324 students, since 16 students were absent on the days of the
measurement. One hundred and thirty-nine students did not return
the FFQ used to access dietary diversity. Thus, complete data were
available for 201 students. Analysis was done using SPSS Version 25.
Tests applied were ANOVA, t-test and Pearson’s chi-square test.Results
Among the 201 children, 105 (52.2%) were girls and 96 (47.8%)
were boys. Mean values for anthropometric measurements did not
show significant gender differences. The mean height of all children
was 139.9 ± 6.9 cm, with not much difference between boys (140.3
± 6.9 cm) and girls (139.5 ± 6.9 cm). Similarly, the mean weights of
girls (32.8 ± 7.7 kg) did not differ from that of boys (32.9 ± 8.9 kg),
the overall mean weight being 32.8 ± 8.3 kg. The mean BMI for all
children was 16.6 ± 3.3 kg/m2, and the mean BMI for girls was 16.8
± 3.3 kg/m2 compared to 16.5 ± 3.3 for boys kg/m2. PBF was higher
for females (25.06 ± 9.49) than that for males (21.95 ± 9.95), with the
overall mean for the entire sample being 23.57 ± 9.81.
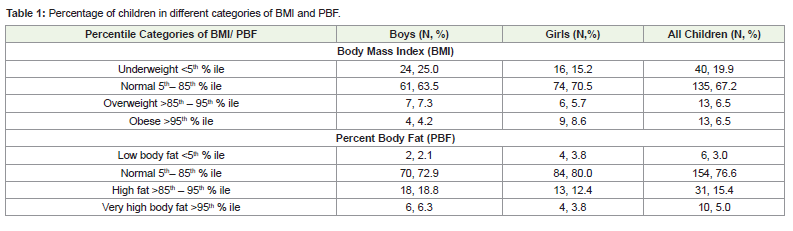
A slightly higher percentage of male children were underweight
(< 5th percentile of BMI) as compared to females, whereas a slightly
higher percentage of the females had normal BMI [Table 1]. However,
these gender differences were not statistically significant (χ2 = 4.458, p
= 0.216). At least three-fourths of both males and females had normal
PBF, although a slightly but not significantly higher percentage
of boys (25.1%) had high body fat as compared to girls (16.2%) (χ2
=2.748, p=0.432). A higher percentage of both girls and boys had high body fat as compared to the percentage who were found to be
overweight or obese, based on their BMI (Table 1).
Dietary Diversity Scores (DDS):
DDS was quite high, with the overall mean score for all children
being 12.4 ± 0.7 out of a maximum score of 13. Mean DDS for males
(12.4 ± 0.7) and females (12.4 ± 0.8) did not differ significantly (t =
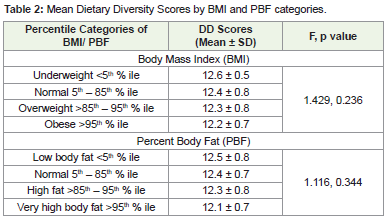
0.542, p = 0.716).DDS vis-à-vis BMI and PBF:
DDS was not significantly associated with the different categories
of BMI and PBF. DDS of children with low BMI was very similar to
those who had normal BMI or who were in the overweight or obese
BMI categories. Similar trends were observed for PBF as children who
had low PBF had similar DDS to those who had normal PBF or PBF
above the 85th percentile [Table 2].Total Food Diversity Scores (TDS) and Food Group Diversity
Score (FGS).
The overall mean total FGS for all children was 158.9 ± 51.5, with
no significant difference between male (152.9 ± 46.7) and female
children (164.4 ± 55.2) (t = 1.582, p = 0.115). Total FGS did not
differ significantly between the different BMI categories (F = 0.637,
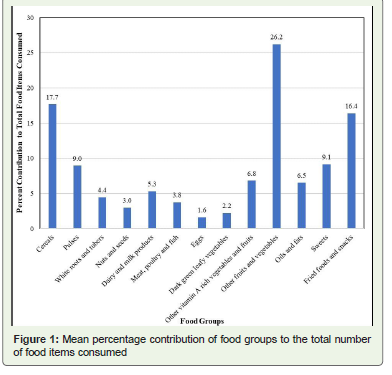
p = 0.592) or the PBF categories (F = 0.036, p = 0.991). Per cent
contribution of each food group to total diversity scores was calculated
[Figure 1]. Per cent contribution was highest from other fruits and
vegetables (26.2%) followed by cereals (17.7%) and fried foods and
snacks (16.4%). In contrast, pulses contributed only 9.0% to the TDS.
Non-vegetarian protein sources, i.e., meat, poultry and fish, milk
and dairy products, and eggs individually did not contribute much
but together contributed 10.7% to the TDS [Figure 1]. All protein
sources together including nuts and seeds contributed 22.7% of the
TDS. Dark green leafy vegetables and other vitamin A-rich fruits and
vegetables contributed only 2.2% and 6.8% of the TDS respectively. In
contrast, energy-dense foods like sweets, fats and oils and fried foods
and snacks together contributed 32.0% of the TDS.
When FGS was compared by gender, female children had slightly
scores than male children. However, this difference was found
significant for only fried foods and snacks (Females = 16.9 ± 3.4,
Males = 15.8 ± 3.6) (t = 0.467, p = 0.019).
Further, FGS were compared among the different BMI and PBF
categories. Analysis of variance indicated that mean percent scores
for all food groups differed significantly between the BMI categories
only for the cereal and cereal products group, with normal weight
(18.0%) and overweight children (18.1%) having significantly
higher scores compared to underweight children (16.7%) (F = 4.68,
p = 0.003). Also, underweight children had slightly higher per cent
scores (9.6%) for the pulses group compared to children with normal
BMI (8.8%), overweight (8.6%) and obese children (8.7%) but these
differences were not statistically significant (F = 1.51, p = 0.213).
Those with higher PBF did not have a significantly different FGS
compared to those with low or normal PBF.
Discussion
Poor dietary diversity has been linked with the poor nutritional
status of children in low- and middle-income countries. Inappropriate
dietary intake during adolescence has serious and adverse implications
in terms of compromising physical growth and intellectual capacity
as well as delayed sexual maturation. In the present study, therefore,
we assessed dietary diversity based on the FANTA scoring system
FANTA scoring system [14]. The mean score based on 13 food groups
was found to be quite high (12.4 ± 0.7) out of a maximum score of 13, suggesting that the dietary diversity for these children was quite high. Also, no child had a DDS of less than 50%. In comparison to the
present study, Nithya et al., (2017) [15] reported that adolescents 12-
17 years old from rural areas of Wardha (Maharashtra) and Korapur
(Odisha) districts, had lower scores.
Among the studies that have been reported on dietary diversity,
those based on food groups are more than those based on food items
[16]. These authors observed that most of the indices on dietary
diversity reflected dietary diversity to a limited extent. In the present
study, the high scores suggested that dietary diversity was good.
However, when we considered both food items within food groups
as well as food groups per se, we found that almost half of the total
scores were contributed by energy-dense foods and cereals. Whereas,
Vitamin A-rich vegetables and fruits and dark green leafy vegetables
along with milk and dairy products contributed only 13.7-15.2% of
the TDS.
There are limited studies on Indian children of school age/
adolescents and the diversity of their diets. Nithya and co-workers
(2017) [15] reported that dietary diversity indices for adolescents
from two rural locations in India were correlated with the nutrient
adequacy ratio and nutritional status of the participants. Majority of
the adolescent boys and girls had low dietary diversity. Their report
indicated that a lack of food diversity is of concern in countries
like India. However, in the present study, diet diversity scores did
not differ by nutritional status category based on the BMI of the
participants.
Hooshmand and Udipi (2013) [9] compared the dietary diversity
and nutritional status of urban primary school children from Iran
and India. The Indian children had better dietary diversity than
the Iranian children and taller children tended to have higher
diversity scores. Higher scores for almost all individual food groups
were associated with higher body weight. In Iran, mean scores for
vegetables, beverages, sweets and fats were higher for children with
higher body weight. Children with higher z-scores for height for age
also had higher mean scores for pulses, dairy products, beverages and
fats, in both countries. Whereas those with higher BMI had higher
scores for cereals, fruits, vegetables, dairy products, mixed dishes,
beverages, sweets and fats.
The FANTA scoring system [14] does not provide an opportunity
to discern which food groups are underemphasized or consumed
in larger amounts. Therefore, we developed a total food diversity
total score and food group diversity score using data from a food
frequency questionnaire. In contrast to the overall high scores with
the FANTA system, the food group diversity scores indicated that the
children tended to consume fewer pulses, milk and dairy products.
Also, the per cent scores for vitamin A-rich vegetables and fruits were
relatively low whereas high-fat, high-sugar and/or fried foods and
snacks contributed almost one-third of the total food diversity score.
These findings indicate that urban children tend to consume diets
that overemphasize energy- dense foods. In a cross-sectional study
conducted on 1800 children aged 9-18 years in four Indian cities,
Gulati et al., (2013) [17] observed that the dietary patterns such as
snacking and fast food consumption of the children were significantly associated with the mothers’ dietary patterns. In cities, processed
foods like biscuits, ready-to-eat foods including wafers/chips, and
many Indian snacks that are high in carbohydrates, contain salt,
and are deep-fried fried, highly palatable, and easily available and
accessible at relatively affordable costs. Rathi, Riddell and Worsley
(2017) [18] who studied 1026 students aged 14–16 years and were
attending private, English-speaking schools in Kolkata, India,
reported that 70% had consumed three or more servings of energydense
snacks the day before the survey. They also reported that the
adolescent’s consumption of vegetables, pulses and legumes, animal
foods was less, which is similar to our observations. In a study on
secondary school students conducted almost a decade earlier in New
Delhi, Singh and co-workers (date) made similar observations about
the frequent consumption of fast foods [19].
Sashindran and Dudeja (2020) [20] pointed out that rapid
urbanization has also fostered eating out and consumption of fast
foods. In urban homes, it is not surprising that women spend less
time in food preparation and they may offer convenience foods
that are most often energy dense. Further, these authors noted that
Indian children in senior secondary schools become more sedentary
and tend to include more energy-dense, high-fat, sugar and saltcontaining
foods. Such foods may be habit-forming and children
could get addicted to their flavours and tastes. Reliance on such foods
would increase the risk of weight gain, fat gain and poor metabolic
health [21].
In our study, we assessed dietary diversity using the FANTA
system and developed a method of scoring that helped us assess the
contribution of different food groups to the total diversity score. Our
method appears to have an advantage over that of the FANTA system
because it takes into account the total number of items consumed
and the items within each food group, rather than only assigning a
score of one to each food group. Our method helped to identify the
under consumption of specific groups and those that are emphasized
more. Thus, this method has better potential to identify the intake of
those foods that compromise the nutrient quality of diets in terms of
fiber and important micronutrients [22]. One major limitation is that
it cannot be used for rapid assessment in its present form, although
with further refinement, it may be possible.
The scoring pattern developed in the present study showed that
there was higher inclusion of ultra-processed foods and other fast
foods in the children’s diets. It can help identify deficiencies in dietary
practices that can be focused upon for counselling and nutrition
education. The results point out the need for parents in particular to
be educated about the long- term adverse effects of purchasing highenergy,
high-fat/sugar and high-salt foods.
It would be worthwhile to validate the tool with a larger sample
and across socio-economic groups, from urban and rural populations.
This will help in the assessment of the impact of nutrition transition
as well as the impact of nutrition education on dietary patterns.
Acknowledgements
The authors thank the children’s parents and teachers for their
support. Profound appreciation is extended to all the school children
who participated in the study, S.N.D.T. Women’s University, Mumbai, India, and also, InBody Pvt. Ltd. for providing the InBody-120 machine.