Research Article
Normal Reference Range of T1 and T2 Myocardial Mapping in Healthy Indian Population Relative to Age and Gender
Tanushree BS*, Chandresh OK and Shrinivas BD
Department of Radio Diagnosis, Jaslok Hospital and Research Centre, Mumbai India
*Corresponding author: Tanushree BS, Department of Radio Diagnosis, Jaslok Hospital and Research Centre, Mumbai, India. E-mail Id: tanbangyan1995@gmail.com
Copyright: © 2023 Tanushree BS, et al. This is an open-access article distributed under the Creative Commons Attribution License, which permits unrestricted use, distribution, and reproduction in any medium, provided the original work is properly cited.
Article Information: Submission: 22/08/2023; Accepted: 16/11/2023; Published: 23/11/2023
Abstract
Context: Data on T1 and T2 mapping reference range on 3T MRI scanners in healthy Indian population is scarce.
To find the reference range of T1 and T2 myocardial mapping in healthy Indian population relative to age and gender and to find specific reference range for cardiac base, mid and apex.
Settings and Designs: Prospective observational study.
Methods and Materials: 50 subjects were chosen after exclusion of cardiovascular morbidities and history of COVID-19 infection and underwent myocardial T1 and T2 mapping at 3T Philips Ingenia scanner.
Statistical Analysis Used: SPSS v23 (IBM Corp.) was used for data analysis
Results and Conclusions: Mean myocardial T1 and T2 mapping values at 3T scanner were 1269.96 ± 37.90 and 47.21 ± 1.47 ms respectively. There was no correlation or association found between T1 and T2 mapping values with age. Mean T1 mapping values were higher in females (1287.62 ± 46.55ms). No statistically significant difference was found in T2 mapping values between the genders. The meanT1 values in base, mid and apical segments were 1255.08 ± 39.90, 1260.91 ± 47.97 and 1293.88 ± 49.95 ms respectively. The mean T2 values in base, mid and apical segments were 46.05 ± 2.81, 46.04 ± 2.24 and 49.98 ± 2.53 ms respectively. The mean T1 and T2 values in apical segment were higher as compared to mid and base.
Keywords: T1 Mapping; T2 Mapping; Age; Gender; Segments
Introduction
Myocardial mapping is a parametric method allowing
visualization and quantification of focal or diffuse diseases of the
myocardium. The water molecules and other molecules present in
the tissues determine the T1 and T2 values of these tissues. Alteration
in the tissue composition due to pathological processes can lead to
changes in T1 and T2 values as compared to normal myocardium
[1]. T1 values can help in the identification of fibrosis, amyloid
deposition, lipid accumulation and iron overload etc [2]. T2 mapping
values help in detection of edema in infarction, myocarditis and other
inflammatory pathologies and intramyocardial hemorrhage
[3,4]
T1 value is a tissue specific time constant and can be used to
distinguish different tissues. T1 values are known to increase
with increase in the magnetic field strength [5]. T1 values are also
dependent on physiological parameters and myocardial T1 mapping
values varied according to age and gender of patients according to
some studies [6].T2 relaxation time or spin –spin relaxation is also
tissue specific time constant. Increase in myocardial water content
due to edema is considered to be the main cause of increase in T2
relaxation time [7]
To the best of our knowledge, there is limited literature on normal
reference range of T1 and T2 mapping values in Indian population
using 3T scanner. This makes the determination of pathological
process a challenging task without contrast administration. The
aim of this study is to evaluate and categorize the reference range of
myocardial mapping in healthy Indian populations well as to find the
reference range for each cardiac segment dividing it into base, mid
and apex .
Methods
The study protocol conforms to the Declaration of Helsinki
and written informed consent was taken from all patients and was
approved by the Institutional Ethics Committee.
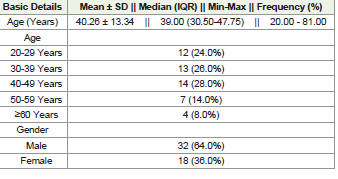
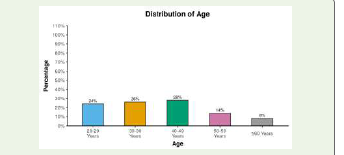
50 healthy asymptomatic volunteers from age 20 to 81 were included in the study.
50 healthy asymptomatic volunteers from age 20 to 81 were included in the study.
Exclusion criteria were::
1) Evidence of cardiovascular disease found during physical
examination and history taking2) Claustrophobia
3) Patients having non-MRI compatible aneurysm clips, cochlear implants and other MR non compatible metallic prosthesis
4) Pregnancy
5) Past history of COVID-19 infection.
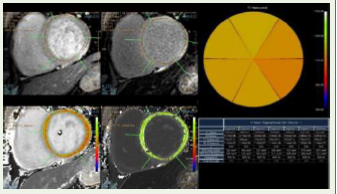
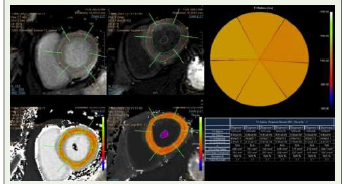
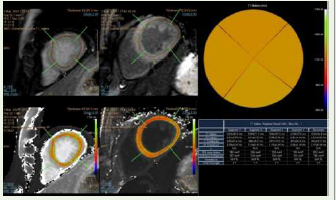
Cardiac MRI was performed using 3T Philips Ingenia scanner.
For T1 value determination basal,mid and apical short axis Modified
Look Locker (MOLLI) images were acquired with breath-hold in
expiration and auto segmentation was done according to cardiac
segmentation model proposed by American Heart Association(AHA).
T2 mapping was performed using mGRASE sequence in basal, mid
and apical short axis slices just like T1 mapping. Imaging parameters
are described in [Table 1]. Data was analyzed using IntelliSpace
Portal (ISP) software available on the Philips workstation and values
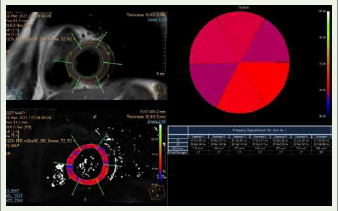
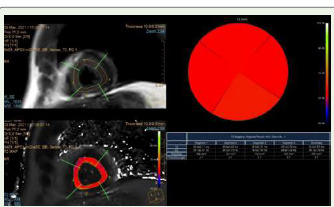
were generated with T1 and T2 R2 maps. Representative images of
Native T1 mapping in base [Figure 1],mid [Figure 2], apex[Figure 3]
and T2 mapping in base[Figure 4], mid [Figure 5] and apex [Figure 6]sections are shown in (Figure 1-6) respectively.
Statistical Method:
Data were coded and recorded in MS Excel spread sheet program.
SPSS v23 (IBM Corp.) was used for data analysis. Descriptive
statistics were elaborated in the form of means/standard deviations
and medians/IQRs for continuous variables, and frequencies and
percentages for categorical variables. Group comparisons for
continuously distributed data were made using independent sample
‘t’ test when comparing two groups. Linear correlation between two
continuous variables was explored using Pearson’s correlation (if
the data were normally distributed) and Spearman’s correlation (for
non-normally distributed data). Statistical significance was kept at p
< 0.05.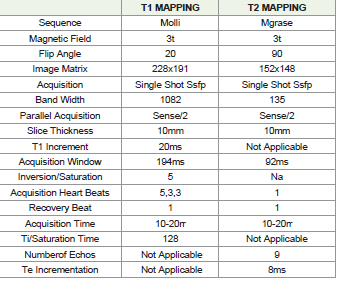

The findings are summarized as follows::
1. Mean myocardial T1 and T2 mapping values using a 3T
MRI scanner were found to be1269.96 ± 37.90 and 47.21 ± 1.47 ms
respectively.
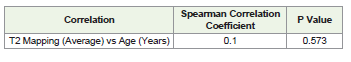
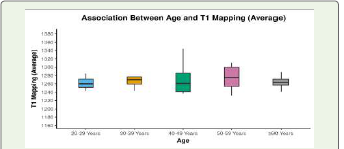
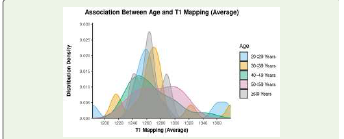
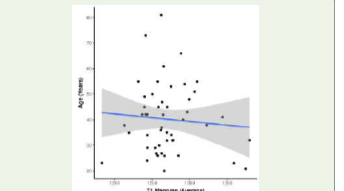
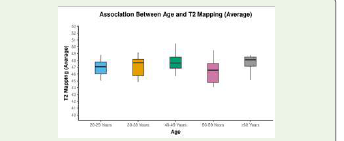
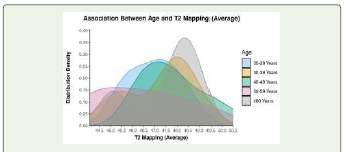
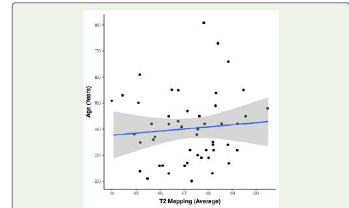
2. No correlation or association found between T1 and T2
mapping values with age.
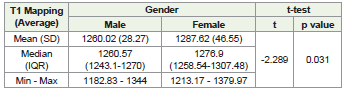
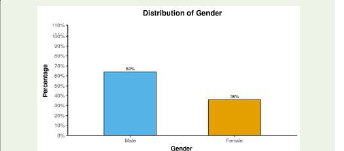
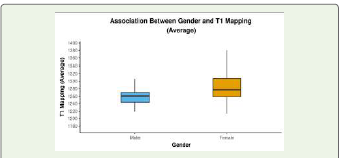
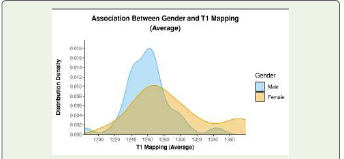
3. Mean T1 mapping values were higher in females (1287.62 ±
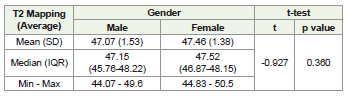
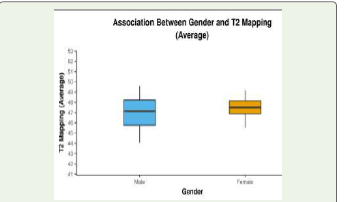
46.55ms), however no statistically significant difference was found in
T2 mapping values between the genders.
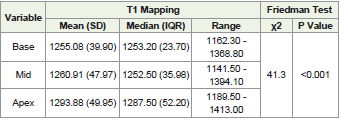
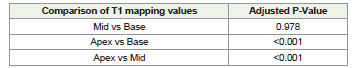
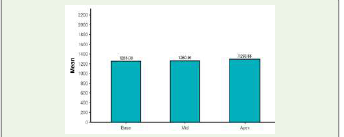
4. The meanT1 values in base, mid and apical segments were
1255.08 ± 39.90ms, 1260.91 ± 47.97ms and 1293.88 ± 49.95 ms
respectively.
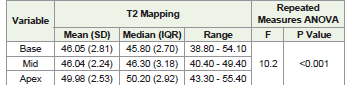
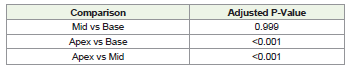
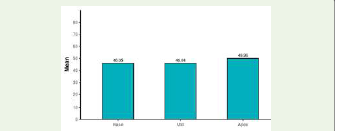
5. The mean T2 values in base, mid and apical segments were
46.05 ± 2.81, 46.04 ± 2.24 and 49.98 ± 2.53 ms respectively.
6. The mean T1 and T2 values in Apical segment were higher as
compared to mid and base.T1 values:
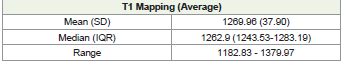
The mean T1 mapping value of the study population was
1269.96±37.90ms with mean T1 value in males being 1260.02ms and
females being 1287.62ms.Higher mean T1 values were noted amongst females. Similar finding was noted by Clotilde Roy et al [6] where women were found to have higher T1 values as compared to men. Whereas Darius Dabir et al [5] and Stefan K Piechnik [8] did not find any statistically significant difference in T1 values between males and females in his study.
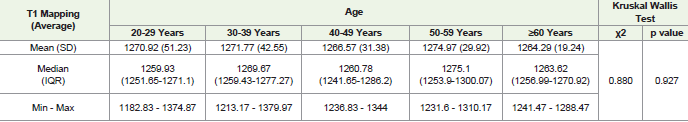
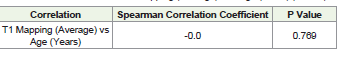
No statistically significant correlation or association was found
between the age groups and T1 values in our study. Darius Dabir et al
[5] also did not find any difference in T1 values between study subjects
belonging to different age groups however Clotilde Roy et al
[6] found that T1 values increased with increased age. Stefan K Piechnik et al
[8] contrary to this found that T1 values decreased with age.
In our study we found that T1 values were higher in the apical
segments as compared to those in the base and mid. We however did
not find a statistically significant difference in the T1 values in base
and mid segments. Knobelsdorff-Brenkenhoff et al
[9] noted that the T1 values successively increased from the base to apex and attributed
it to Partial-volume effects owing to the curvature of the left ventricle
with blood signal being included into the voxel.
T2 values:
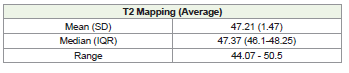
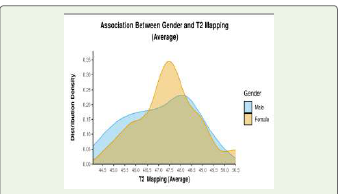
The mean T2 values of the study population were 47.21±1.47ms.
The mean T2 value in males was 47.07±1.53ms and in females was
47.46±1.38ms.There was no significant difference in T2 values amongst the two
genders. Similar findings were also noted by Clotilde Roy et al
[6] and Darius Dabir et al [5]. However, Florian Bönner et al [9] found that female volunteers displayed significantly increased median T2 values
(p < 0.01 for each slice) as compared to males. She also found that,
that the apico-basal T2 gradient was also significant in the aged heart
for males (apical: 63.7 ± 4.7 ms; basal: 60.3 ± 4.6 ms, p < 0.01) and
females (apical: 66.1 ± 5.4 ms; basal: 60.3 ± 3.7 ms, p < 0.01) whereas
the differences in myocardial T2 between male and female within the
slices disappeared.
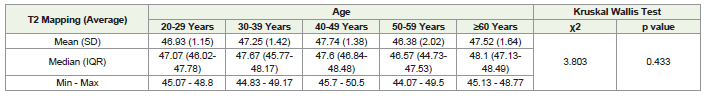
In Florian Bönner et al’s
[10] study, older volunteers had raised
T2 values compared to the respective sex and slice location in younger
volunteers (all p < 0.01) whereas there was no correlation found
between age and T2 values in our study. On the contrary Clotilde Roy
et al [6] found that T2 values significantly decreased with increasing
age. No association between age and T2 values was found in this
study.
In our study just like T1 values were higher in the apical segments
as compared to those in the base and mid, the same trend was
observed with T2 values as well with higher t2 values recorded in
apical segment. Knobelsdorff-Brenkenhoff et al
[9] had reported a
rising trend in T2 values from base to apex just like T1 values. We
however could not demonstrate any statistically significant difference
between base and mid segment T2 values.
Limitations:
This was a single-centre hospital study using only 3T Philips
Ingenia scanner. Comparison study has not been done to values
that can be obtained using scanners of different manufacturers as
cardiac mapping values may vary slightly in scanners of different
manufacturers and at different magnetic field strength.Conclusion:
Our study found the normal reference range of T1 and T2
myocardial mapping in healthy Indian population relative to age and
gender and cardiac segments.We also found that no association or correlation was found between T1 and T2 mapping values and age signifying that age doesn’t alter the tissue characteristics much.
Statistically significant difference was found between T1 mapping
values in males and females with females having higher mean
T1 mapping values and hence this should be kept in mind while
interpreting T1 mapping values in females.
Statistically significant difference in T1 and T2 mapping values
was found between apex and base and apex and mid segments with
the apical segment showing higher T1 and T2 values. This may be
attributed to the partial volume effects due to curvature of the left
ventricle as explained by Knobelsdorff-Brenkenhoff et al.
[9].
References
Citation
Tanushree BS, Chandresh OK, Shrinivas BD. Normal Reference Range of T1 and T2 Myocardial Mapping in Healthy Indian Population Relative to Age and Gender. Indian J Appl Radiol. 2023;9(1): 188.