Research Article
Quantification of Liver Fat on 3T MRI: Comparison between MDIXON and MR Spectroscopy
Tanushree SB1*, Ritu K2 and Shrinivas BD3
1MBBS, Resident Radiodiagnosis Jaslok Hospital and Research Centre, Mumbai India.
2DNB Radiodiagnosis, Consultant Jaslok Hospital and Research Centre, Mumbai India.
3MD Radiodiagnosis, HOD Department of Radio Diagnosis and Interventional Radiology - Jaslok Hospital and Research Centre, Mumbai India
2DNB Radiodiagnosis, Consultant Jaslok Hospital and Research Centre, Mumbai India.
3MD Radiodiagnosis, HOD Department of Radio Diagnosis and Interventional Radiology - Jaslok Hospital and Research Centre, Mumbai India
*Corresponding author: Banerjee Tanushree S, Department of Radio Diagnosis Jaslok Hospital and Research Centre, Mumbai India. E-mail Id: tanbangyan1995@gmail.com
Copyright: © 2023 Tanushree SB, et al. This is an open-access article distributed under the Creative Commons Attribution License, which permits unrestricted use, distribution, and reproduction in any medium, provided the original work is properly cited.
Article Information: Submission: 20/08/2023; Accepted: 22/09/2023; Published: 25/09/2023
Abstract
Objective: To calculate the hepatic fat fraction using mDIXON MRI sequence and to then compare it to the fat fraction calculated using MR Spectroscopy which is considered to be the gold standard for estimation of hepatic fat amongst imaging techniques. The aim was to find if mDIXON fat fraction values
correlate with MR Spectroscopy fat fraction values.
Methods and Materials: 61 patients who were referred for MRI Liver to evaluate hepatic fat- fraction and who fulfilled the inclusion criteria were included in this study. All patients were subjected to MRI Liver scan on 3T MRI (Philips Ingenia) with fixed parameter specifications. Single reader assessed the images obtained using mDIXON and MR spectroscopy and post processing was done and fat fraction values were calculated using both the techniques.
Statistical Analysis: Used STATA software version 12(manufactured by Stata Corp LP, College Station, Texas).
Results & Conclusions: mDIXON fat fraction values showed a high degree of correlation with MR spectroscopy fat fraction values (correlation coefficient-0.975), signifying that mDIXON technique can be used in isolation to quantify hepatic steatosis.
Introduction
Non-alcoholic fatty liver disease is an emerging epidemic in
our country with prevalence of approximately 9-32% [1]. NAFLD
is closely related to metabolic syndrome, the prevalence of which is
also continuously rising [2-4]. The spectrum of NAFLD ranges from
simple steatosis, steatohepatitis to advanced fibrosis and cirrhosis [5].
Mortality rates are higher in patients with NAFLD than the general
population due to cardiovascular complications, metabolic and liver
related disorders. The increased cardiovascular risk correlates with the
severity of steatosis [6,7]. Accurate detection and treatment response
are required owing to the systemic and hepatic complications
associated with NAFLD.
Liver biopsy is considered to be the gold standard for diagnosis
of NAFLD and confirming the presence of associated steatohepatitis.
However, liver biopsy is an invasive procedure and other noninvasive
imaging techniques can be used for diagnosis. Imaging
techniques are frequently used for non-invasive assessment of hepatic
steatosis- USG and CT are usually the first investigations undertaken
and are routinely available but they lack sensitivity and accuracy in
quantifying hepatic steatosis [8-10]. MR spectroscopy is considered
to be the gold standard amongst imaging modalities in calculating
hepatic fat fraction [11-13]. However MR spectroscopy can be
done only one voxel at a time and does not scan the entire liver at
once.
Hence the objective of this study is to calculate the hepatic fat
fraction using mDIXON MRI sequence and to then compare it to the
fat fraction calculated using MR Spectroscopy which is considered
to be the gold standard for estimation of hepatic fat amongst MRI
techniques. The aim is to find if mDIXON fat fraction values correlate
with MR Spectroscopy fat fraction values.
Methods
The study protocol conforms to the Declaration of Helsinki
and was approved by the Institutional Ethics Committee before
commencement and written informed consent was taken from all
patients.
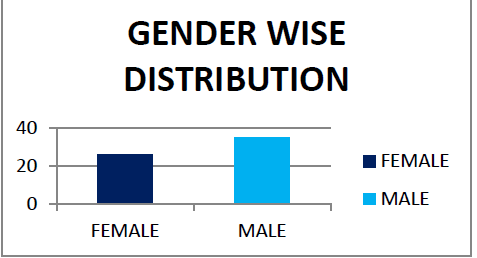
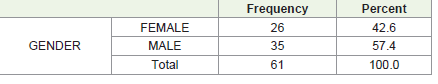
61 healthy asymptomatic volunteers from age 28 to 72 were included in the study, 42.6 % (26) of volunteers were females and 57.4%(35) were males.
Inclusion criteria-Patients who have been diagnosed with Fatty Liver on ultrasonography or have been incidentally recognized to have Fatty Liver on CT.
61 healthy asymptomatic volunteers from age 28 to 72 were included in the study, 42.6 % (26) of volunteers were females and 57.4%(35) were males.
Inclusion criteria-Patients who have been diagnosed with Fatty Liver on ultrasonography or have been incidentally recognized to have Fatty Liver on CT.
Exclusion criteria:
1) People with focal hepatic masses and known hepatic diseases
2) claustrophobic patients
3) patients having non-MRI compatible aneurysm clips, cochlear
implants and other MR non compatible metallic prosthesis
4) pregnancy
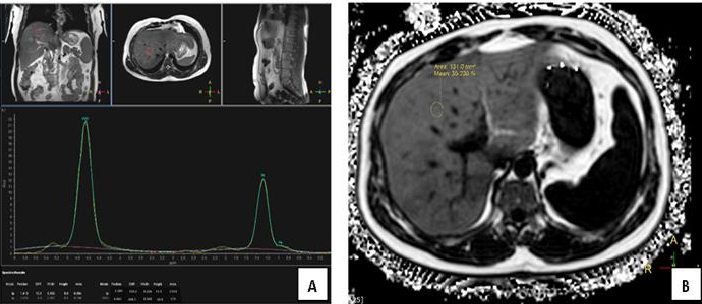
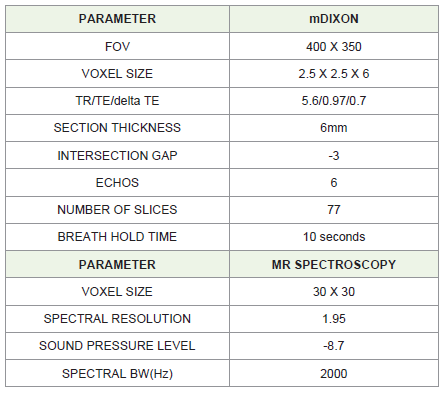
All patients were subjected to an MRI Scan of the Abdomen on
the 3T Philips IngeniaMRI Machine and the following sequences
were acquired: mDIXON and MR Spectroscopy.The patients were placed in the supine and headfirst position and
underwent scanning with breath hold for 10 seconds for mDIXON
sequence. MR spectroscopy sequence lasted for 20 seconds without
any breath hold. ROIs in mDIXON sequence were made in the
right lobe of liver and voxel was placed in a similar location for
MR spectroscopy. No contrast was administered. All images were
transmitted to the post-processing workstation. Few examples are
shown as in [Figure 1,2].

Statistical Method:
Data were coded and recorded in MS Excel spread sheet program.
SPSS v23 (IBM Corp.) was used for data analysis. Descriptive
statistics were elaborated in the form of means/standard deviations
and medians/IQRs for continuous variables, and frequencies and
percentages for categorical variables. Group comparisons for
continuously distributed data were made using independent sample
‘t’ test when comparing two groups. Linear correlation between two
continuous variables was explored using Pearson’s correlation (if
the data were normally distributed) and Spearman’s correlation (for
non-normally distributed data). Statistical significance was kept at p
< 0.05.Results
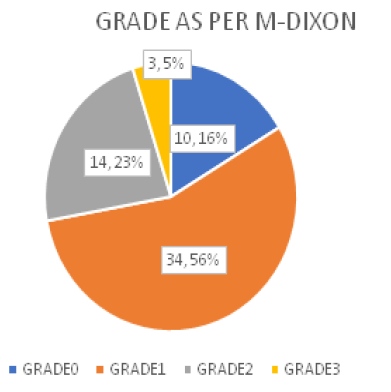
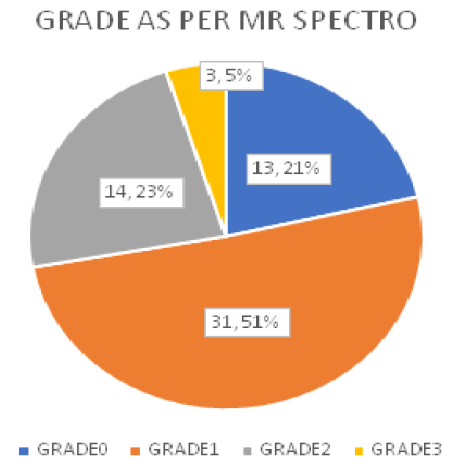
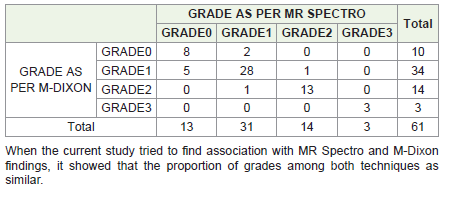
When the current study tried to find association with MR Spectro
and M-Dixon findings, it showed that the proportion of grades
among both techniques as similar.
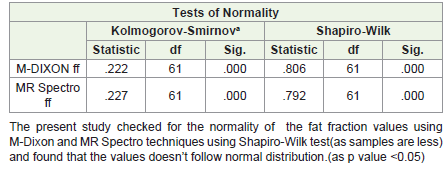
Tests of Normality:
The present study checked for the normality of the fat fraction
values using M-Dixon and MR Spectro techniques using Shapiro-
Wilk test(as samples are less) and found that the values doesn’t follow
normal distribution.(as p value <0.05)Correlation between M-Dixon and Mr Spectroscopy:
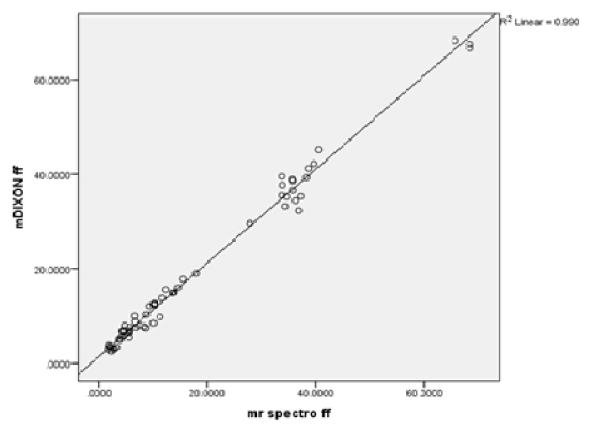
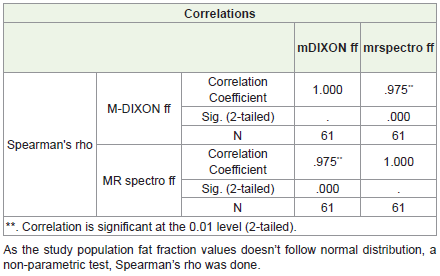
As the study population fat fraction values doesn’t follow normal
distribution, a non-parametric test, Spearman’s rho was done.
As the fat fraction values in both M-Dixon & MR spectroscopy
didn’t follow a normal distribution, non-parametric tests were used
to find out the correlation. The current study used Spearman rho
correlation test which found correlation co-efficient to be 0.975,
representing that there is strong correlation between M-Dixon
technique with MR-Spectroscopy in determining fat fraction values.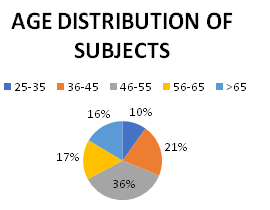
Discussion
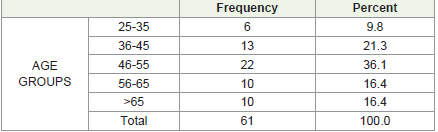
In our study of 61 patients ,42.6%(26) were females and 57.4%(35)
were males .The mean age of the study population was 50.99+/-11.42
years with maximum age being 72 years and minimum age being 28
years . Maximum number of participants belonged to 46-55 years age
group (36.1%, 22 patients).
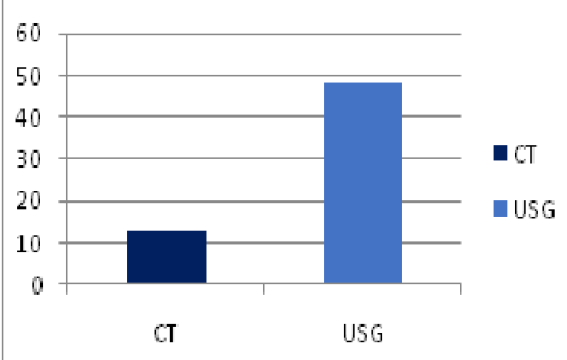
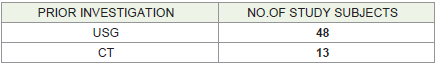
Out of the 61 patients included in our study, 48 patients had
underwent USG Abdomen prior and 33(68.75%) patients were diagnosed as grade I, 14(29.16%) as
grade II and 1(2.08%) as grade III steatosis as per ultrasonography
findings. 13 patients were incidentally detected with hypodense liver
on plain CT scan for CT abdomen or during HRCT Chest.
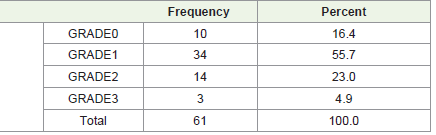
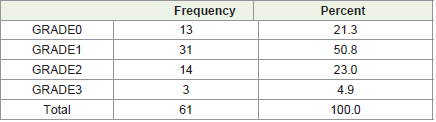
In this study using mDIXON Quant we found that out of 61
patients ,34 patients (55.7%) had grade I steatosis followed by 14
patients (23%) having grade II steatosis. Similar results were found
using MR spectroscopy where 31 patients (50.8%) had grade I
steatosis and 14 patients (23%) had grade II steatosis. Three patients
had grade III steatosis as per both mDIXON and MR spectroscopy.
Our study population fat fraction values did not follow normal
distribution (Normality was checked using Shapiro-Wilk test) and
hence Spearman’s rho test (Non parametric test) was done. The
correlation coefficient between mDIXON and MR spectroscopy fat
fraction values was 0.975 indicating a very strong correlation between
the two techniques.
Guido M Kukuk [14] in their study consisting of 59 patients with
liver disorders found that there was excellent correlation between 6E
mDIXON and MR spectroscopy (mean difference 0.03%) with R=
0.984 which is closely resembles the correlation coefficient of 0.975
found in our study. In their study Guido et al had also compared 6E
mDIXON with histology and had found a strong correlation with
R=0.941 ,we however had not conducted invasive biopsies in our
patients , but this suggests that 6E Dixon sequences like mDIXON
Quant have excellent correlation with histopathology as well. They
had also compared dual echo mDIXON with six echo mDIXON and
had found that Dual echo mDIXON yielded lower PDFF values than
six echo mDIXON (mean difference 1.0%,p<0.001) showing that 6
echo mDIXON is more accurate .
Mazen Noureddin et al[15] in a study consisting of 50 patients
with biopsy proven NAFLD conducted the study at 0 and 24 weeks
and found a robust correlation of MRI-PDFF with MRS-PDFF at 0
and 24 weeks with r=0.98 and p<0.001. Noureddin also commented
that patients who had decrease (≥1%) or increase in MRI-PDFF that
was confirmed with MRS-PDFF showed a parallel decrease or increase
in body weight and serum SGOT and SGPT levels at 24 weeks. This
small increase or decrease in liver fat could not be quantified with
histology and hence concluded that MRI-PDFF was more sensitive
than histology in quantifying hepatic steatosis.
Similar findings were also reported by Yu-Zhen Zhao et al[16]
who studied prevalence of NAFLD in overweight and obese Chinese
children and adolescents and found an excellent correlation between
MRI PDFF values and MRS PDFF values with r=0.973 and p<0.01
when MRI-PDFF was measured with ROI corresponding to the
MRS voxel. Bland-Altman analysis demonstrated a good agreement
between these two methods.
Boris Guiu et al[17] found that the correlation between triple
echo with low flip angle PDFF sequence and MR spectroscopy for
hepatic fat quantification was statistically significant with Pearson
correlation coefficient of 0.989 (p<0.0001) when he conducted a study
in 37 patients with Type II Diabetes Mellitus.
In a similar study conducted by Kim Nhien Vu et[18],seven echo
spoiled gradient echo PDFF sequence and MR spectroscopy was
compared and it found that 7 echo MRI-PDFF excellently correlated
with MRS with interclass correlation coefficient of 0.916.
Study of accuracy of MRI-PDFF using 2 echo, 3echo and
6echo methods was done by Takeshi Yokoo[19] in their study
using MRS PDFF as the reference standard [47]. Regression slope
of 2,3 and 6 echo PDFF methods were 0.8522,0.8528 and 0.7544
without multifrequency modelling and 0.9994,0.9775 and 0.9821
with multifrequency modelling. Classification accuracy was 88.3-
92%, 95.1-96.3% and 94.5-96.3% respectively using multifrequency
modelling. All these results pointed out that MRI-PDFF technique is
an accurate method of determining hepatic fat fraction.
Mona Zaky et a[20] in their study compared mDIXON fat
fraction values with histology and found that estimation of fat fraction
using mDixon method revealed sensitivity of 83.3% and specificity of
85.7% compared to liver biopsy results.
Ilkay S. Idilman et al [21] in their study comprising of 70 patients
with NAFLD concluded that there was close correlation between
multiecho MRI PDFF and liver biopsy (r=0.82) and PDFF was
successful in differentiating moderate or severe steatosis from mild
steatosis with area under the curve of 0.95. The correlation between
MRI PDFF and histology was lesser when fibrosis was present (r=0.60)
than when fibrosis was absent (r=0.86) suggesting that presence of
fibrosis reduced the accuracy of MRI PDFF.
Limitations:
There are a few limitations of this study:
1. Histological confirmation for grading of fatty liver was not
done.
2. This was a single-center hospital study. Our results might not
be applicable to other geographic location within the country
with different sociocultural habits.
3. No follow up of patients was done with volunteers undergoing
measures to reduce fatty liver.
4. Inter and intra-reader comparison of mDIXON values and
MR spectroscopy fat fraction values processing was not done.Conclusion
mDIXON fat fraction values showed a high degree of
correlation with MR spectroscopy fat fraction values (correlation
coefficient-0.975), signifying that mDIXON technique can be used
in isolation to quantify hepatic steatosis.Statistically significant
association was found between fat fraction values using both
techniques.
References
Citation
Tanushree SB, Ritu K, Shrinivas BD3. Quantification of Liver Fat on 3T MRI: Comparison between MDIXON and MR Spectroscopy. Indian J Appl Radiol. 2023;9(1): 186.