Research Article
Correlation of CT Severity Index with Lab Parameters in Covid 19 Infection
Kaviya V*, Mary VJ, Suresh A, Swathi M, Geetika P and Sudhanva N
Department of Radiodiagnosis & Imaging, Vydehi Institute of Medical Science, Bangalore, India
*Corresponding author: Kaviya V, Department of Radiodiagnosis & Imaging, Vydehi Institute of Medical Science,
Bangalore, India Email: vkaviya868@gmail.com
Copyright: © 2023 Kaviya V, et al. This is an open access article distributed under the Creative Commons Attribution
License, which permits unrestricted use, distribution, and reproduction in any medium, provided the original work is
properly cited.
Article Information: Submission: 21/01/2023; Accepted: 25/03/2023; Published: 29/03/2023
Abstract
COVID 19 is one of the globally fatal disease caused by severe acute respiratory syndrome coronavirus –2(SARS-COV2). Its main mode of spread is
through respiratory tract by droplets/air born, close contact with infected patients and those travelling to the epidemic country. Radiological imaging plays an
imperative part to assess the severity of COVID 19 infection, among which CT is the most important diagnostic tool. Lab parameters like D- Dimer, CRP, S.
ferritin and lymphocyte count are evaluated to assess the severity of infection. So the lab parameters are correlated in RT-PCR positive patients undergoing
CT chest imaging. Correlation is done for the purpose of repeating the lab parameters to examine the patient’s condition, as repeated CTs are not advised.
The major focus of this investigation is to assess the chest CT correlation to the lab parameters.
Keywords
COVID; CT scan; SPSS; CRP; D-Dimer; S. Ferritin; Lymphocyte
Introduction
COVID-19 was declared pandemic by the World Health
Organization (WHO), following pneumonia infection by a new
coronavirus, it has spread rapidly and has become extremely aggressive.
The most common clinical symptoms are fever, shortness of breath,
dry cough, fatigue, myalgia, and gastrointestinal issues like diarrhoea
and vomiting [1,2]. The occurrence of the disease was manifested
by decreased blood O2 saturation, cough, headache, upper airway
infection, acute respiratory distress syndrome (ARDS), and lung
involvement in imaging studies [3]. In COVID-19-infected patients,
lung involvement was identified to be the most important prognostic
factor [4]. Reverse Transcription-Polymerase Chain Reaction (RTPCR)
is commonly used to diagnose COVID-19 infection, which is
highly specific. Similarly, chest computed tomography (CT), which is simple and quick, is used to identify COVID 19 [5], but
it has low specificity of 25% and very high sensitivity of up to 97.2 %. Laboratory parameters such as D-dimer, C-reactive protein, serum
ferritin and lymphocyte count were also found to be useful in the
diagnosing COVID-19 infection
The CT imaging of chest is beneficial for detecting lung
abnormalities, screening, diagnosing, and clinically classifying
patients who are suspected to have infection. CT scans can also be
used to monitor patient’s status post discharge from the hospital. The
abnormalities such as bilateral and multilobar ground-glass opacities
are most common patterns [6]. Other radiographic abnormalities like
reverse halo sign, airway changes, and crazy paving pattern have also
been observed in COVID-19-infected patients [7].
Some studies have found a correlation between chest CT findings
and a patient’s laboratory data, suggesting that correlation could help
determine the severity of the infection. The CT severity score system
is a semi-quantitative scoring system for determining the severity
and extent of lung involvement. The scoring system might be used
to estimate the degree of COVID-19 pneumonia in their lungs [8].
Methods
Data Collection:
The complete analysis was conducted in VIMS &RC, Bangalore.
After ethical clearance, the HRCT images of 200 RT-PCR positive
COVID patients were collected from the radiology department of
VIMS & RC. The corresponding lab parameters for the patients were
also collected from the hospital database and data’s were correlated.HRCT:
The HRCT thorax was done with a 128 slice Siemens Somatom
Scanner using single breath hold. The following scanning parameters
were used: tube voltage of 100 – 120 kVp, tube current of 120 mAs,
collimation of 1.5 -3mm, slice thickness of 1.0 mm at zero intervals.HRCT Image Analysis:
A team of 4 duty radiologists and two faculty with 7 and 10 years
of experience in radio diagnosis evaluated the CT image. The scoring
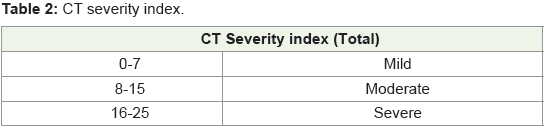
and severity index is based on the data in (Table 1 & Table 2). CT severity
index and score for the lung development was developed by Yang et al
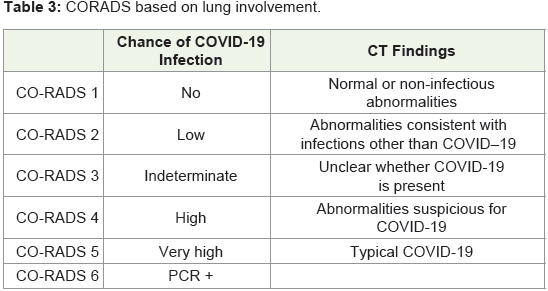
[8]. CO-RADS is the method used for CT score calculation is shown
in (Table 3).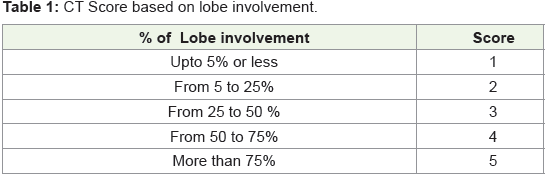
Lab Parameters:
The lab parameters like C-Reactive Protein, D-Dimer, Serum
Ferritin, Lymphocyte count obtained on the same day or previous
day of CT imaging was used for correlation with CT severity index.Statistical Analysis:
Statistical analysis was done using IBM SPSS 20.0 Software.
Pearson correlation coefficient was used to correlate CT Severity
index and lab parameters. CT severity index is also correlated with
age and gender. The P-value less than 0.05 was considered to be
statistically significant.Results and Discussion
In the analysis of 200 COVID-19 infected patients 54 were
females and 146 were males as shown in (Figure 1).
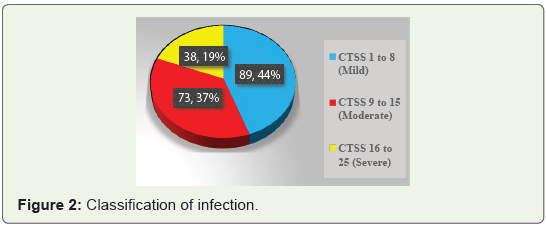
CT score of 1 to 8 was categorized as mild infection with 89
patients [44%], 62 males and 27 females of age 18 to 80 years. CT
score of 9 to 15 was categorized as moderate infection with 73 patients
[37%], 55 males and 18 females of age 18 to 60 years. CT score of 16
to 25 was categorized as severe infection with 38 patients, [19%] 29
males and 9 females of age 18 to 73 years (Figure 2).
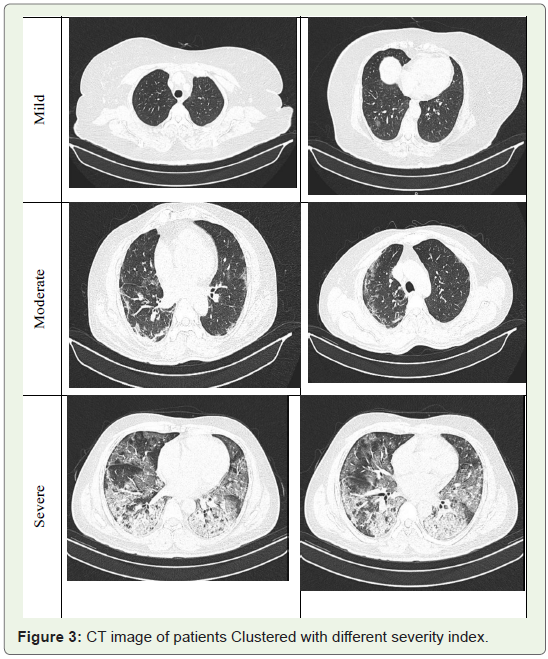
The CT images of patients affected with severe, moderate and
mild infections are shown in (Figure 3). The lobar involvement was
used to calculate CT score and score of 1 to 5 is given for each lobe.
The CT severity score based on the imaging is shown in Table 1 & Table 2.
Statistical Analysis using SPSS:
The statistical analysis was done with SPSS 20.0 software for
the correlation of CT severity Score and lab parameters. The overall
analysis gives statistical significance with P value < 0.05 and 0.01.All the parameters are correlated, with the confidence level of
99% for CT score and lab parameters and 95% for CT score and age
factor. The Correlation matrix is shown in (Table 3). The overall
analysis implies lymphocyte count and serum ferritin are highly
correlated compared to other parameters. The other two parameters
such as D-Dimer and C-Reactive protein have limited correlation,
and it varies with CT score based on age, gender, comorbidities, etc.
At last correlation analysis was done between CT Severity Score and
Age and it was significant with 95% confidence level.
Correlation Analysis using SPSS 3.2.1Correlation analysis of Age and Gender:
COVID-19 infected patient’s CT Severity Score was correlated
with Age and correlation was significant at 0.05 level (2-tailed) with
a correlation index of 0.168 and a significance of P=0.018 [i.e. <0.05]
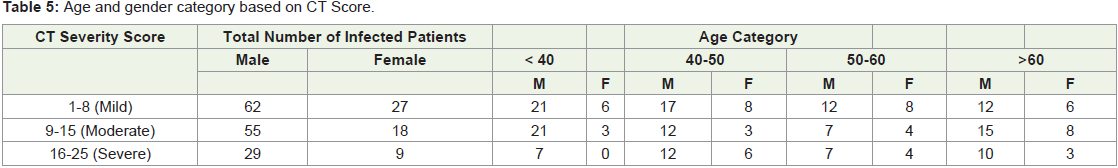
having a correlation of 95% significant. The CT score along with age
and gender category is listed in Table 4 & Table 5.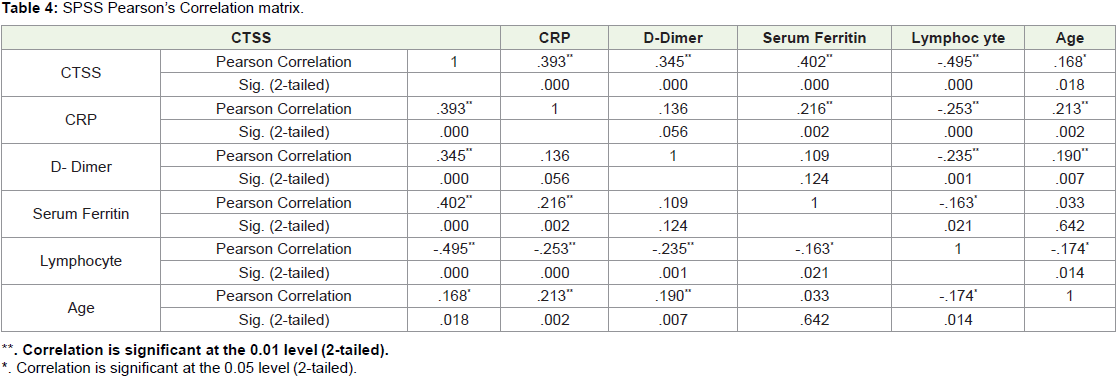
Correlation analysis of Lab Parameters: The Pearson correlation
analysis for different lab parameters was performed and the
correlation had significant P value 0.001 i.e 99% confidence level
for all lab parameters such as lymphocyte, serum ferrite, C-reactive
protein and D-Dimer. Further simple and mean scatter plot for all
200 patients were plotted to understand the range of lab parameters
obtained for different level.
Correlation analysis of CTSS and Lymphocyte Count:
The Pearson correlation analysis showed better correlation for CT
score and Lymphocyte count compared to other lab parameters. The
simple scatter plot and mean scatter plot of 200 patients are shown in
(Figure 4)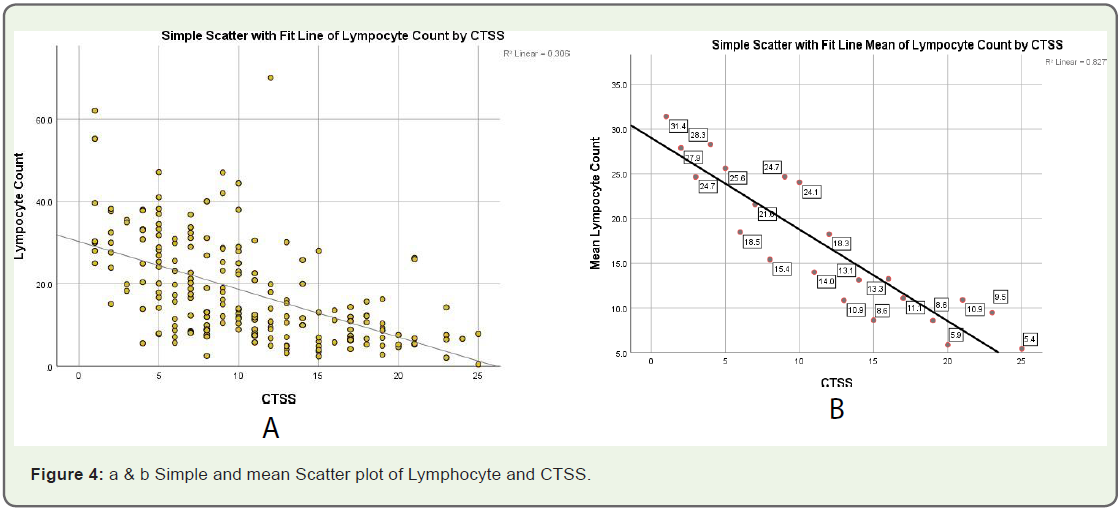
The lymphocyte count for normal patient is 20 to 40 (μL). From
the correlation analysis it was found that lymphocyte count decreases
as the CT Score increases. The R square value of mean lymphocyte
was found to be 0.827 based on linear regression analysis. The
Lymphocyte value for patients with mild symptom was in the range
of 18 to 35 (μL), for the patients with moderate infection it was 15 to
10 (μL) and for patients with severe infection it is of 10 to 5 (μL) on an
average showing drastic reduction from normal value.
Correlation analysis of CTSS and C-Reactive Protein:
The Pearson correlation analysis showed better correlation for CT
score and CRP after lymphocyte count. The simple scatter plot and
mean scatter plot of 200 patients are shown in (Figure 5). The
C-Reactive protein for normal patient was found to be 0 to 4 (mg/dl)
for normal patients. From the correlation analysis, the serum ferritin
increases as CT score increases and the correlation was found to be
significant with the P value of 0.001 having 99% percent correlation.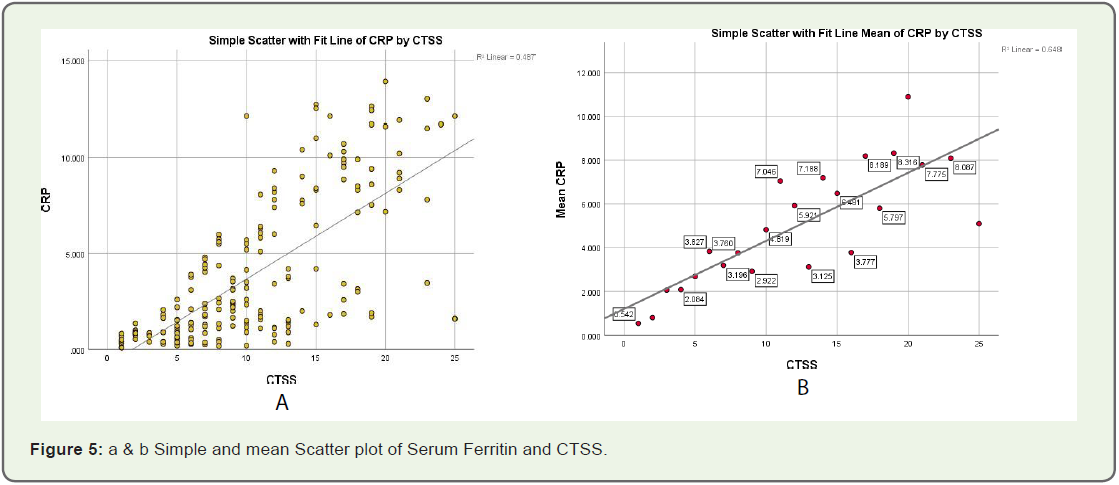
The R square value of mean C reactive protein was 0.648 based
on linear regression analysis. The C Reactive protein for patients with
mild symptom was between 0 to 4 (mg/dl), for patients with moderate
infection, it was between 4 to 6 (mg/dl) and for patients with severe infection, it was between 6 to 10 (mg/dl), with drastic increase from
normal value.
Correlation analysis of CTSS and Serum Ferritin:
The Pearson correlation analysis showed better correlation for
CT score and serum ferritin value next to that of Lymphocyte count
and C reactive protein. The simple scatter plot and mean scatter plot
of 200 patients are shown in (Figure 6).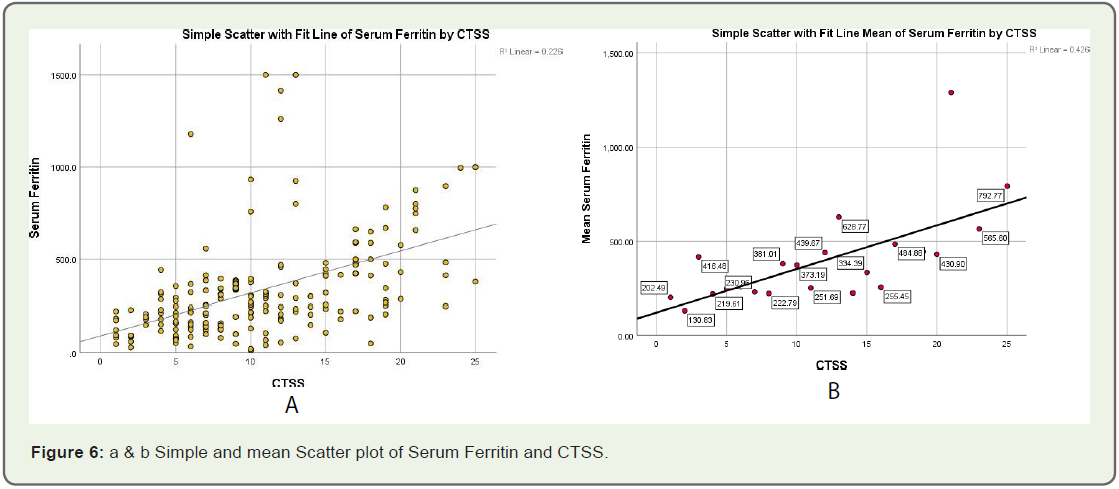
The Serum Ferritin value for normal patient was found to be 200
to 300 (ng/ml). From the correlation analysis it was found that serum
ferritin increases as the CT score increases with P value of 0.001 showing 99% percent correlation. The R square value of mean serum
ferritin was 0.426 based on linear regression analysis. The serum
ferritin value for patients with mild symptom was between 200 to 320
(ng/ml) that falls under the normal range of serum ferritin level, for
patients with moderate infection it was between 300 to 450 (ng/ml)
and the patients with severe infection it was between 450 to 600 (ng/
ml) with drastic increase from normal value.
Correlation analysis of CTSS and D Dimer:
The Pearson correlation analysis showed least correlation for CT
score and D Dimer value compared to other lab parameters such as Lymphocyte count, C Reactive protein and Serum Ferritin. The
simple scatter plot and mean scatter plot of 200 patients are shown
in (Figure 7).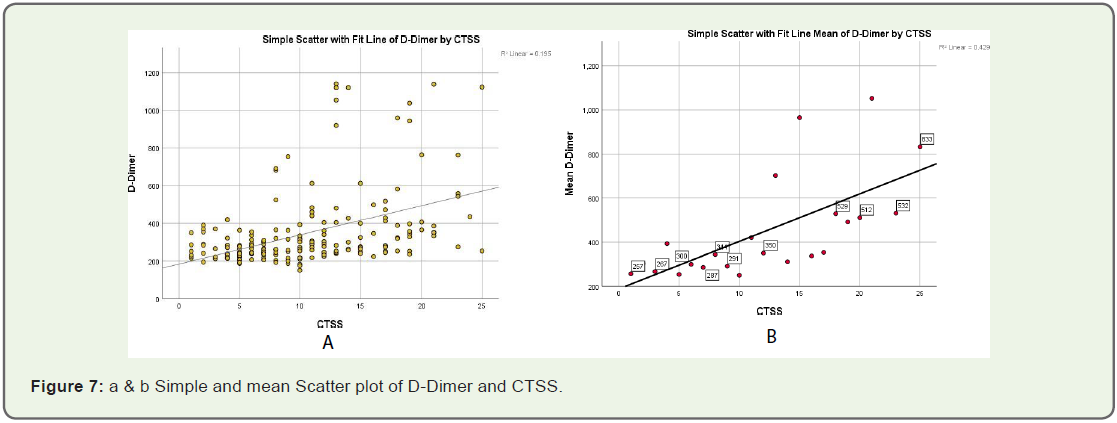
The D-Dimer value for normal patient was 200 to 300 (ng/
ml). From the correlation analysis it was found that D-Dimer was
increasing as the CT score increases with P value of 0.001 showing
99% percent correlation. The R square value of mean serum ferritin
was 0.429 based on linear regression analysis. The D Dimer value for
patients with mild symptom was between 200 to 300 (ng/ml), for
patients with moderate infection it is between 300 to 400 (ng/ml) and
for patients with severe infection it is between 400 to 800 (ng/ml) with
drastic increase from normal value.
Discussion
Coronavirus disease 2019 (COVID-19) is a highly infectious viral
respiratory disease that has recently emerged from China and has
become a pandemic [9].
In the present study, an attempt was made to outline distribution
of laboratory features at presentation, severity of patients based
on CT imaging, and their correlation with clinical and laboratory
parameters of patients to put diagnostic, therapeutic, and prognostic
tools for COVID-19 disease.
Majority of cases were aged between 40 - 50 years in our study.
Among previous studies, Bhandari S et al. [10] reported that the mean
age of the patients was 50 - 40 years, which is very similar to our study.
CT score of 1 to 8 was categorized as mild infection with 89
patients [44%], 62 males and 27 females of age 18 to 80 years. CT
score of 9 to 15 was categorized as moderate infection with 73 patients
[37%], 55 males and 18 females of age 18 to 60 years. CT score of 16 to
25 was categorized as severe infection with 38 patients, [19%] 29 males
and 9 females of age 18 to 73 years. This can be affected by different
factors like the stage of the pandemic when the study was carried, presence of patients’ comorbidities, maturity and preparation of the
healthcare system, and existence of elderly nursing homes services
where disease can spread faster.
In our observation., The lymphocyte count for normal patient
is 20 to 40 (μL). From the correlation analysis it was found that
lymphocyte count decreases as the CT Score increases. Swati Sharma
et al., showed that comparison with disease severity as per CTSS,
mean of lymphocyte count shows decreasing trend with increasing
disease severity with significant statistical correlation [11]. However,
no statistically significant correlation was observed between CT score
and lymphocyte count was observed according to Marco Francone
et al [12].
In our study, the Pearson correlation analysis showed better
correlation for CT score and CRP after lymphocyte count. Swati
Sharma et al., also reported that mean of CRP was significantly
higher in severe group. Their finding was also found to have positive
statistically significant correlation with CTSS [11].
From the correlation analysis, the serum ferritin increases as
CT score increases and the correlation was found to be significant
with the P value of 0.001 having 99% percent correlation. Many
previous studies have suggested alterations of laboratory parameters
in COVID-19 patients with greater frequency such as lymphocyte
count, CRP, D-dimer, and serum ferritin [13,14] Similarly, serum
ferritin acts as a vital mediator of immune dysregulation as shown
in this study where serum ferritin level was closely correlated with
severity of disease. Saeed et al and Yilmaz et al in their study found a
positive correlation between S. Ferritin levels and CT severity score
(p<0.0001 and p –0.0001 respectively) [15,16] . El Bakry et al in their
study found that S. Ferritin was significantly elevated in critically ill
patients and it can be used to predict short term outcome in them
[17]. These findings were similar to our study in which more severe
the disease higher was the S. Ferritin level.
In the same way., from the correlation analysis it was found that
D-Dimer was increasing as the CT score increases with P value of
0.001 showing 99% percent correlation. Francone et al and Yilmaz et
al in their studies have shown significant correlation between CT or
disease severity with d-dimer values [12,18].
Conclusion
The results of the analysed data showed strong correlation between
CT severity index and lab parameters. Among the lab parameters, C
Reactive protein and Lymphocyte count was found to have maximum
correlation with 99% confidence level. The other two parameter such
as Serum Ferritin and D Dimer was also found to be highly significant
with P value <0.001 but had less correlation compared to C Reactive
protein and lymphocyte count.
Ethical Clearance:
Ethical clearance was obtained from medical ethical committee in
Vydehi Institute of Medical Science for this study.References
Citation
Kaviya V, Mary VJ, Suresh A, Swathi M, Geetika P and Sudhanva N. Correlation of CT Severity Index with Lab Parameters in Covid 19 Infection. Indian J Appl Radiol. 2023;9(1): 180.