Research Article
Utility of Advance MR Imaging in Differentiation of Benign and Malignant Orbital Masses
Bansal A1, Kumar A1*, Bhatia V1, Singh U2, Ahuja CK1 and Nahar U3
1Department of Radiodiagnosis and Imaging, PGIMER, India
2Department of Opthalmology, PGIMER, India
3Department of Histopathology, PGIMER, India
*Corresponding author: Kumar A, Department of Radiodiagnosis and Imaging, PGIMER, Chandigarh - 160012, India,
Phone: +91-7087009385; E-mail: ajay2509@gmail.com
Copyright: © 2021 Bansal A, et al. This is an open access article distributed under the Creative Commons Attribution
License, which permits unrestricted use, distribution, and reproduction in any medium, provided the original work is
properly cited.
Article Information: Submission: 17/08/2021; Accepted: 10/11/2021; Published: 15/11/2021
Abstract
Aim: The purpose of this study was to evaluate the utility of advanced MR techniques to improve the diagnostic ability to differentiate between these
entities.
Material and Methods: A prospective evaluation of 26 patients (12 men and 14 women with a mean age of 34.8 years) presenting with orbital masses
to our institute was done. MRI was performed in all patients with advanced techniques DWI, MRS and dynamic (DCE) on a 1.5 T scanner.
Results: ADC cut off value of 0.809 x 10⁻³ mm2/sec was determined using the ROC curve to differentiate malignant from benign lesions resulting in
a sensitivity of 72.2% specificity of 75%, positive predictive value of 86.6% and Negative predictive value of 54.5%. Lesions with Tp < 141.5s showed a
sensitivity of ~94.4% and specificity of ~87.5%, positive predictive value of 94.4% and Negative predictive value of 87.5%for malignancy. The lesions with
Slope > 0.47 showed a sensitivity of ~100% and specificity of ~78%, positive predictive value of 66.6% and Negative predictive value of 100% for malignancy.
Significant difference was seen between type I and type III curves with a p value ~0.002. Presence of choline peak had a sensitivity of ~ 62.5%, specificity
of ~94.4%, positive predictive value of 83.3% and negative predictive value of 85% for malignancy.
Conclusion: Use of advanced MR imaging with inclusion of DW, MRS and perfusion parameters can significantly increase our diagnostic confidence in
differentiating benign from malignant orbital lesions.
Introduction
Lesions in the orbit can be classified either according to the location
of the mass or its histological subtype [1,2]. Conventional imaging
techniques i.e. Multidetector computed tomography (MDCT) and
magnetic resonance imaging (MRI) do not have sufficient sensitivity
and specificity to help in differentiating malignant masses from benign
lesions, with a high chance of misdiagnosis in case of unexpected rare
entities [3,4]. Addition of new MR imaging techniques, like dynamic
contrast enhanced (DCE) MR sequences, diffusion weighted imaging
(DWI) and magnetic resonance spectroscopy (MRS), to the original
sequences can provide different forms of tissue contrast and may help
in better characterization of orbital lesions [5].
Methods
This was a single institution prospective study which was
approved by the Ethics Committee of the institute. A total of 26
patients with orbital mass (12 men and 14 women with a mean age of
34.8 years) were enrolled over a period of one year in the study. These
patients had come to our institute with complaints of proptosis and/
or reduced visual acuity. The exclusion criteria for this study were
contraindication for performing MRI study i.e. metallic implants,
claustrophobia, and refusal to give consent and presence of large
amounts of necrosis or calcification in orbital mass.
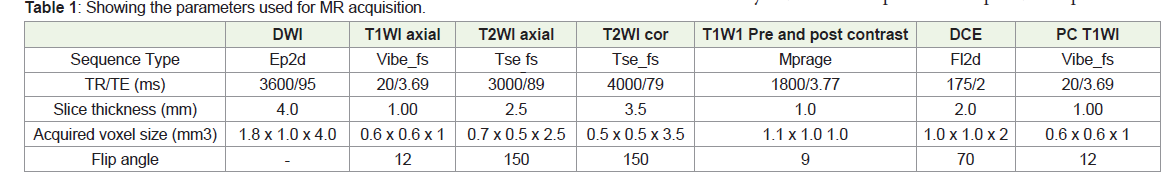
All studies were performed at 1.5T MRI unit (Siemens, Magnetom Aera; Siemens Healthcare, Erlangen, Germany) equipped with high
performance gradient system with a head coil with the following
protocol (Table 1). All the imaging data was systematically evaluated
by two radiologists (one fellow resident and a second neuroradiologist
with over 10 years of experience).
For DWI, all regions of interests (ROIs) were drawn manually.
ADC values were calculated by adjusting the size of the ROI according
to the size of the lesion. In lesions less than 2 cm in maximum
diameter, one ROI was taken of .014 sq cm areas. In lesions that were
larger than 2 cm, at least two or more ROIs were placed, avoiding
the necrotic component of the lesion, and their mean (ADCmean)
values calculated. The ADC values were expressed in 10-3 mm2/s. For
MRS, Chemical shift imaging (CSI), using multiple voxels, or single
voxel spectroscopy (SVS) was used according to size of the lesion
and morphological appearance. Water and fat suppression was done
automatically prior to all spectroscopic examinations using CHESS
and other volume fat suppression techniques. For DCE, a coronal
dataset including the lesion was acquired just before injection of the
contrast and subsequently 6 datasets were acquired in a time period
of 5 minutes after contrast injection. Multiple ROIs were applied and
one ROI was selected which showed maximum enhancement pattern.
The size of the lesion determined the size of the ROIs. The signal
intensity (SI) of each slice of the dynamic sequence was determined
from its mean pixel value. The representative ROI and corresponding
time intensity curve (TIC) were obtained for each mass. -Three types
of enhancement curves were obtained [4]: (i) The persistent pattern
(type-I) - The lesion shows continuous progressive enhancement (ii)
The plateau pattern (type-II) - In this pattern, there is a sharp rise in the
enhancement, which then attains a plateau (iii) The washout pattern
(type-III) - a rapid rise in enhancement followed by rapid decline
with the final signal intensity <90% of the peak signal intensity. Each
TIC was used to derive values for the baseline signal intensity (SIpre),
maximum signal intensity at the peak of enhancement (SImax), and
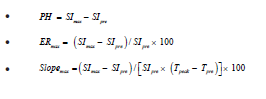
times corresponding to these signal intensities (Tpre, Tpeak).Dependent
parameters like peak enhancement (PH), enhancement ratio (ERmax)
and Slopemax, were calculated using the above mentioned four
independent variables with the help of the following formulas
Final diagnosis was achieved in all cases through histopathological
examination after the MR imaging.
Statistical analysis: Discrete categorical data (sex, MRS, Biopsy)
was represented in the form of either a number or a percentage (%);
Continuous data that were not normally distributed were reported as median and Inter quartile ranges. The distribution of the variables
was tested with the Shapiro-Wilk test. For medians of ADC mean, group
comparisons (groups were Biopsy positive/negative) were made with
the help of Mann Whitney test. Comparison of means of 2 groups of
SImax, Tp,PH, ER, Slope of the subjects was done using Independent
t-test. To assess the performance of MRS in predicting the disease,
sensitivity (Se), specificity (Sp), positive predictive value (PPV),
negative predictive value (NPV) and diagnostic accuracy, keeping
Biopsy as gold standard, were calculated using kappa test. Receiver
operating characteristic (ROC) curves was calculated for SI (max),
Tp, PH, ER, Slope and for ADC separately. Chi square or Fishers
exact test was used to compare proportions which were dependent
on their applicability. McNemar’s test was used to see differences in
diagnosis between two modalities. Concordance and discordance was
calculated by method of Kappa test of agreement. All the statistical
tests were two-sided performed at a significance level of α=.05.
Analysis was conducted using IBM SPSS STATISTICS (version 22.0).
Results
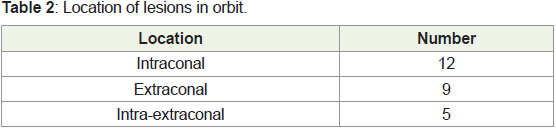
The location of the masses is summarized in Table 2: Of the 26 cases
which were included in the study, 18/26 (69.2%) orbital masses were
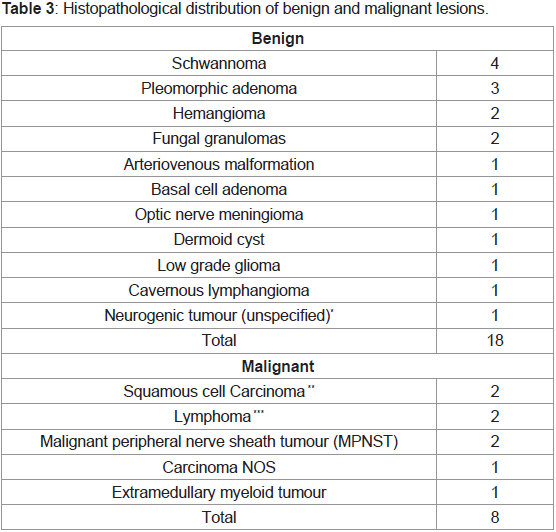
histopathologically proven to be benign and 8/26 (30.7%) malignant.
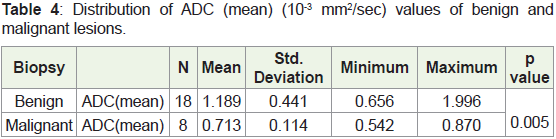
The histopathological distribution is given in Table 3. The means and
standard deviations of ADC values of benign and malignant lesions
were calculated separately and are shown in Table 4. ROC was drawn
and area under the curve (AUC) was determined as ~0.854 (Figure
1). A cut off value of 0.809 x 10⁻³ mm2/sec was determined using the
ROC curve to differentiate malignant from benign lesions resulting
in a sensitivity of72.2% specificity of 75%, positive predictive value of
86.6% and Negative predictive value of 54.5%.
The DCE parameters of the benign and malignant lesions are
summarized in Table 5.
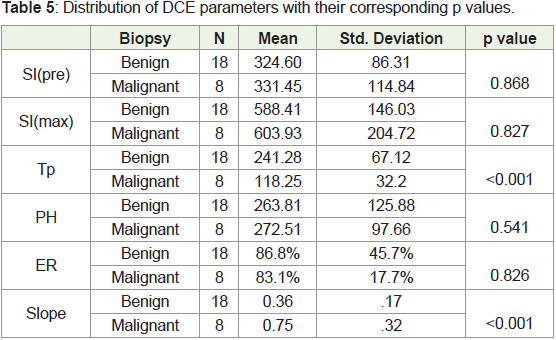
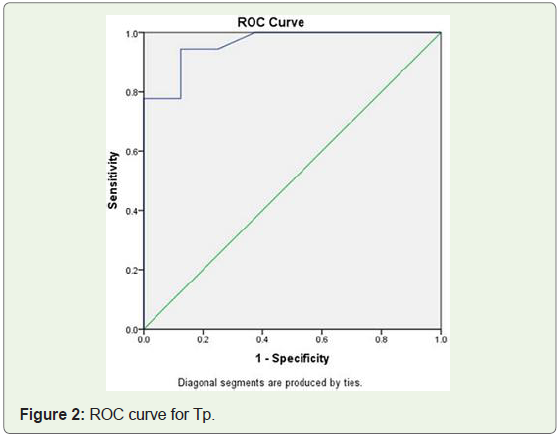
Out of these values Tp and Slope were found to have a significant
difference between benign and malignant lesions. Tp had a p value
of <0.001. ROC curve was drawn with the area under the curve 0.96
(Figure 2). A cut off value of 141.5 seconds was determined through
the ROC curve and the lesions with Tp< 141.5s showed a sensitivity of
~94.4% and specificity of ~87.5% (Figure 2), Positive predictive value
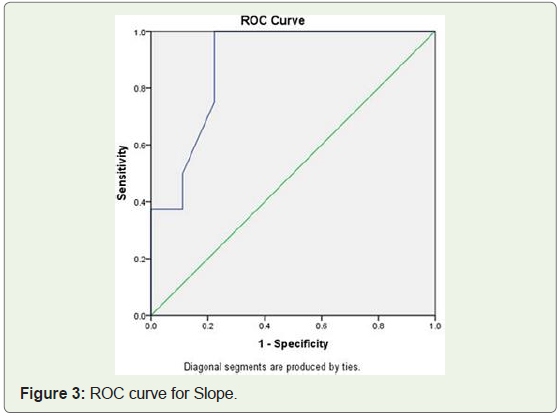
of 94.4% and Negative predictive value of 87.5% for malignancy. Slope
had a p value of <0.001. ROC curve was drawn with the area under the
curve 0.889 and cut off value of 0.47 (Figure 3). Lesions with Slope >
0.47 showed a sensitivity of ~100% and specificity of ~78%, positive
predictive value of 66.6% and Negative predictive value of 100% for
malignancy.
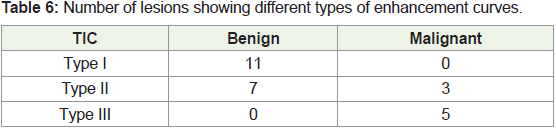
Time intensity curves were plotted for perfusion parameters (Table 6). All the lesions which demonstrated type I pattern were
benign and all lesions demonstrating type III pattern were malignant
[5,11]. Of the 10 lesions demonstrating type II curve, seven were
benign and three malignant. The malignant lesions demonstrating
type II curve were lymphoma, carcinoma NOS and one MPNST. A
p value of ~0.002 was seen among type I and III curves. Significant
difference between benign and malignant lesions was not seen using the values of SI(pre), SI(max), PH and ER.
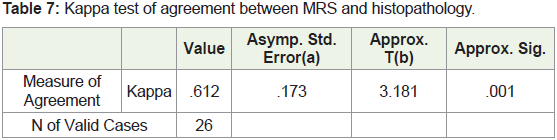
MRS data of the patients was analyzed. The kappa value generated
was 0.877 which implies almost perfect agreement of choline peak
with malignancy (Table 7). With use of choline peak a sensitivity
of ~ 62.5%, specificity of ~94.4%, positive predictive value of 83.3%
and Negative predictive value of 85% for malignancy was obtained.
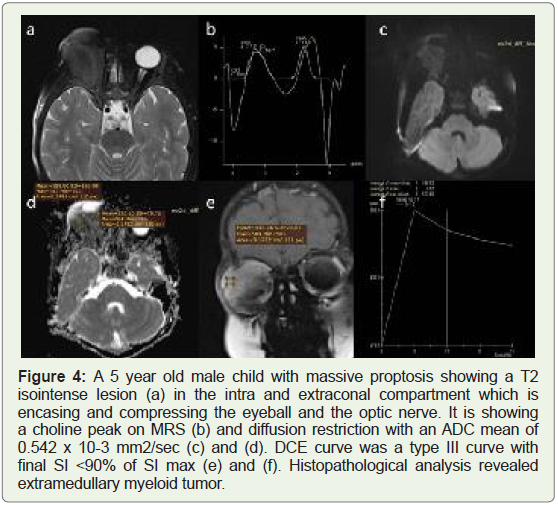
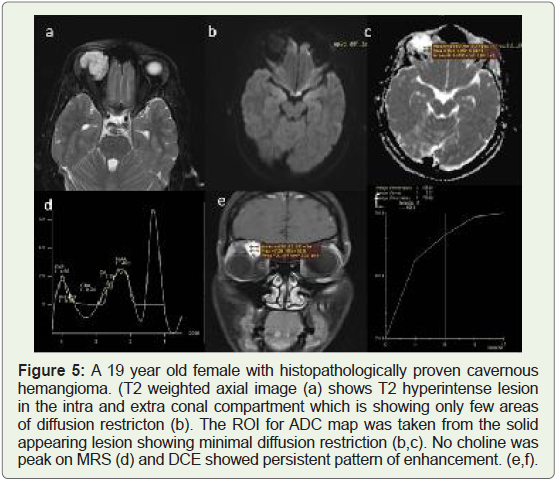
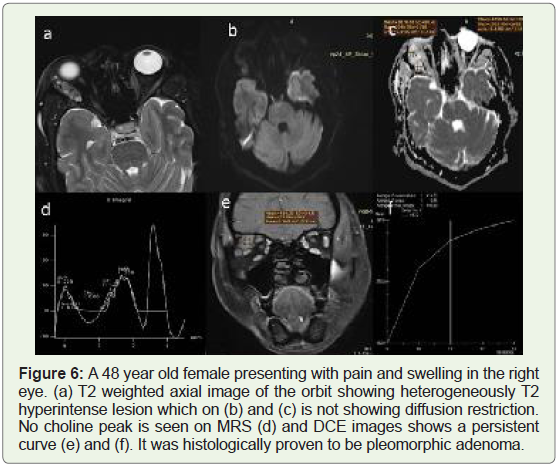
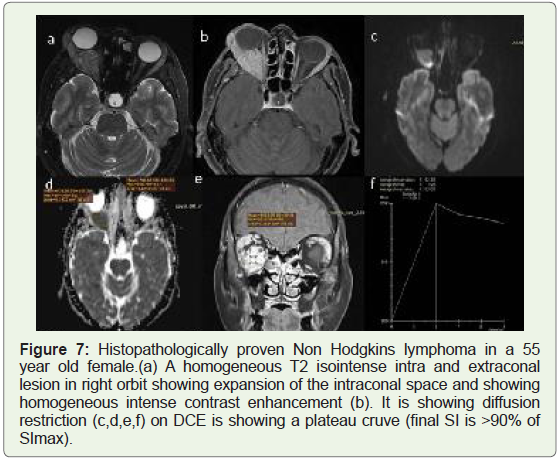
Representative cases showing histopathological proven benign and malignant orbital mass evaluated with above parameters are shown
in Figure 4-7.
Discussion
There is a need to differentiate between benign and malignant
orbital masses for better treatment planning of individual cases
[6,7,8]. A study conducted by Ben Simon et al., showed poor
sensitivity of both CT and MR features in differentiation of malignant
from benignlesions [9].
In our study, we applied newer MRI sequences DWI, DCE-MRI
and MRS to evaluate few objective criteria to differentiate the nature
of the lesions. On histopathological evaluation, 69.2% (18) lesions
in our study were benign and 30.7 (eight) malignant, which roughly
corresponds to the ratio in the general population [2].
Malignant tumors have increased cellularity with large nuclei and
reduced extra-cellular space, which leads to restriction of free water
movement and a dark signal on ADC map [10]. Sepahdari et al. found that benign lesions had a higher ADC value than malignant A cut
off value of 1.0 x 10⁻³ mm2/sec was determined [5], which resulted
in a sensitivity of 63%, specificity of 84% and accuracy of 71% for
differentiating benign vs malignant lesion. Similar studies were done
by Razek et al. and Fatima et al. [11,12], demonstrating the usefulness
of ADC mapping in differentiating benign from malignant lesions.
In our study, cut off value of 0.809 x 10⁻³ mm2/sec was generated
having a sensitivity of 72.2% and specificity of 75%. The PPV generated
was 86.6% and NPV 54.4%. Therefore, although the sensitivity and
specificity of ADC values is relatively low, this test has a high positive
predictive value for benign lesions having ADC value of > 0.809 x
10-3 mm2/sec. A significantly low ADC value (0.656 x 10⁻³ mm2/
sec) was seen in a benign lesion which was proven to be meningioma
on histopathology, which can be explained by the high cellularity of
meningiomas.
DCE-MRI assesses the nature of the enhancement of the lesion
against time which helps in evaluating the microcirculation of the
lesion [6,13]. Xian et al. performed DCE-MRI on orbital lesions
and concluded that a washout type TIC was the most predictive for
malignancy [3]. A Study was done by Yuan et al. that all the lesions
with a persistent pattern of enhancement (type I) curve turned out to
be benign and 10 out of 14 lesions were showing type III curve were
malignant [13]. Malignant lesions were found to have statistically
higher Out of all the parameters, highest sensitivity (93.8%) was
provided by Slope when the cut off value used was 1.10 while highest
specificity (87.5%). was provided by a cut off value of 35.14 secs for
Tp
We found significant difference between type I and type III curves
(p value ~0.002). All lesions demonstrating type I curve were benign
(eight) and seven benign lesions also demonstrated type II curve. This
can be attributed to the fact that benign lesions generally have an
intact microvasculature which has limited permeability.
Tp was the most optimal with the value of 0.96 with the
highest specificity of 87.5% (with a cut off value of 141.5 secs). The
corresponding sensitivity generated was 94.4%, PPV was 94.7% and
NPV 87.5%. This signifies a high diagnostic accuracy of this test to
differentiate benign and malignant orbital masses. The maximum
sensitivity (100%) was obtained from slope with a cut off value of 0.47,
however the corresponding specificity was relatively low (78%). The
corresponding PPV and NPV were 66.6% and 100%. Values may also
differ from previous studies as the values are calculated by drawing
ROIs, the method of which can be different for different studies.
MRS has been shown to be useful to distinguish pure tumors
from spectroscopically normal tissues [14,15]. Roshdy et al. showed
choline peak in all (100%) patients with malignancy, and also in 14%
of benign lesions, both of which were found to be optic nerve glioma
[16]. In our study kappa test of agreement was applied to correlate
MRS with histopathological diagnosis and the K value generated
for choline peak was 0.612 which denotes a good level of agreement
between spectroscopy and histopathology. The sensitivity of this test
was low (62.5%) however specificity was 94.4% and the test had high
PPV and NPV which suggests that presence of a choline peak was a
significant sign of malignancy. The major limitation of MRS in orbit is the presence of blood, bone and fat surrounding the lesion which
may lead to artefacts which was mitigated by taking single voxel
spectroscopy in smaller lesions and chemical shift imaging in larger
lesions. For a diagnostic test to accurately diagnose malignant lesions,
the specificity should be 100% which was only attained by MRS. (Tp
had the next highest specificity of 87.5%). All the three modalities can
be used complementary to each other in addition to the conventional
sequences to increase the confidence of diagnosing malignant lesions
and help to plan treatment.
One of the major limitations of our study is the small sample size
which did not allow us to differentiate between the specific subtypes
of malignant lesion. Another limitation is the use of ROIs in all the
three sequences which are user dependent. However this limitation
was mitigated in our study by taking multiple ROIs of fixed areas
and taking mean values as the standard value. Further studies using
a larger population group may be needed to establish the usefulness
of these sequences in orbital masses and to differentiate different
subtypes of masses.
Conclusion
Diffusion-weighted MRI using ADC (mean) can be used to
differentiate between benign and malignant orbital masses. Out of
the DCE parameters, only Time intensity curve, time to peak and
Slope are useful in differentiating benign and malignant masses
with Tp having high specificity and Slope having a high sensitivity.
Choline peak in spectroscopy shows high agreement with malignancy
on histopathology. Combining these three sequences increases the
confidence of predicting malignancy in an orbital lesion
References
Citation
Bansal A, Kumar A, Bhatia V, Singh U, Ahuja CK, et al. Utility of Advance MR Imaging in Differentiation of Benign and Malignant Orbital Masses. Indian J Appl Radiol. 2021;7(1): 168.