Research Article
A Comprehensive Evaluation of High-Resolution Computed Tomography (HRCT) Imaging Patterns in COVID-19 Pneumonia According to the Time Course of the Disease and Across Different Age Groups in Indian Population
Ramesh Parate1, Maherafsha Hundekari1*, Aarti Anand1, Tilottama Parate2 and Farhan Ansari3
1Department of Radiology, Government Medical College Nagpur, India
2Department of Medicine, Indira Gandhi Government Medical College, Nagpur, India
3Department of Neurology, NIMHANS, Bangalore, India
*Corresponding author: Dr. Maherafsha Hundekari, Junior Resident, Department of Radiology,Government
Medical College Nagpur,Hanuman Nagar-440024, Nagpur, India, Tel: 7798100399 E-mail: maherafsha@gmail.
com
Copyright: © 2021 Parate R, et al. This is an open access article distributed under the Creative Commons Attribution License,
which permits unrestricted use, distribution, and reproduction in any medium, provided the original work is properly cited.
Article Information: Submission: 22/02/2021; Accepted: 27/05/2021; Published: 31/05/2021
Abstract
Objectives: To elucidate the chest HRCT imaging manifestations in coronavirus (COVID-19) infected Indian patients, study and compare the patterns
identified during time course and among differently aged patients.
Materials and Methods: A retrospective observational study of 500 laboratory-confirmed SARS-CoV-2 infected patients was performed. The patients
were categorized into 3 groups based on the time interval between onset of symptom and HRCT imaging and according to their age. The distribution, patterns,
and extent of lung abnormalities were recorded.
Results: A predominant peripheral distribution of the abnormalities was observed as in 262/390 patients (67.2%). The Mean CT score of the right lower
lobe (2.06 ± 1.13) and left lower lobe (2.01 ± 1.128) were significantly greater than other lung lobes (P-value < 0.001). Overall, most commonly observed
pattern on imaging was crazy-paving pattern observed in 329/390 patients (84.4%). In the early phase of the disease (0-7 days), predominant patterns were
crazy-paving (90.7%) and GGO with consolidation (50.4%). The consolidation pattern and the vacuolar sign showed a significant rise during advanced phase
of the disease (8-14 days of symptom onset) and eventually decreased during the absorption phase (> 14 days after symptom onset). The reticular pattern,
subpleural line sign were the dominant patterns observed during the absorption phase. The Mean total CT severity score (9.79 ± 4.79) was greatest for group
C patients: age ≥ 45 years. (P-value < 0.001). GGO with consolidations was more common in group B (25-44 years) and C, whereas GGO plus reticulations
and reticular pattern were more common in group C (P-value < 0.001).
Conclusion: HRCT features of COVID-19 pneumonia vary according to the disease course and the patient’s age. Crazy-paving pattern is dominant
during the early phase and repairing signs during the absorption phase. The extent and pattern of involvement are more severe in the elderly population.
Keywords
COVID- 19; Coronavirus disease 2019; SARS- CoV-2; Severe acute respiratory syndrome coronavirus 2; CT, Computed Tomography;
HRCT, High resolution computed tomography; RT-PCR, Reversetranscriptase-polymerase chain reaction
Introduction
The outbreak of COVID- 19 originated in Wuhan, China, began
in December 2019, and has been continuing since then. As of 21st
November 2020, more than 56,982,476 confirmed SARS- CoV-2
cases along with 1,361,847 deaths have been reported globally by the
World Health Organization (WHO) [1]. Amongst these, more than 9
million cases have been reported in India [2]. At present confirmation
of COVID -19 infection is done by a specific viral nucleic acid assay
using reverse transcription-polymerase chain reaction (RT-PCR) on
sputum, nasopharyngeal/oropharyngeal swabs and other specimens
[3]. However, as per the recent literature, some patients with COVID-
19 infections might show initial negative nucleic acid assay results [4].
The various reasons for a negative test could be insufficient cellular
material for detection and improper extraction of nucleic acid from
clinical materials [5]. Therefore Chest HRCT has higher sensitivity
for the diagnosis of COVID- 19 pneumonia and presently HRCT has
been used as one of the most important tools for a comprehensive
evaluation and follow-up especially in epidemic areas [6].
In this study, we analyzed the HRCT lung manifestations in 500
infected patients and compared the HRCT patterns identified during
the disease course and among differently aged patients.
Materials and Methods
Study Population and Design:
This was a retrospective observational study approved by the
ethical committee of our institute and the requirement of written
informed consent was waived. It was conducted between August 15
to October 15, 2020, in our dedicated Covid hospital. Symptomatic
COVID-19 infected patients were screened using the following
criteria.The inclusion criteria:
a. At least one positive RT-PCR for SARS- CoV-2 obtained with
nasopharyngeal/oropharyngeal swabs.
b. At least one HRCT scan done per patient as and when
requisition received from the clinicians.The exclusion criteria:
a. Patients with RT-PCR test negative results.
b. Asymptomatic patients.
c. Technical errors within the HRCT scan.
d. Antenatal patients.Thus, about 500 patients were included in the study. 308/500
(61.6%) were male; mean age - 43.25 years, range: 17-87 years and
192/500 (38.4%) were female; mean age - 40.76 years; range: 11-91
years. Based on age distribution: Group A: < 25 years, n= 46 (9.2%);
Group B: 25-44 years, n= 236 (47.2%); Group C: ≥45 years, n=
218 (43.6%). The clinical, demographic and imaging data of all the
patients were recorded.
Sub-stratification of the patients:
The patients were clustered
into 3 groups based on the number of days between the onset of the
symptoms and the HRCT scan (course of the disease):a. The early phase: 0- 7 days after the symptom onset.
b. The advanced phase: 8-14 days after the symptom onset.
c. The absorption phase: > 14 days after the symptom onset.
HRCT acquisition protocol: All HRCT scans were performed
on a 128 slice SIEMENS CT scanner. Patients were examined in
supine position and image acquired during a single inspiratory
breath-hold. The scanning range extended from the apex of lung up
to the adrenal glands. Following were the scanning parameters: X-ray
Tube parameters- 140 KVp; 234mAs; rotation time - 0.5 s; pitch -
1.0; section thickness- 5mm; intersection space- 5 mm; additional
reconstruction using the B80f ultra-sharp kernel and a slice thickness
of 1 mm. Lung window setting was with a window level of -600
Hounsfield units (HU) and window width of 1500 HU. Appropriate
infection and control measures were implemented.
HRCT image analysis: Two senior radiologists with 10-15 years
of experience in thoracic radiology evaluated the scanned images
on the console using multiplanar reconstruction tools. The patterns
observed were classified into 3 major categories: lung, bronchial and
pleural changes. These categories were further classified into the
following subcategories:
Lung changes [7]:
a. GGO- Ground glass opacities: increased attenuation without
obscuration of the underlying vessels.
b. Consolidation: Homogenous increased intensity of lung
parenchyma with obscuration of underlying vessels.
c. Crazy-paving pattern: GGO with an interlobular and
intralobular septal thickening.
d. Reticular pattern: a disordered arrangement of coarse linear or
curvilinear opacities.
e. GGO with Consolidation.
f. GGO plus Reticulations.
g. Vacuolar sign: A transparent vacuole like a shadow of < 5 mm
in length observed within the lesion.
h. Halo sign: area of consolidation surrounded by GGO.
i. Reverse halo sign: area of GGO surrounded by consolidation
j. Microvascular dilation sign: dilated small vessels within the
lesion.
k. Subpleural line: an arc-shaped linear shadow 2-5 cm in length
appearing parallel to the chest wall.
l. Subpleural transparent line: a thin transparent line lying
between the lesions and the visceral pleura.Bronchial changes:
a. Air bronchogram: an air-filled image of bronchus in lung
lesions.
b. Bronchiectasis.Pleural changes:
a. Pleural thickening.
b. Pleural retraction: lesions pulling off the visceral pleura.
c. Pleural effusion.
d. Miscellaneous changes: Mediastinal lymphadenopathy,
cavitation, calcifications, tree-in-bud appearance (centrilobular
nodules with a linear branching pattern).The horizontal distribution of pulmonary lesion was noted as
peripheral: involving mainly the peripheral one-third of the lung or
central plus peripheral. The area of involvement was categorized as
predominant anterior or posterior involvement (the area before or
after the vertical line of the midpoint of the diaphragm in the sagittal
position respectively). The number of lesions was noted as single or
multiple (>1) lesions, the size of the lesion was accounted as: < 1 cm,
1-3 cm, and >3 cm.
A semi-quantitative CT severity scoring was used to evaluate the
extent of lung involvement and was recorded for each of the 5 lobes
based on anatomic involvement, as follows: 0, no involvement; 1,
< 5% involvement; 2, 5-25% involvement; 3, 26-50% involvement; 4,
51-75% involvement; and 5, > 75% involvement. The total CT score
was the sum of each lobar score: 0 to 25 [8].
Statistical analysis:
Statistical analyses were performed using SPSS version 19.0.
Continuous variables were expressed as Mean ± Standard Deviation,
Numerical data were expressed as a percentage (%) of the total.
The incidence of various HRCT characteristics, lesion distribution,
predominant lung area involved was expressed as frequency (%)
and compared using the Pearson Chi-Square test between the early,
advanced and absorption stage as well as between the age groups.
We used one-way ANOVA analysis of variance (post hoc multiple
comparisons) to do pairwise comparisons for CT severity score as
well as for the patterns found among the age groups. The difference
was statistically significant with a P-value < 0.05.Results
Demographic and clinical findings:
Table 1 summarizes demographic and clinical data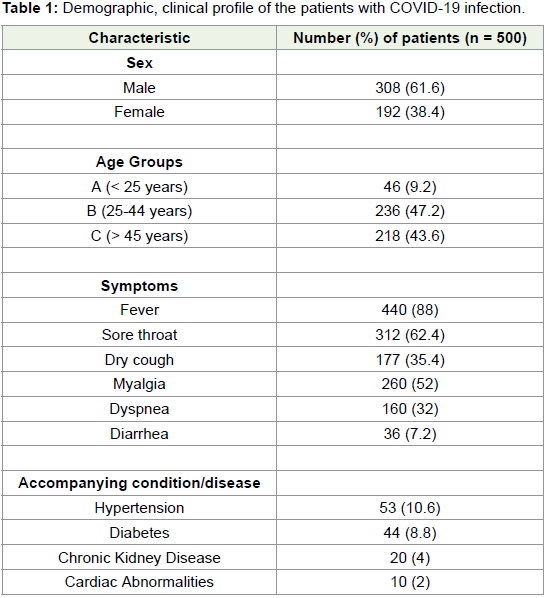
HRCT findings: Out of 500 patients, parenchymal abnormalities
were observed in 390 (78%) cases, while 110 (22%) cases had a normal
scan. A significantly predominant peripheral distribution of the
abnormalities was observed in 262/390 patients (67.2%), while central
plus peripheral involvement was seen in 128/390 cases (32.8%)
(P-value <0.001). A higher frequency of predominant posterior
involvement (311/390) of the lung area compared to the predominant
anterior involvement (79/390) was noted (P-value<0.001) (Fig 1). The
mean CT score of the right lung was 4.74 ± 2.89, higher than the left
lung (3.55 ± 2.05) (P-value<0.001). Among the lobes, the mean CT
score of right lower lobe and left lower lobe were 2.06 ± 1.13 and 2.01
± 1.128, significantly greater than the other lobes (P-value < 0.001),
however, not much difference was noted between the scores of right
lower lobe and left lower lobe (P-value=0.154) (Table 2).
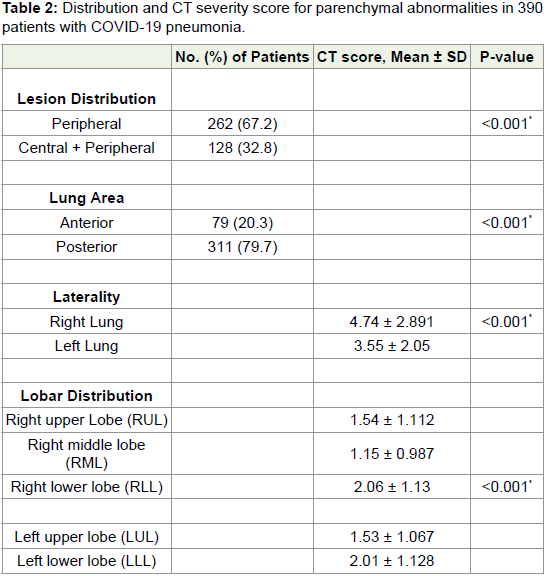
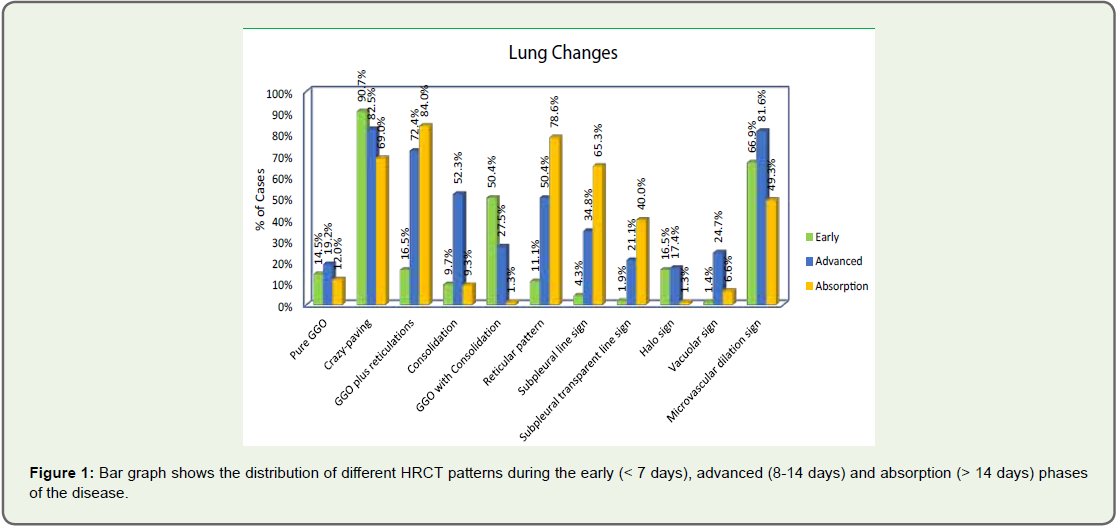
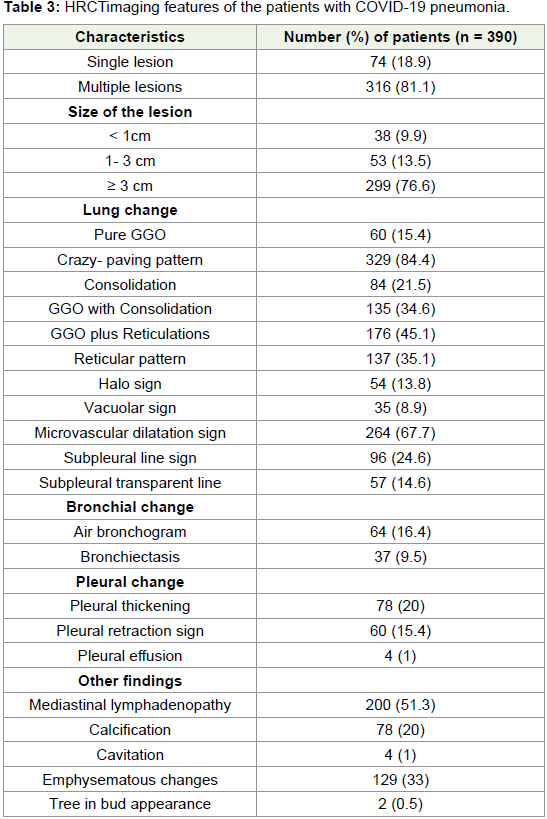
Table 3 shows the detailed evaluation of various HRCT
characteristics. The most common parenchymal abnormality
was the crazy-paving pattern observed in 329/390 cases (84.4%).
Other common patterns observed were pure GGO (60/390;15.4%);
Consolidation (84/390;21.5%); GGO with consolidation
(135/390;34.6%); GGO plus reticulations (176/390;45.1%);
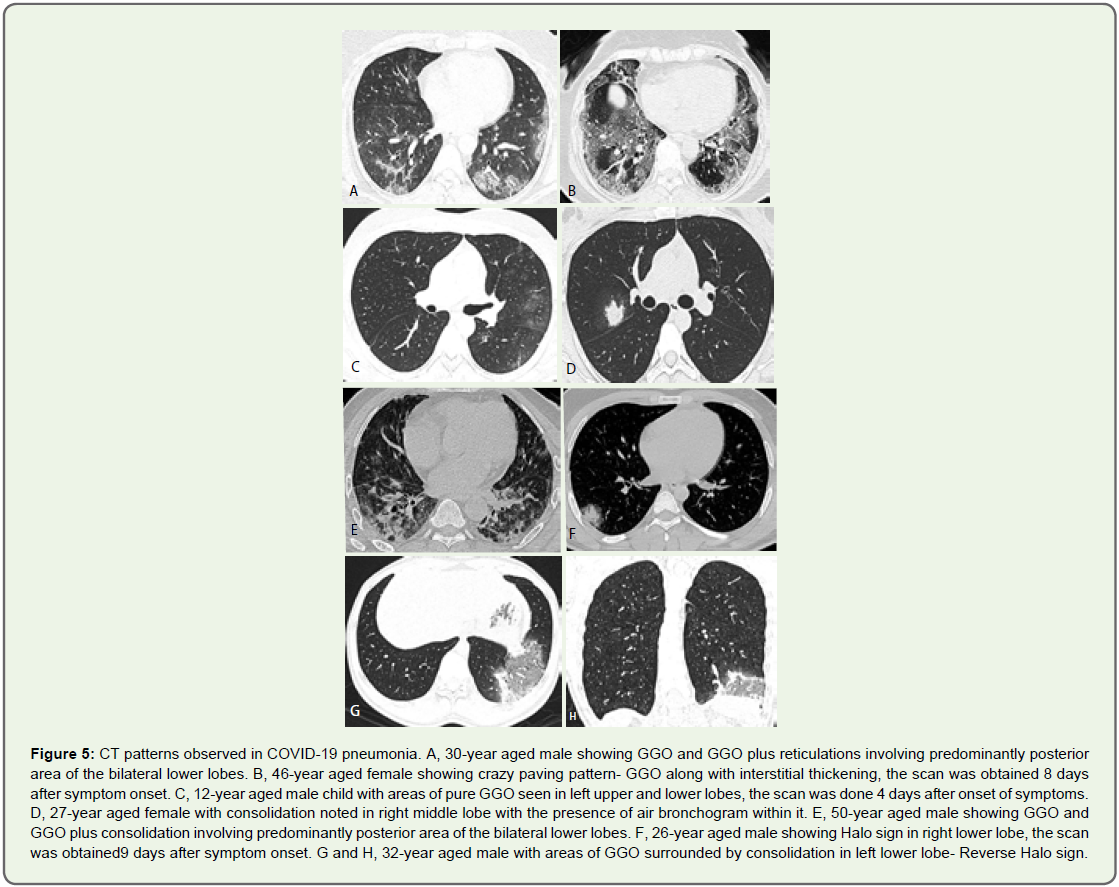
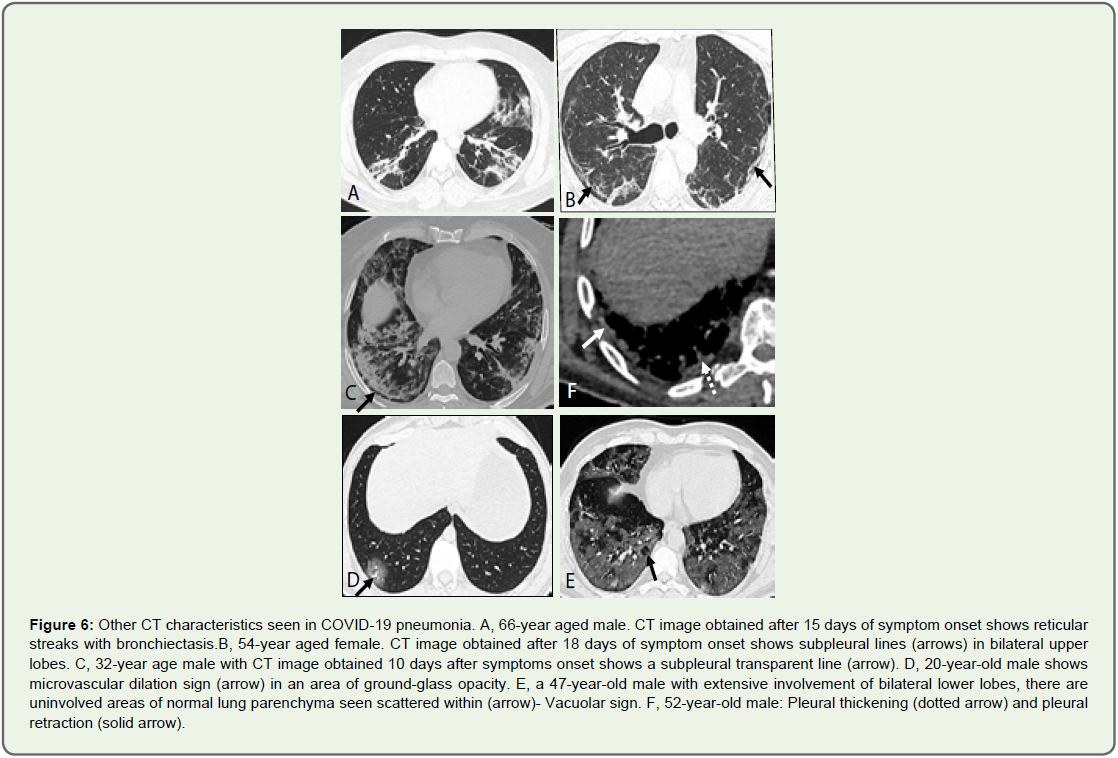
Reticular pattern (137/390;35.1%) and micro vascular dilation sign (264/390;67.7%) (Figure 2 and 3). Other patterns seen were Subpleural
line sign (96/390;24.6%), Vacuolar sign (35/390;8.9%); Halo sign
(54/390;13.8%) and Subpleural transparent line (57/390;14.6%). The
patterns observed here are similar to those mentioned in previously
conducted studies [9,10]. Some characteristics observed in our
study were Reverse halo sign in 2/390 (<1%), cavitation in 4/390
(1%) and tree in bud appearance noted in 2/390 (<1%). Regarding
bronchial changes, 64 patients (16.4%) showed air bronchogram sign
and 37 patients (9.5%) showed bronchiectasis. The pleural changes
noted were pleural thickening (78/390;20%), pleural retraction sign
(60/390;15.3%) and pleural effusion (4/390;1%).
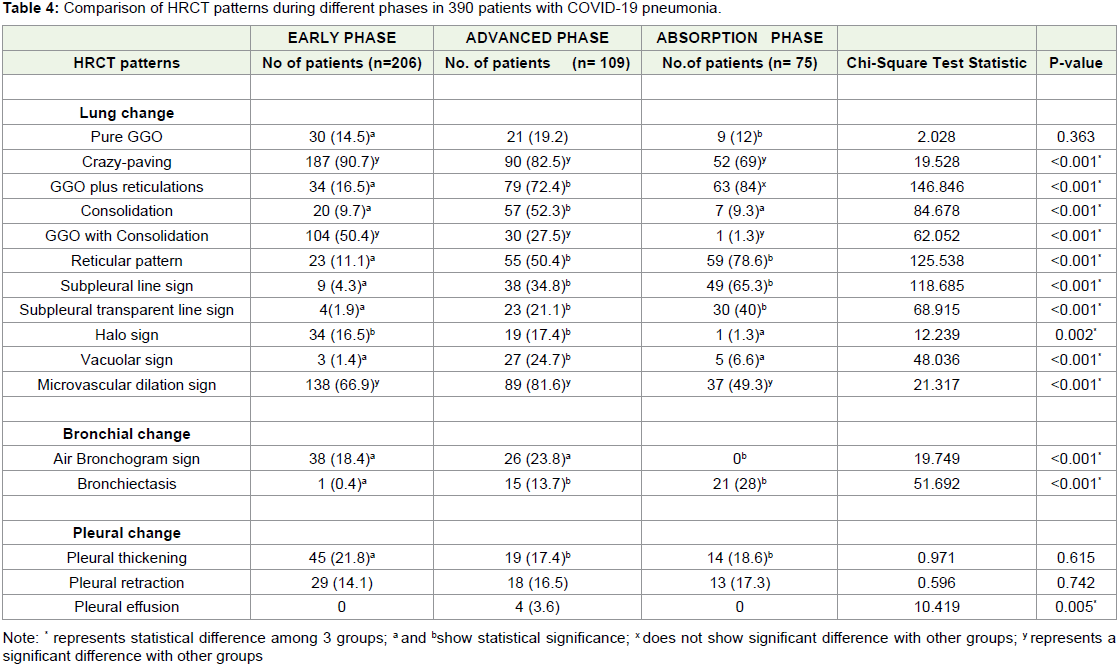
As per a preliminary COVID-9 pneumonia imaging diagnostic
guide in China [11], we categorized the HRCT images into an early
stage (≤ 7 days), advanced stage (8-14 days) and absorption stage (>
14 days) according to the disease course and compared each of the
density characters among each phase (Table 4 and Figure 4). The
predominant patterns in the early phase of the disease (≤ 7 days) were
crazy-paving (187/206; 90.7%) and GGO with consolidation patterns
(104/206; 50.4%) which were more common when compared to the
absorption and advanced phases (P value<0.001). The consolidation
pattern showed a significant increase during the advanced phase
(57/109; 52.3%) as compared to the early phase (20/206;9.7%) (P-value
< 0.001), furthermore, it decreased during the absorption phase
(7/75;9.3%) (P-value < 0.001), however, no significant difference was seen between the early and absorption phase concerning this pattern
(P-value=0.011). The vacuolar sign showed a significant rise during
the advanced phase with a frequency of 27/82 (24.7%) when compared
to the early and absorption phases (P-value<0.001). The GGO plus
reticulations showed an increasing trend during the advanced and
absorption phase as compared to early phase (P-value=<0.001 and
0.002 respectively). The reticular pattern, subpleural line sign and
bronchiectasis showed increasing trends, highest frequency observed
in the absorption phase (P-value<0.001). Not much difference was
seen regarding the distribution of the following patterns: pure GGO
(P=0.363), pleural thickening (P=0.615) and pleural retraction sign
(P=0.742).
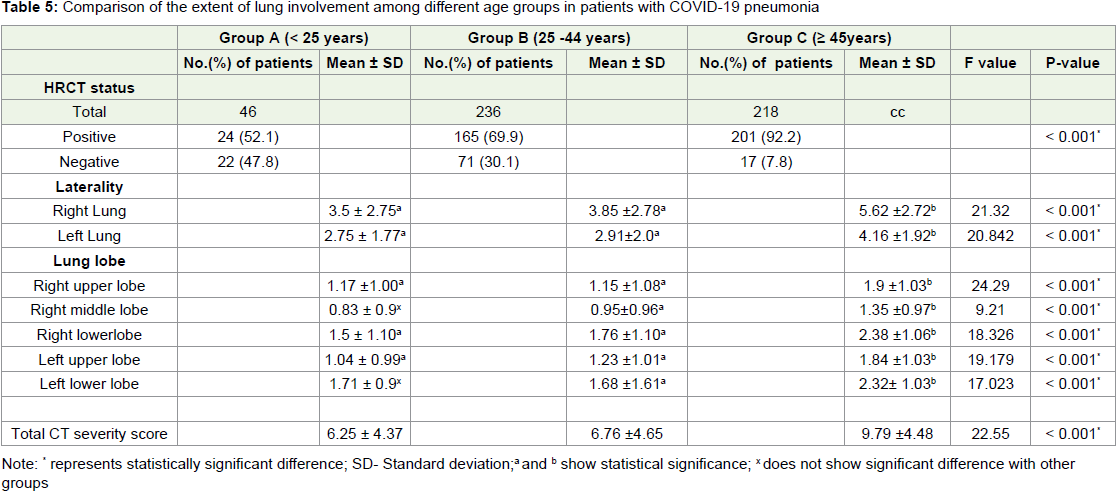
Furthermore, we compared the various parameters among the
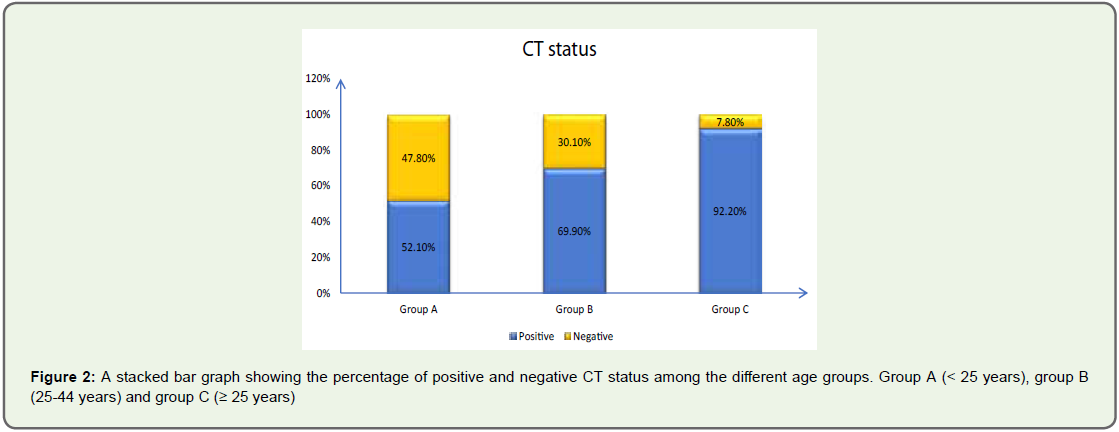
age groups as illustrated in Table 5. The positivity rate for abnormal
scan for group B (165/236;69.9%) and C cases (201/218;92.2%)
was significantly greater than the group A cases (24/46;52.1%)
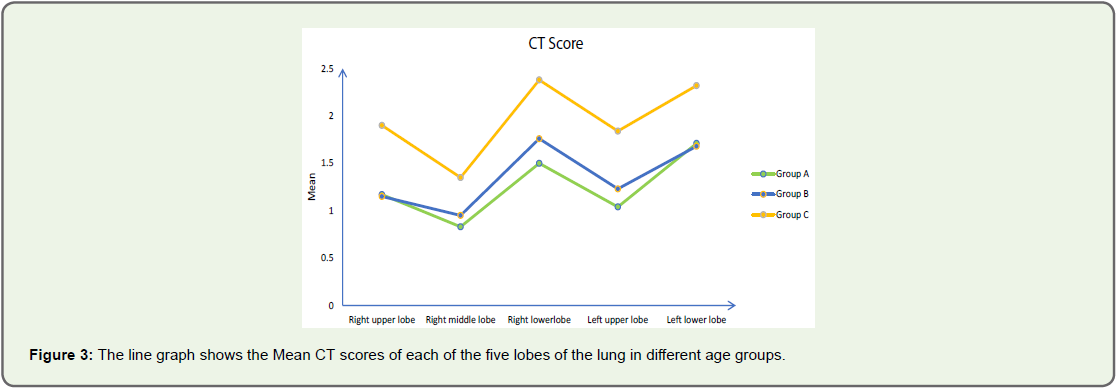
(P-value<0.001) (Figure 5). Overall, the mean CT score of each of
the lung lobe was greatest in group C (P-value<0.001) (Figure 6).
The total mean CT score was greater for group B and group C when
compared to group A (F=22.550; P<0.001).
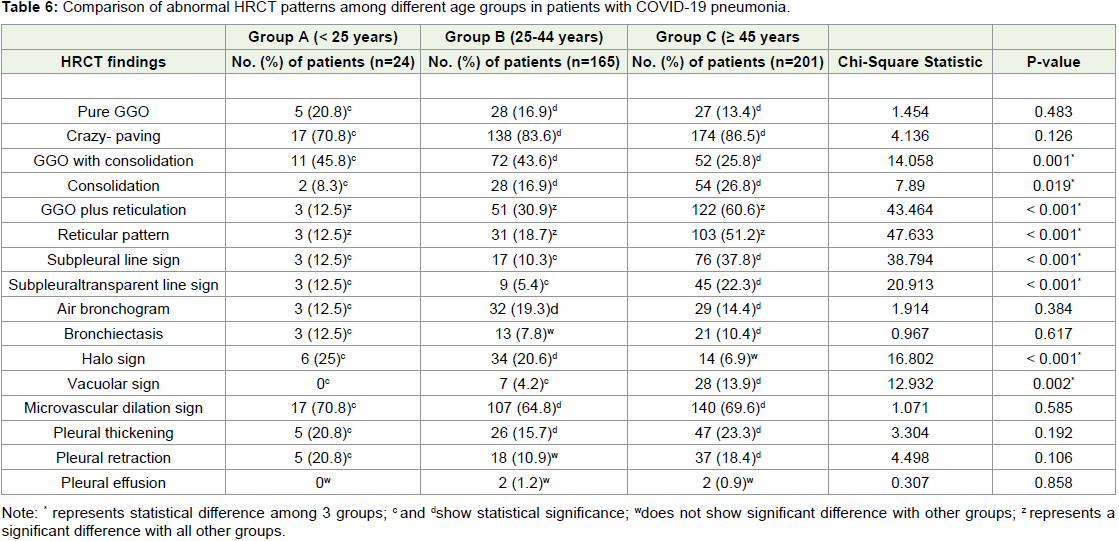
No significant difference was observed for the pure GGO and
crazy-paving patterns among the age groups (P=0.483; P=0.126).
The predominant patterns observed in group C were GGO plus reticulations and reticular pattern, greater than the group A and
group B cases (P<0.001). GGO with consolidation and consolidation
patterns were more common in group B and C than in group A
(P<0.001), without much difference, observed between group B and
C (P>0.005). The relative representation of the following patterns:
subpleural line sign, subpleural transparent line and vacuolar
sign were more common in groups C as compared to group A
and B (P<0.001). Further, no significant difference was observed
for microvascular dilation sign (P=0.585), air bronchogram sign
(P=0.384), bronchiectasis (P=0.617), pleural thickening (P=0.192),
and the pleural retraction sign (P=0.106) among the age groups. Table 6 compares various HRCT patterns among different age groups.
Discussion
The COVID-19 pandemic has hit hard on the globe. Just as
clinicians are evaluating more patients suspected of having the
infection, radiologists are similarly interpreting more chest scans in
those suspected of having COVID-19 pneumonia. It is also known
that asymptomatic patients can have a positive chest HRCT with
the converse also being true [12]. Moreover, considering the limited
number of RT-PCR kits in some centres of the developing countries,
with the added possibility of getting large false negative RT-PCR results, solely relying on the laboratory tests for confirmation of the
diagnosis could not be helpful. According to A rapid advance guide
- Use of chest imaging in COVID-19, published by World Health
Organization [WHO] [13], Chest imaging could be included as a
part of the diagnostic workup of patients with suspected/probable
COVID-19 infection in settings where the laboratory testing is not
available or results are delayed or are initially negative in the presence
of symptoms attributable to COVID-19. Moreover, the sensitivity
of HRCT imaging is more as compared to the chest radiography as
evaluated by some studies. In another literature review, the value
and roles of different imaging modalities for the diagnosis and
management of COVID-19, Chest radiography and HRCT scan were
considered as key diagnostic modalities in suspected cases. With
chest radiography having limited sensitivity for COVID-19 in the
early stage of the disease, HRCT scan could be more accurate and
sensitive in identifying pneumonia, especially during the early stages
[14,15].
We conducted this retrospective study to study the spectrum
of imaging characteristics. A positive HRCT rate was observed in a
high proportion, 390/500 (78%) of RT-PCR confirmed symptomatic
patients.
In a study conducted by Fang. Y et.al describing the CT image
visual quantitative evaluation and clinical classification of COVID-19,
71.8 % symptomatic confirmed cases had CT evidence of pneumonia
Zhan. J et.al reviewed CT scans of 110 patients describing CT pattern
of evolution of COVID-19 pneumonia and reported an overall
rate of 8.1 % negative scans [16,17]. Similarly, Liu. X et al. found a
pooled positive CT rate of 89.7% cases among 2378 COVID-19 cases
in a meta-analysis which included a total of 13 studies [18]. Thus,
a comparable positive rate in this study could reflect the possible
similar course of disease in Indian population as well as the fact that
this study included only symptomatic positive patients; also 43.6%
of cases belong to the age group ≥ 45 years. Some studies conducted
in past have shown that the high proportion of elder age group (≥ 45
years) contributes towards a high positive rate [19].
We found higher mean CT score for right lung (4.74±2.89) than
the left lung (3.55±2.05), with right lower lobe having highest mean
score than the other lobes, a finding consistent with studies conducted
previously [20]. The basis for this is, the bronchus of right lower lobe
is more straighter, steep and is in continuation with the trachea.
About 67.7% cases had a distribution of the lesions in the peripheral
two-thirds of the lung and in 79.7% cases; posterior area of lungs was
involved. The predominant patterns of lung opacities were crazy paving
pattern (84.4%), GGO with consolidation (34.6%) and GGO
plus reticulations (45.1%), findings consistent with several studies as
in a meta-analysis conducted by Bao et al. [18]. The microvascular
dilation sign was accounted in 67.69 % cases. The various theories
put forward regarding its etiology are disordered vasoregulation [21],
pro-inflammatory cytokines induced vasodilation, alveolar-capillary
microthrombi and infection-induced pulmonary vasculitis [22]. Lang
et, al. even proposed that this disordered vasoregulation could be an
early marker of ARDS onset even before the clinical symptoms and
abnormal appearance on imaging [21].
When we compared the lung opacities among different phases, we observed that during the early phase, the dominant patterns were
crazy paving and GGO with consolidation. In early stages, the virus
is likely to attack peripheral vessels and bronchi to cause an increase
in the intraductal pressure which results in exudation, manifested as
subpleural pure GGO. Over time, crazy-paving sign is formed due
to thickening of the interlobular septum and increased exudation
of the alveolus. If the disease continues to progress, the thickened
lobular septum limits the absorption of the alveolar exudation,
resulting in the alveolar consolidation formation. We observed that
the consolidation, GGO plus reticulations and vacuolar sign were
the predominant patterns in the advanced phase. Thus, the advanced
phase could be described as a phase manifesting the combination
of aggravation of the ongoing abnormalities along with initiation
of repair changes within the parenchyma. This inhomogeneous involvement is evident by the vacuolar sign which is predominant
during this phase. The absorption phase showed a predominance of
the reticular pattern, subpleural line sign and subpleural transparent
line sign which could be regarded as the repairing signs [10,23]. All
the observed lesions could be eventually seen absorbing into irregular
linear streaky opacities.
Furthermore, we noticed diversified patterns among different
age groups of patients. Younger population < 25 years of age had a
lesser extent of involvement than those above 45 years of age. This
was supported by the fact that the mean total CT score of group C
cases was significantly greater than group A cases. The patterns
more commonly seen in elderly population included the GGO plus
reticulations, reticular pattern, bronchiectasis and subpleural line
sign. Deterioration of the lung structure and function along with a
weaker immune system of the geriatrics could be the responsible factor
for these patterns. Pleural thickening was mainly caused by the direct
spread of the lesion, lymphatic reflux, and pleural inflammation. This
may indicate that elderly patients show a more severe inflammatory
response. At the same time, in elderly patients, whole lung lobes were
more likely to be involved. This may indicate that in the same disease
course, disease progression in elderly patients was faster than that in
young patients [24,25].
Thus, our results fairly corroborate the distribution and types of
pulmonary opacities reported in COVID-19 pneumonia worldwide.
Also, the study findings are likely to help in understanding and
evaluating the imaging abnormalities of cases during time course as
well as depending upon the age and pattern of the patients. This could
be a valuable tool in determining the treatment strategies as well as
predicting prognosis of the disease. Therefore, it is essential to make
full use of chest HRCT to achieve a comprehensive diagnosis and
guide treatment for patients with COVID-19 infection.
But at the same time, it is pertinent to restrict the use of CT during the pandemic. Owing to the greater radiation dose of CT and
the increased frequency of scans done presently, there is a growing
concern regarding its long-term effects on the human body such as
cancer, sterility, hematologic depression, etc. [26], thus it is of great
importance to limit the number of scans done per person. Studies
have shown that after the initial CT which is usually done after 5 days
of symptom onset, appropriate follow-up time for subsequent chest
scans should be during second week (approximately 12-14 days after
symptoms onset) to look for disease progression and during fourth fifth
week to see for disease resolution [27]. Also, additional chest
scans can be done when the patient shows acute exacerbation of the
symptoms or deterioration and when the chest radiograph obtained
is non-conclusive.
This study had many limitations. Firstly, only RT-PCR positive
symptomatic cases were included in the study, this may have
overruled the fact that many asymptomatic and RT-PCR negative
yet infected cases were not evaluated which could have resulted in
bias. Also, patterns like reticulations and bronchiectasis need further
follow-up to note whether the fibrosis seen in COVID-19 is reversible
or irreversible. Finally, no lung biopsies were performed to assess the
correlation between radiological and histopathologic findings.
In summary, HRCT features of COVID-19 pneumonia vary
according to the disease course and the patient’s age. Crazy-paving
pattern is dominant during the early phase and repairing signs during
the absorption phase. The extent and pattern of involvement are more
severe among the elderly population.
Acknowledgements
We express our gratitude to the Department of Radiology,
Government Medical College Nagpur, Dr Ashwini Lahoti, Dr Pooja
Raut and Dr Shivani Muppidwar for their support in providing
necessary assistance in the recording of clinical and demographic
data, and Mr Raghavendra Rao C. for helping in statistical analyses.
References
Citation
Parate R, Hundekari M, Anand A, Parate T, Ansari F. A Comprehensive Evaluation of High-Resolution Computed Tomography (HRCT)
Imaging Patterns in COVID-19 Pneumonia According to the Time Course of the Disease and Across Different Age Groups in Indian Population.
Indian J Appl Radiol. 2021;7(1): 162.