Research Article
A Comparative Study of the Temporal Changes of CT Findings in Younger and Older Adults with COVID-19 Pneumonia
Anand A, Rathod J, Hundekari M*, Disawal A, Jaybhay S and Deshmukh M
Department of Radiology, Government Medical College, Nagpur, India
*Corresponding author: Hundekari M, Junior Resident, Department of Radiology, Government Medical College Nagpur, Hanuman Nagar-440024, Nagpur, India, Tel: 7798100399; E-mail: maherafsha@gmail.com
Copyright: © 2021 Anand A, et al. This is an open access article distributed under the Creative Commons Attribution License, which permits unrestricted use, distribution, and reproduction in any medium, provided the original work is properly cited.
Article Information: Submission: 29/12/2020; Accepted: 16/02/2021; Published: 19/02/2021
Abstract
Objectives: To compare the temporal lung changes in Coronavirus Disease 2019 (COVID-19) pneumonia in younger (< 40 years) and older (≥ 40 years) adults and determine appropriate Computed Tomographic (CT) follow-up time.
Materials and methods: The chest CT images of 100 laboratory-confirmed SARS-CoV-2 infected patients were analyzed retrospectively, including 43 younger patients (27.95 ± 4.95 years) and 57 older patients (59.6 ± 10.71 years). The CT score and major CT findings were evaluated.
Results: An abnormal (positive) CT status in 33/43 (76.7%) of younger patients and 51/57 (89.5%) of older patients was recorded, when the initial CT
was done at 4.88 ± 2.22 days and 5.75 ± 1.97 days respectively. On the initial scans, pure Ground-Glass Opacities (GGO) and crazy-paving patterns were
common. On subsequent follow-up scans, the GGO plus reticulations, reticular pattern and pleural thickening were more commonly seen with significantly
higher frequency in older patients. The mean total CT severity score in older patients was greater for initial as well as subsequent follow-up scans (all
P<0.001). For the younger patients, the CT score reached a peak at 12 days and nadir at 30 days after symptom onset, while in older patients the peak CT
score was reached at 14 days and lowest CT score was reached at 37 days.
Conclusion: The disease appeared to be milder in the younger population. The elderly patients are more likely to have extensive lung lobe involvement, interstitial and reticular changes, and pleural thickening. The appropriate follow-up time of CT scans is during the second week (approximately 12 days for younger patients and approximately 14 days for older patients) and after the fifth week (approximately 30 days for younger patients and approximately 37 days for older patients).
Keywords
COVID- 19; Coronavirus disease 2019; CT; Computed Tomography; Pneumonia; Follow-up
Introduction
As of December 8, 2020, a total of 6,72,10,778 confirmed COVID-19 cases, including 15,40,777 deaths have been reported worldwide to the World Health Organization (WHO) [1]. Amongst these, India has reported a total of 97,27,225 confirmed cases and about 1,42,388 deaths [2].
With the gradual recognition of COVID-19 pneumonia, professional consensus, guidelines, and criteria have steadily been established to facilitate diagnosis and treatment [3]. The diagnosis of COVID-19 is currently confirmed by identification of viral RNA in Reverse Transcriptase-Polymerase Reaction (RT-PCR). The specificity of most of the RT-PCR test results is theoretically 100% because the primer design is specific to the genome sequence of SARS-CoV-2. However, occasional false-positive results may occur owing to technical errors and reagent contamination. Furthermore, it should be realized that a positive RT-PCR test result reflects only the
detection of viral RNA and does not necessarily indicate the presence of viable virus [4]. Another disadvantage of the RT-PCR test is that it takes some time before results are available, with estimated testing times ranging from 50 minutes to 4 hours for semiautomated to fully automated, walk-away assays and 6-14 hours for manually performed assays [5].
On the other hand, many previously conducted studies have demonstrated CT having higher sensitivity (> 95%) as compared to RT-PCR results (60-70%) [6,7].
A recent meta-analysis also reported a chest CT pooled
sensitivity of 94.6% and a pooled specificity of 46.0% in the detection
of COVID-19 [8], hence CT has become an important tool for
COVID-19 pneumonia screening, comprehensive evaluation and
follow-up. But owing to the greater radiation dose of CT and the
increased frequency of scans done presently, there is a growing
concern regarding its long term effects on the human body such as
cancer [9], thus it is of great importance to limit the number of scans
done per person.
Furthermore, the disease course is found to be more severe
with poorer prognosis in older adults [10]. Thus, we retrospectively
analyzed the initial and follow-up CT scans of 100 RT-PCR confirmed
COVID-19 cases to study and compare the imaging features and
temporal evolution of the disease among young (< 40 years) and older
adults (≥ 40 years)and to determine the appropriate CT follow-up
time.
Materials and Methods
Patients and chest CT:
This was a retrospective observational study approved by the
ethical committee of our institute and the requirement of written
informed consent was waived. Symptomatic COVID-19 infected
patients between August 15 to October 15, 2020, were screened using
the following criteria.a. At least one positive RT-PCR for SARS- CoV-2 obtained with
nasopharyngeal/oropharyngeal swabs.
b. Cases should have undergone ≥ 1 CT scan, the selection
criteria for the follow-up scan were if the patient’s symptoms
changed or progressed.
Thus, about 100 patients were included in the study and they were
stratified into two groups based on the age: Group A (< 40 years) and
group B (≥ 40 years).
All patients were imaged using a multidetector 128 slice SIEMENS
CT scanner. Following were the scanning parameters: X-ray Tube
parameters- 140 KVp; 234 mAs; rotation time - 0.5 s; pitch - 1.0;
section thickness- 5 mm; intersection space- 5 mm; additional
reconstruction using the B80f ultra-sharp kernel and a slice thickness
of 1 mm.
The clinical, demographic and imaging data of all the patients
were recorded and various parameters were compared between these
age groups.
CT image analysis:
Two senior radiologists with 15- 20 years of experience in
thoracic radiology evaluated the scanned images on the console
using multiplanar reconstruction tools. Imaging was reviewed
independently and a final decision was reached by consensus.
The initial and follow-up CT images were assessed for following
characteristics as per the Fleischner Society Glossary [11], such as pure Ground-Glass Opacity (GGO), crazy-paving pattern, consolidation,
reticular pattern, GGO with consolidation, GGO plus reticulations,
bronchiectasis and pleural thickening. The horizontal distribution
of pulmonary lesions was noted as peripheral: involving mainly the
peripheral one-third of the lung or central plus peripheral. The area
of involvement was categorized as predominant anterior or posterior
involvement (the area before or after the vertical line of the midpoint
of the diaphragm in the sagittal position respectively). The number of
lesions was noted as single or multiple (> 1) lesions.A semi-quantitative CT severity scoring was used to evaluate
the extent of lung involvement and was recorded for each of the five
lobes during initial as well as each follow-up scan, based on anatomic
involvement: 0, no involvement; 1, < 5% involvement; 2, 5-25%
involvement; 3, 26-50% involvement; 4, 51-75% involvement; and
5, > 75% involvement. The total CT score was the sum of each lobar
score, (0 to 25) [12]. The interval time between initial CT and onset
of initial symptoms was defined as Initial CT interval, the interval
between the first follow up CT and onset of initial symptoms was
defined as first follow-up interval and so on.
We examined the relationship between the CT scores and followup
time as well as the proportion of patients showing progression
during each follow-up to determine the appropriate CT follow-up
time. For all the patients, we also recorded imaging characteristics
of the last CT scan to see if the lesions showed expansion, resolution
into reticular opacities, combination of expansion and resolution or
complete resolution.
Statistical analysis:
Statistical analyses were performed using SPSS version 19.0.
Continuous variables were expressed as Mean ± Standard Deviation
(minimum-maximum), Numerical data were expressed as a
percentage (%) of the total. The comparisons of the quantitative data
were done using two-sample unpaired t-test and counting data were
evaluated using the Pearson Chi-Square test. The difference was
statistically significant with a P-value < 0.05.Results
Demographic and clinical characteristics:
The demographic and clinical characteristics are listed in Table 1.Imaging features of initial CT (Table 2):
The mean interval between the onset of initial symptoms and initial CT was 5.75 ± 1.97 days (range: 2-12 days) in group B, significantly higher than group A- Mean interval: 4.88 ± 2.22 days (range: 1-13) (P- 0.042). 33/43 (76.7%) patients in group A and 51/57 (89.5%) patients in group B showed parenchymal abnormalities in the first chest CT scan. The mean interval between initial negative CT status and subsequent positive CT status was 7.6 ± 2.63 days (5-12) for group A and 7.71 ± 3.94 (4-15) for group B (P-0.944). The predominant distribution pattern was peripheral in group A cases (26/43:60.5%) while the central plus peripheral pattern was more common in group B cases (33/57:57.9%). The posterior portion of lung was more commonly involved in both the groups, A- 27/43
(62.8%) and B- 36/57 (86.1%). The CT severity scores of each of the lung lobes were greater in group B than group A (all P<0.001), with the highest score, observed in the right lower lobe in both the groups
(1.37 ± 1.02 in group A and 2.07 ± 1.03 in group B).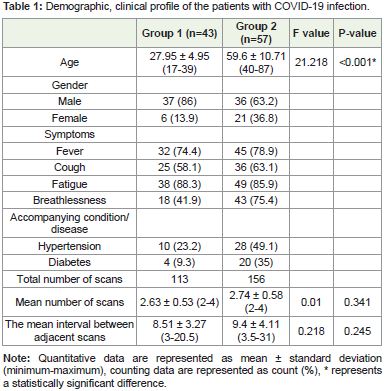
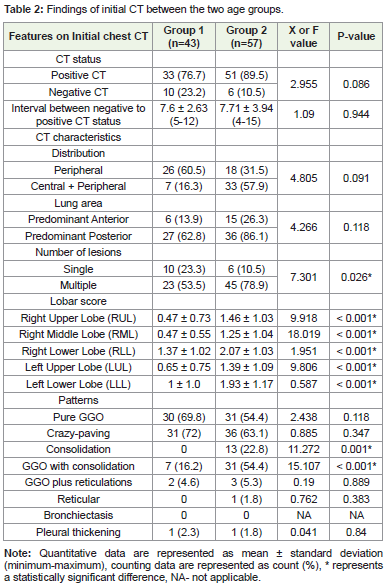
The predominant patterns during the initial scan were pure GGO
and crazy-paving pattern: 30/43 (69.8%) and 31/72 (72%) in group A
and 31/57 (54.4%) and 36/57 (63.1%) in group B, (P>0.005).Others
patterns like consolidation and GGO with consolidation were greater
in proportion in group B than the group A (13/57 [22.8%] vs. 0/43,
P-0.001 and 31/57 [54.4%] vs. 7/43 [16.2%], P<0.001).
The mean total CT severity score of group B was greater than that
of group A during initial as well as subsequent follow-up scans (all
P<0.001). About CT interval times, the initial CT interval and the first
follow-up interval time was greater in group B than group A patients
(P-0.042 and P-0.022), whereas not much difference was noted in
second and third follow-up interval time between the two groups (P-
0.528 and P-0.224).
For Group A patients, there was a marked increase in the mean
CT score values after the initial CT scan (3.95 ± 3.33). The mean CT
score peaked during the first follow-up interval; mean 12.49 ± 3.31 (8-
20) days with a mean score value (7.26 ± 4.02). Afterwards, the mean
CT score began to decrease, the score value was 5.50 ± 3.40 during
the second follow-up interval: 21.27 ± 7.41 (6-43) days. Later on, the
mean score dropped to the lowest value of 2 ± 0.0 during the third
follow-up interval- 30 ± 2.82 (28-32) days.
In group A, 32/43 (74.4%) patients showed progress during
the first follow-up interval, while 2/43 (4.6%) showed no interval
change and 9/43 (20.9%) showed improvement during this interval.
During the second follow-up interval, 3/26 (11.5%) patients showed
progress, 21/26 (80.7%) cases showed improvement and 2/26 (7.6%) cases showed no interval change whereas 2/2 (100% cases) showed
significant improvement during the third follow-up interval.
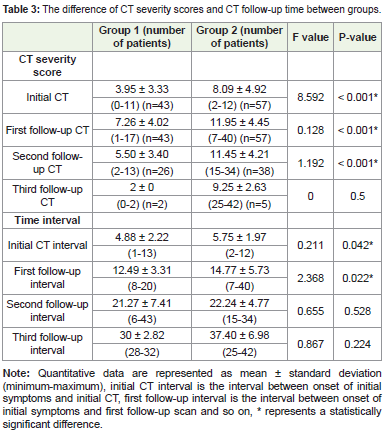
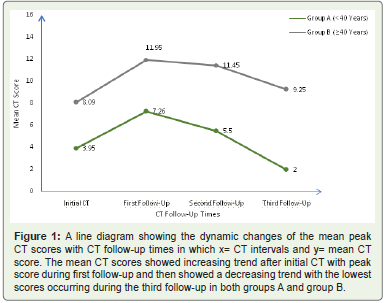
The peak of mean CT score for group B patients (11.95 ± 4.45)
was reached during the mean interval of 14.77 ± 5.73 (7-40) days after
the onset of initial symptoms (first follow-up interval). It remained
stable with a mean value- 11.45 ± 4.21 during the second follow-up
interval: 22.24 ± 4.77 (15-34) days. After this time the mean score
dropped to a value of 9.25 ± 2.63 around 37.40 ± 6.98 (25-42) days
(third follow-up interval).
Of 57 patients in group B, 49 (85.9%) showed progress, 3 (5.2%)
remained stable and 5 (8.7%) improved during the first follow-up
interval. During the second follow-up interval, 10/38 (26.3%) patients
showed progress, 20/38 (52.6%) cases showed improvement and 3/38
(7.8%) cases showed no interval change whereas 1/5 (20%) cases were
stable and 4/5(80%) cases showed significant improvement during
the third follow-up interval.
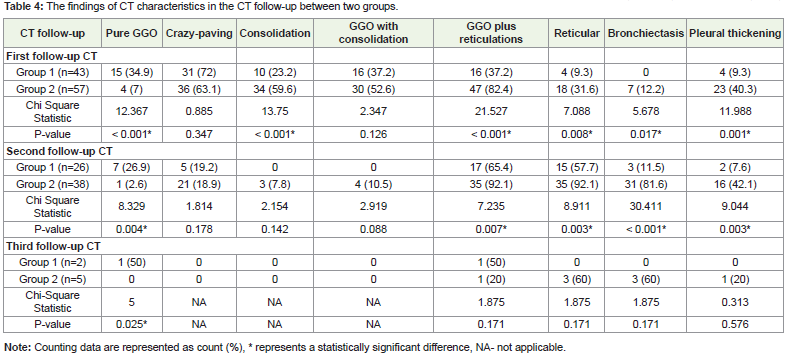
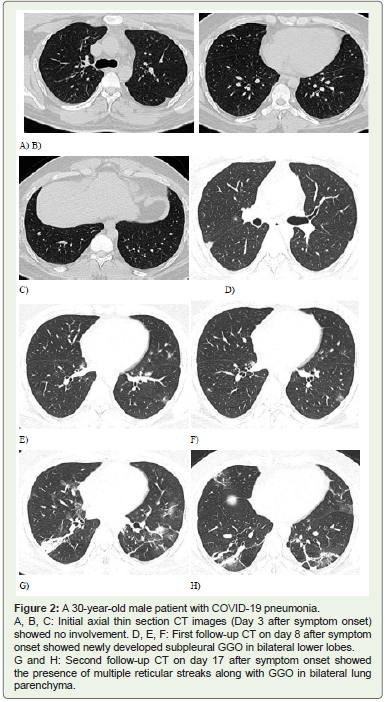
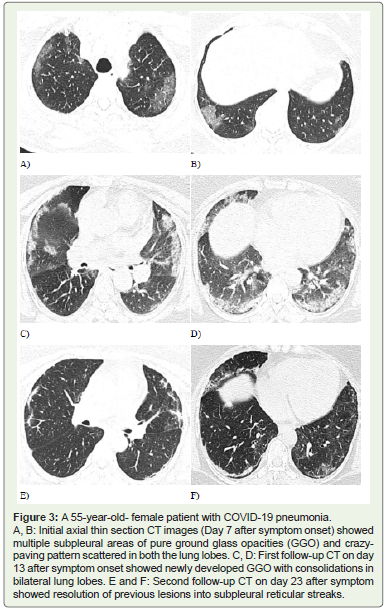
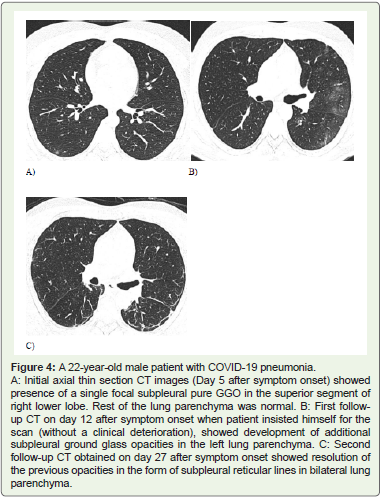
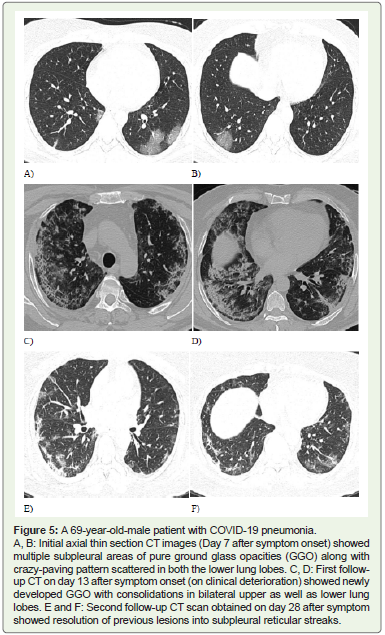
Temporal changes in the main CT characteristics (Table 4 and Figures 2-5):
During the first follow-up interval, the predominant finding was crazy-paving pattern in both group A (31/43, 72%) and B (36/57, 63.1%) (P-0.347). Pure GGO was more common in group A (15/43, 34.9%) than group B (4/57, 7%) (P<0.001). The following features: consolidation, GGO plus reticulations, reticular pattern and pleural
thickening were significantly more common in group B than in group A (34/57[59.6%] vs. 10/43[23.2%], 47/57[82.4%] vs. 16/43[37.2%], 18/57[31.6%] vs. 4/43[9.3%] and 23/57[40.3%] vs. 4/43[9.3%]; all P<0.05). The GGO with consolidation pattern was more common in group B (30/57[52.6%]) than group A (16/43[37.2%]), but without a significant difference (P-0.126).The GGO plus reticulations and reticular patterns were more
common during the second follow-up interval. No significant
difference was observed during this follow-up interval concerning the
crazy-paving, consolidation and the GGO with consolidation patterns
(P-0.178, P-0.142, P-0.088), whereas the GGO plus reticulations
pattern, reticular pattern, bronchiectasis and pleural thickening were
much more common in group B than in group A.(35/38[92.1%] vs.
17/26[65.4%], 35/38[92.1%] vs. 15/26[57.7%], 31/38[81.6%] vs. 3/26
[11.5%] and 16/38[42.1]% vs. 2/26 [7.6%]; all P<0.05).
During the third follow-up interval, pure GGO was predominant
in group A, 1/2 (50%) than group B(0/5)(P-0.025) whereas reticular
pattern, bronchiectasis and pleural thickening were common in
group B as compared to group A, but without a statistically significant
difference (all P>0.05).
During the analysis of the final follow-up scan, 11/43 (25.5%)
patients of group A and in 1/57 (1.7%) patients of group B showed
complete resolution of the lesions (P<0.001), expansion of the preexisting
abnormalities were noted in 7/43 (16.2%) patients of group A
and 6/57 (10.5%) patients of group B(P-0.397). 20/43 (46.5%) patients
of group A and 33/57 (57.9%) patients of group B showed absorption
of the earlier lesions into reticulations (P-0.259), while 4/43 (9.3%) patients of group A and 18/57 (31.57%) patients of group B showed
simultaneous expansion and resolution of the previous lesions (P-
0.008).
Discussion
We investigated the initial CT imaging features of COVID-19
pneumonia and their imaging evolution during follow-up in the two
age groups in a sample of 100 patients with a total of 269 scans.
We reported an abnormal (positive) CT status in 33/43 (76.7%)
of group A patients and 51/57 (89.5%) of group B patients, when the
initial CT was done at a mean interval of 4.88 ± 2.22 days in group A
and 5.75 ± 1.97 days in group B. Thus, to know about the presence of
pneumonia, the appropriate time for the initial scan is usually 5 days
after the symptom onset [13].
In a study conducted by Fang Y et al. describing the CT image
visual quantitative evaluation and clinical classification of COVID-19,
71.8 % symptomatic confirmed cases had CT evidence of pneumonia
[14]. Zhan J et al. reviewed CT scans of 110 patients describing CT
pattern of evolution of COVID-19 pneumonia and reported an
overall rate of 8.1 % negative scans [15]. Similarly, Liu X et al. found a
pooled positive CT rate of 89.7% cases among 2378 COVID-19 cases
in a meta-analysis which included a total of 13 studies [16]. Thus,
a comparable positive rate in this study could reflect the possible
similar course of disease in Indian population as well as the fact that
this study included only symptomatic positive patients. Also the
findings of this study are in concordance with that of Yuhui et al. who
reported that the extent of lung abnormalities usually peaked during
days 6-11 of illness [13].
Our results showed a predominant peripheral pattern of
distribution (26/43; 60.5%) in the younger age group (A: < 40 years)
while central plus peripheral involvement (33/57; 57.9) in the older
age group (B: ≥ 40 years). Initially, the virus is believed to attack
mainly the terminal and respiratory bronchioles, manifested as the predominant peripheral pattern of lung involvement. However, the
diffuse distribution of lesions, along with higher mean lobar CT
severity scores on the initial chest scan observed in the older age
group could represent more extensive parenchymal involvement in
the older adults during the initial course of the disease. The highest
CT severity score was observed in the right lower lobe due to shorter
right lower lobe bronchial anatomy.
Zhou et al. studied the evolution of CT features in 100 confirmed
COVID-19 pneumonia patients. Based on imaging, they described
the course of disease into the early rapid progressive stage: 1 to 7 days
after symptom onset, advanced stage: 8-14 days after symptom onset
and advanced stage: ≥ 14 days after symptom onset [17]. They reported
that the pure GGO, GGO with consolidation were more common
during the early rapid stage, a sharp increase in the consolidation
and GGO plus reticular pattern was observed during advanced stage
while repairing signs- reticular pattern and bronchiectasis were
predominant during the absorption phase.
In our study, the spectrum of CT characteristics observed was
pure GGO, crazy-paving, consolidation, GGO with consolidation,
GGO plus reticulations, reticular pattern, bronchiectasis and pleural
thickening, findings similar to previous studies [18-20]. During the
initial chest scan, the most common patterns seen were pure GGO
and crazy-paving patterns with no significant difference between
the groups [17], finding consistent with a previous study [21]. In
early stages, the virus attacks the peripheral vessels and terminal bronchioles causing an increase in the intraductal pressure which
results in exudation, manifested as subpleural pure GGO. Over time,
the collagen fibres are laid down by the proliferating fibroblasts which
result in interstitial thickening and together along with the ground
glass opacities crazy-paving pattern is formed. Further, as the disease
progresses, the thickened lobular septum limits the absorption of the
alveolar exudation, resulting in the alveolar consolidation formation.
The significantly higher proportion of group B patients showing GGO
with consolidation and consolidation patterns during the initial chest
scan could represent more rapid advancement of the disease course
in the older age group.
The first follow-up study (approximately 13 days after symptom
onset) in group A, showed a predominance of crazy-paving pattern
over other patterns while the dominant patterns observed in group B
patients during their first follow-up interval (approximately 15 days
after symptom onset) were crazy-paving, GGO with consolidation,
consolidation and GGO plus reticular patterns. This finding also
supports the fact that disease progression is much faster in the elderly.
The appropriate time for the patients to undergo CT reexamination
should be when the CT severity scores are at the peak
and also when the extent and the density of lung opacities are more
severe. The mean CT score peak was observed at a mean of 12.49 ±
3.31 days in group A and 14.77 ± 5.73 days in group B cases. This
finding is comparable to the results of other studies [13].
The absorption phase of COVID-19 pneumonia is characterised
by the decrease in the inflammatory cells with a progressive increase
in the amount of the fibroblasts and the collagen fibres resulting in
interstitial fibrosis- reticular pattern (repairing sign). Previously
conducted studies have shown that the onset of the absorption
phase starts approximately 14 days after symptom onset [17,22]. We
found that the GGO plus reticulations and reticular pattern were
predominant during the second follow-up interval (mean interval
of 21.27 ± 7.41 days in group A and 22.24 ± 4.77 days in group B).
And about 92.1 % patients in the older age group (B) showed reticular
pattern as compared to 57.7% patients in younger age group (A), thus
older patients are more likely to have the reticular pattern (a sign of
pulmonary fibrosis). Deterioration of lung structure and function,
weaker immune system of the body along with pre-existing medical
diseases could result in the reduction of the lung compliance and
thus a more severe extent and pattern of pneumonia in the elderly
population.
The mean CT scores dropped to the lowest value about 30 days
after symptom onset in group A and 37 days after symptoms onset
in group B patients, with the conversion of the previous lesions into
reticulations. Thus a CT re-examination to look for disease remission
could be done during this period. All recommendations were made to
regulate the frequency of CT scans to reduce the radiation dose and to
show timely changes in the disease course.
The findings are similar to those conducted by Cheng yang et
al. who studied temporal lung changes in eighty-six COVID-19
pneumonia patients and concluded that the appropriate follow-up
time of CT scans is during the second week (approximately 12 days)
and the fourth to fifth weeks (approximately 23-36 days) from the
onset of illness [23].
In our study, we also recorded the imaging features of the final CT
scan during the follow-up. About 25.5% of patients belonging to the
younger age group showed complete resolution of the abnormalities
as compared to only 1.7% of patients among the older age group. This
finding suggested that younger patients are associated with easier
absorption of lesions.
Limitations
Firstly, the sample size was smaller and heterogeneous. The
number and follow-up interval of CT scans per patient were different
which could result in selection bias. Also, patterns like reticulations
and bronchiectasis need further follow-up to determine whether
the fibrosis seen in COVID-19 is reversible or irreversible. Finally,
no lung biopsies were performed to assess the correlation between
radiological and histopathologic findings.
Furthermore, CT imaging also has many pitfalls. The imaging
findings except for the higher prevalence of peripheral distribution, involvement of upper and middle lobes, COVID-19, and non-
COVID viral pneumonia have overlapping chest findings [24]. Also,
bilateral GGOs have a much broader differential, present in atypical
infections, non-infectious processes, and even in healthy individuals
[25,26]. Moreover, the CT scanner may act as a fomite of COVID-19
transmission.
Also, the results of a meta-analysis showed that 10.6% of
symptomatic patients with RT-PCR test-proven COVID-19 have
normal chest CT findings [8], which suggests that true sensitivity may
be considerably lower than that reported by many of the initial studies
on this topic. Thus, a negative chest CT examination result certainly
does not exclude COVID-19. The proportion of false-positive chest
CT examination may also be due to overlapping imaging features
with other viral pneumonia. Also, the interpretation of chest CT
examinations may become particularly challenging during influenza
season.
Katal et al. studied CT imaging findings in patients with preexisting
lung malignancies and stated [27], although peripheral GGOs
and consolidations are usually highly suggestive of superimposed
COVID-19 pneumonia, these findings can be hardly distinguishable
from an underlying lung malignancy or other opportunistic
infections in patients with known lung cancer and warrant clinical,
epidemic and laboratory correlation with PCR testing. Similarly it is
very difficult to differentiate post COVID fibrosis especially in elderly
patients with a pre-existing Interstitial Lung Disease (ILD) especially
Idiopathic Pulmonary Fibrosis (IPF) which is the commonest form of
ILD typically affecting the older age groups. Alveolar hemorrhage and
adult Acute Respiratory Distress Syndrome [ARDS] may also present
with features similar to COVID-19 pneumonia. Thus, it is important
to realize that CT is not the standard for the diagnosis of COVID-19,
but its findings help suggest the diagnosis in the appropriate setting.
It is crucial to correlate chest CT findings with epidemiologic history,
clinical presentation, and RT-PCR test results.
Conclusion
Differences in chest CT features, such as the distribution, number
of lesions, lobar CT severity scores and patterns of lung abnormalities
were observed in younger (< 40 years) and older-aged (≥ 40 years)
patients with COVID-19 pneumonia. The disease appeared to be
milder in the younger population. The elderly patients are more likely
to have extensive lung lobe involvement, interstitial and reticular
changes, and pleural thickening. These characteristics may have a
role in the progress as well as prognosis of the disease. To confirm
the presence of pneumonia, the appropriate time for the initial scan
is usually 5 days after the symptom onset. The appropriate followup
time of CT scans is during the second week (approximately 12
days after symptom onset for younger patients and approximately 14
days after symptom onset for older patients) and after the fifth week
(approximately 30 days after symptom onset for younger patients and
approximately 37 days after symptom onset for older patients). In the
former time, patients are in the progression of the disease and a CT
re-examination aims to help determine the extent of the disease, while
in the later time, patients are in recovery and a re-examination aims
to determine the absorption of the lesions. All recommendations aim
to reduce the CT radiation dose to the patients.
References
Citation
Anand A, Rathod J, Hundekari M, Disawal A, Jaybhay S, et al. A Comparative Study of the Temporal Changes of CT Findings in Younger and Older Adults with COVID-19 Pneumonia. Indian J Appl Radiol. 2021;7(1): 158.