Review Article
Imaging in Cerebral Sinovenous Thrombosis
Shashank Raj1, Vikas Bhatia1*, Pratibha Bhatia1, Manisha Joshi2, Arushi Gahlot Saini3 and Paramjeet Singh1
1Department of Radio-diagnosis and Imaging, PGIMER, Chandigarh, India
2Consultant Neurointervention Radiologist, Rajagiri Hospital, Aluva, Erunakulam, Kerala
3Department of Pediatrics, PGIMER, Chandigarh, India
*Corresponding author: Dr. Vikas Bhatia, Neuroradiology section, Department of Radio-Diagnosis, PGIMER, Chandigarh, India 160012 Email: drvikasbhatia@gmail.com
Copyright: © 2021 Shashank Raj, et al. This is an open access article distributed under the Creative Commons Attribution License, which permits unrestricted use, distribution, and reproduction in any medium, provided the original work is properly cited.
Article Information: Submission: 30/10/2020; Accepted: 06/01/2021; Published: 11/01/2021
Abstract
Background: Cerebral Sinovenous Thrombosis (CSVT) is a frequent pathology associated with a wide range of causative factors and non-specific clinical symptoms which need a timely diagnosis and adequate therapy.
Objective: To describe the imaging features of CSVT.
Material and methods: We review the role of various diagnostic modalities in the management of CSVT. Besides, various mimics and pitfalls in imaging of these cases are described.
Results and conclusion: Imaging plays a key role in the early diagnosis and management of CSVT cases.
Keywords
CSVT; MRI; CTV; Imaging
Introduction
CSVT is a frequent pathology associated with a wide range of
causative factors and non-specific clinical symptoms. The projected
annual incidence is 2 to 7 cases per million population [1]. We
briefly review the underlying pathophysiology, causes, and clinical
presentation in CSVT, followed by a radiologic approach to the
investigations and management.
The Superior Sagittal Sinus (SSS) is most frequently involved
(66.7%), followed by the lateral and sigmoid sinuses [2,3]. The
causative factors in CSVT are numerous and can be broadly divided
into local or systemic factors. Local factors are related to the inherent
or mechanical conditions of the intracranial veins or venous sinuses,
which alter the venous flow and may predispose to the development
of thrombosis. Common examples include neoplastic infiltration,
regional infection such as mastoiditis, or injury caused by trauma.
Systemic factors may affect the blood flow and dynamics or pertain to an
underlying systemic illness. Examples include oral contraceptive use
and pregnancy/puerperium, which alter the hormonal homeostasis
and lead to a hypercoagulable state. Various systemic illnesses such as dehydration, sepsis, connective tissue disorders can lead to
hypercoagulable states. Hematological conditions such as protein
S and C deficiencies, factor V Leiden mutation, antiphospholipid
syndrome, and vasculitis can contribute to a thrombogenic state.
Nevertheless, in nearly 25% of cases, no cause may be identified and
are termed as idiopathic [2].
Parenchymal changes can occur secondary to the increased
venous pressure in thrombosed vessels, especially if the collateral
pathway is insufficient. However, if suitable venous collaterals are in
existence, parenchymal changes may partially or entirely resolve [4-6].
Clinical presentation:
The clinical presentation can range from asymptomatic to severe
encephalopathy, coma, or death. The more common neurological
features at presentation are acute-onset headache, focal neurological
deficits, seizures, raised intracranial pressure, irritability, and altered
consciousness. Parenchymal involvement is more commonly
associated with focal neurological deficits and seizures. Intracranial
hypertension is seen in up to 22-40% of patients with CSVT. Hence,
CSVT must be excluded in patients with unexplained intracranial
hypertension [4].Imaging techniques:
Non-contrast computed tomography (NCCT): NCCT is the
screening imaging technique of choice in these patients as they
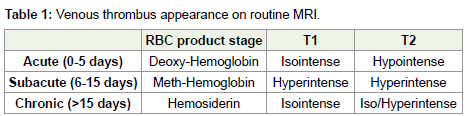
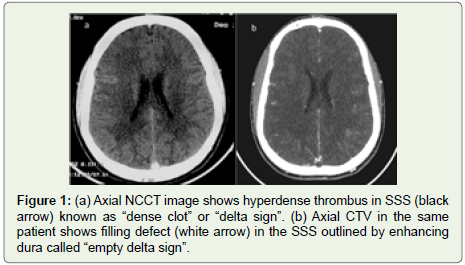
commonly have a non-specific clinical presentation. The most
crucial radiological clue is the ‘dense clot sign’ (Figure 1), which is
visualized as a hyperattenuating thrombus in the occluded sinus [7].
However, it may be seen in only 25% of the cases. Altered attenuation
of venous sinuses may be seen in dehydration, elevated hematocrit,
or adjacent subarachnoid or subdural hemorrhage. The physiological
increase in sinus attenuation can be differentiated from CSVT by
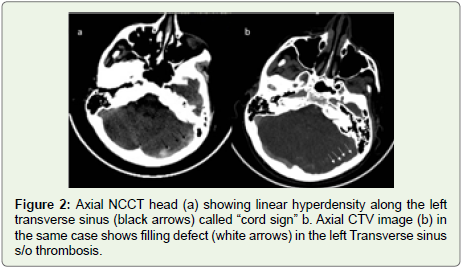
comparing it with the arterial attenuation value. The ‘cord sign’
symbolizes the thrombus of a cortical vein/sinus and is visualized
as a linear hyperdensity along the cortical vein (Figure 2). Ancilliary
signs include venous infarction involving the subcortical region
with sparing of the cortex [8]. It does not correspond to any specific
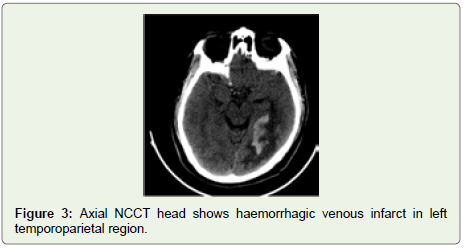
arterial territory. Hemorrhage may appear hyperdense within the
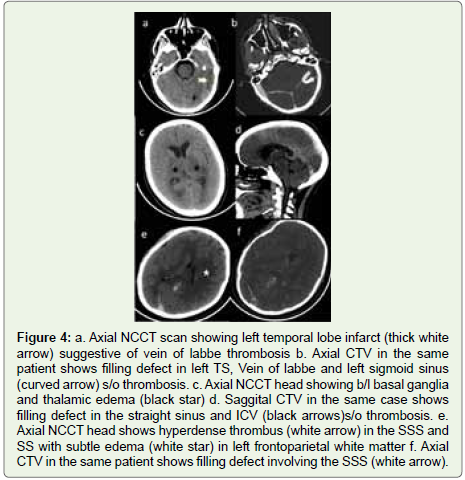
infarcted parenchyma (Figure 3). The location of the infarct can give
a fair idea about the venous structure involved. For example, superior
sagittal sinus often leads to parenchymal changes in the parasagittal
position (Figure 4). Vein of Labbe thrombosis involves the temporal
lobe (Figure 4), and deep venous system involvement leads to the
infarction of thalami, and basal ganglia, including the internal capsule
(Figure 4).CT venography:
CT venography is a notable imaging procedure for detecting
CSVT [9]. It is considered even superior to conventional TOF MR
venography. The thrombus is seen as a filling defect in the dural
venous sinus along with enhancement along the periphery which
likely results from the development of collaterals and is described
as an “empty delta sign” (Figure 1). Additionally, 20% of cases show
enhancement of the tentorium as well as falx which is probably
secondary to venous stasis and hyperemia [9]. However, a normal
NCCT or CECT does not exclude the diagnosis of CVT (false negative
in 10-30%) and MR venography needs to be carried out in case of
strong clinical suspicion.MRI:
MRI is considered to be a more sensitive modality for the
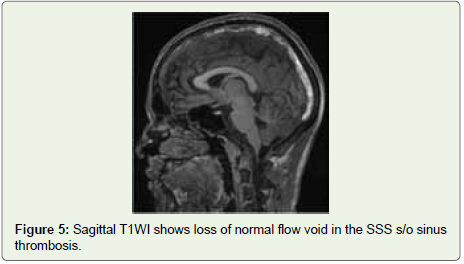
detection of CVTas compared to NCCT. Non-visualization of flow
void along with altered SI in the venous sinus is the principal finding
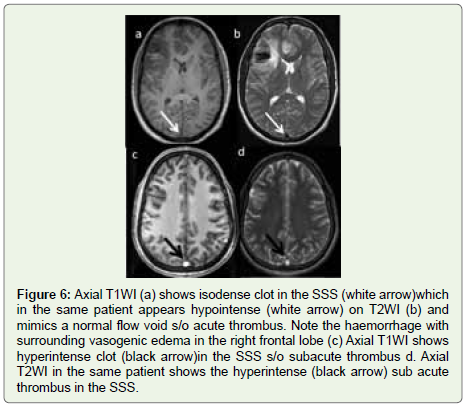
of CVT (Figure 5). The SI of the thrombus on T1WI and T2WI is
dependent on the age of the thrombus which in turn is dictated by
the paramagnetic effect of hemoglobin breakdown products [10,11].An acute venous thrombus may simulate the signal of a normal
flow void (Figure 6). Therefore, contrast-enhanced MRV or CTV is
usually important to attain the diagnosis at this stage. The thrombus
in the subacute stage is seen in ~ 55 % of the patients at presentation
and is the easiest state at which MR can detect a thrombus as SI of
the sinus is most distinct as compared to that in a normal flow state
(Figure 6) [12]. MR black blood thrombus imaging technique is a
3D variable flip angle TSE T1W technique that quells the signal in
the normal vessel and demonstrates the thrombus as a hyperintense
signal. Table 1 shows the relative signal of the thrombus at various
stages on conventional sequences.
As many as 15% of patients with CVT may have chronic
thrombus with incomplete recanalization and may possess a
diagnostic challenge at MR images (Figure 7) [11]. Marked
enhancement may be observed in the thrombus that can resemble
the typical enhancement of a normal sinus [13]. It presumably results
from intrinsic vascularization of the organized thrombus having
intrinsic vascularisation. Therefore, enhancing the sinus does not
unavoidably signify patency and it should be correlated with the MR
venography. SWI ((Susceptibility weighted)/Gradient Recalled Echo
(GRE) sequences are very sensitive in detecting blood breakdown products and play an important role in diagnosing CVT especially
cortical vein thrombosis [11]. Presence of paramagnetic products
like deoxyhemoglobin and meth-Hb in the thrombus yield blooming
artifact in the venous segments that are thrombosed. SWI/GRE is
more important in acute thrombosis where the SI may falsely be
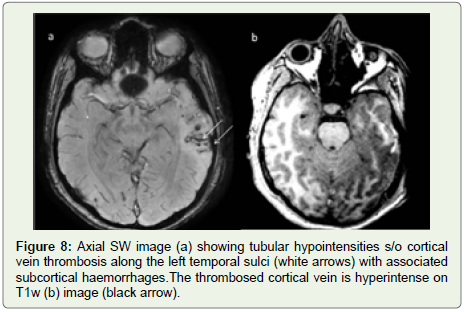
normal as discussed earlier. Well delineated tubular hypointensity on
SWI also suggests cortical vein thrombosis which can be persistent
for weeks and can be associated with underlying cortical/subcortical
WM petechial hemorrhages along with sulcal SAH (Figure 8).
Few studies have also evaluated the role of DWI in CVT [14].
Diffusion restriction has been demonstrated in 41% of patients with
CVT. It has also been seen that in patients with diffusion restriction
complete recanalization was less frequent and the duration of clinical
symptoms way longer.
Kalita et al evaluated the role of CVT score, which was computed
giving 1 point for each thrombosed sinus and 3 points for SSS. They
demonstrated that the CVT score did not correlate with clinical
severity and risk factors. Additionally, there was no relation of CVT
score with death and 6 months outcome [15].
MR venography:
The most commonly used technique is TOF MR venography
which is based on the occurrence of flow-related enhancement of spins
inflowing into an imaging slice. The 2D TOF technique is preferred over the 3D TOF technique. It has reduced sensitivity to signal loss
from saturation effect experienced in 3D technique in which a volume
of the image is obtained concurrently by phase encoding in the slice
select direction. Another technique i.e., phase contrast MRV is also
uncommonly used due to its reliance on operator-dependent velocity
encoding parameters.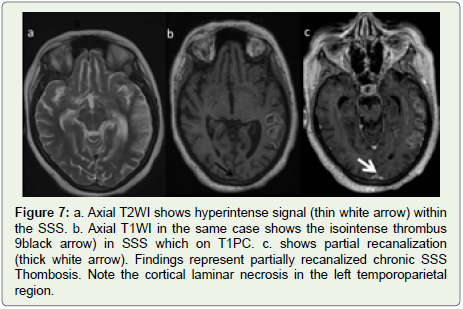
These 2D techniques show the most sensitivity to blood flowing
perpendicular to the plane of acquisition. Conversely, blood flowing
within the plane of the acquisition can lead to saturation resulting
in loss of signal, a known pitfall of TOF MRA. To negate this effect,
acquisition in an oblique plane is advantageous. Contrast-enhanced
MRV utilizes the T1 shortening effect of gadolinium and helps in
improved visualization of smaller vessels as well as venous sinuses
as there is a reduction in the artefactual absence of flow due to
turbulence, in-plane, or slow flow [16].
According to ACR appropriateness criteria MR venography
+/- intravenous contrast is the investigation of choice in a patient
suspected of having CVT with a rating score of 9 followed by CT
venography with a score of 8 [17].
Parenchymal changes in CVT:
In addition to the delineation of vessels on MRI, parenchymal
lesions related to CVT are also depicted better on MR imaging as
compared to CT. Focal parenchymal edema is visible on CT in ~8%
versus 25% cases on MRI [13,18,19]. DWI plays an important role in
differentiating vasogenic edema (which shows increased ADC values)
from the cytotoxic type of edema (shows reduced ADC values).
It has been shown that patients with decreased ADC values more
commonly demonstrate parenchymal sequalae whereas in subjects
with increased ADC values there may be a complete or near-complete
resolution as these are mere because of venous hypertension [20].
Hemorrhage may or may not be associated with both types of edema.
Parenchymal enhancement is also seen in 1-29 % of cases which
is classically gyral and may also involve the adjacent WM. It likely
occurs secondary to damage to the blood-brain barrier (Figure 3) [2].The role of MR perfusion has also been studied in cases of CVT
although the data is scarce. The most common finding in a study was
increased MTT with normal rCBV in the areas drained by thrombosed
vein [21]. The MTT also showed resolution with treatment on follow up.
A study by Khandelwal et al. [3], in which they compared CTV
and MRV, concluded that there is a significant correlation between
these techniques. Considering MRVas a gold standard, CT had good
sensitivity and specificity of around 75-100%. In another study by Issar
et al. MRI was able to detect sinus and parenchymal abnormalities in
100 and 52% as compared to NCCT which was able to diagnose these
abnormalities in only 36 and 42% respectively [22].
Deep venous occlusion:
It is not uncommon and can be observed in ~ 16 to 20 % of
CVT cases. Clinically these patients present with rapidly progressive
deterioration of the sensorium and signs of raised ICT and can
mimic encephalitis [23,24]. Most striking imaging finding is thalamic
vasogenic edema which can be seen in 76% of CT and 86% of MR
images (Figure 4) [23]. This edema may extend to involve caudate
as well as deep WM. The thrombus may also be visualized on MR
images in ICV, VOG, or straight sinus. 19% of cases may also show
thalamic hemorrhage and mortality rates being ~ 22 to 37% [23].Causes of CVT Mimics and Chameleons
CVT Chameleons (Misleading Signs Concealing CVT) NCCT:
- Lack of increased attenuation of a thrombosed sinus. It can
occur if the imaging is delayed [25].- Hyperdense sinus might not be seen due to volume averaging
and is most commonly encountered in transverse sinus.
- Hypoplastic dural sinus can be difficult to discern in the
background of a hyperdense skull even if thrombosed. It is a frequent
finding in which there can be a partial or complete absence of one of
the TS. More commonly right TS is bulkier as compared to the left. In
about 59% of cases, left TS is atretic (20%) or hypoplastic (39%) [26].
CT may be supportive in these asymmetric sinuses as congenitally
hypoplastic TS/SS would have smaller jugular foramina or sigmoid
sinus grooves. “Gibraltar sign” was proposed by Pettersson et al to aid
in the diagnosis of a dominant TS with a very high PPV. The junction
of SSS with the calvarium on axial images shows a resemblance to
the Rock of Gibraltar. The direction of the slope of the groove points
towards the dominant TS and the opposite side may be hypoplastic
[27].
CT venography:
The high density of the thrombus sometimes makes it invisible
against the background contrast enhancement.Partially recanalized chronic thrombus:
Thrombus with vascularity, may enhance and become isodense
to sinus.MRI:
An acute thrombus may mimic flow void as discussed earlier.Enhancement of the chronic sinus thrombus due to vascularity.
Signal shine through of the thrombus. It occurs due to the T1
shortening effect of the thrombus. The thrombosed segment of the
sinus shows intermediate SI on TOF MRV falsely appearing as that of
normal sinus flow. However, it shows a lesser intense signal than the
other patent veins. Correlation with source images as well as T1 and
T2 sequences is of paramount importance.
CVT Mimics:
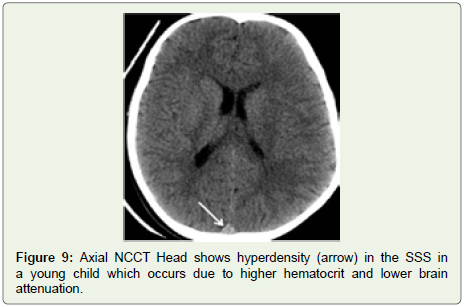
NCCT: Sinuses are normally slightly hyperdense in infants and
young children (Figure 9). It is due to higher hematocrit values than
in adults as well as lower brain attenuation.High hematocrit can cause hyperdense sinus. Arteries in these
patients also show raised attenuation which is an important clue.
CECT: Fenestrations and arachnoid granulations. Arachnoid
granulation may mimic thrombus and are most frequent in the
lateral part of TS where the vein of Labbe enters the TS (Figure 10)
[28]. However, their round shape &small extent along the dural sinus
differentiates them from thrombus. On MRI they show CSF signal
intensity.
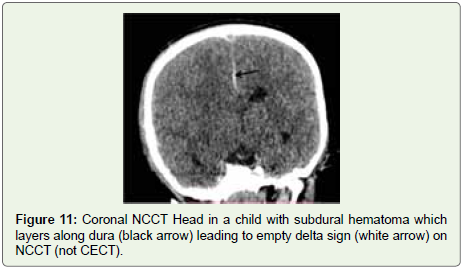
High or asymmetric bifurcation of the superior sagittal sinus. In about 20% of patients with a high bifurcation of SSS can give a
“pseudo delta sign” which mimics sinus thrombosis. A similar sign
can be seen in head trauma on NCCT images (Figure 11).
MRI: SI of a venous sinus may imitate thrombus on SE MR
sequences. The prime causes are decreased flow velocity, in-plane
flow& entry slice phenomenon which results in a lack of expected
flow void [29]. It is particularly a common finding in children <2 years
of age. Slow flow phenomenon more commonly involves left TS, SS,
and jugular bulb likely secondary to physiological compression by left
brachiocephalic vein during the respiratory cycle [30].

MR venography:
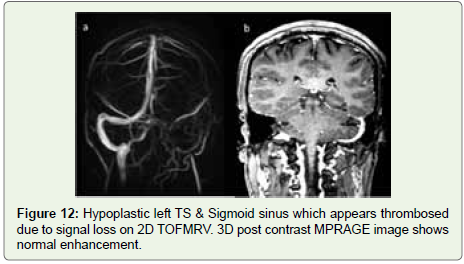
Saturation effect due to in-plane flow or decreased flow velocity
results in signal loss Hypoplasia/atresia (Figure 12).Inferior saturation band used to saturate arterial signal can also
saturate the cephalad blood flow in the anterior and middle part of
the SSS and can lead to signal loss.
Management
Medical management:
Systemic anticoagulation and hydration is the cornerstone
of treatment. Anticoagulation aims at preventing thrombus
propagation rather than dissolving it. A randomized trial consisting
of 20 patients revealed significantly improved outcomes in CVT
patients who received heparin, even in the coexistence of ICH
[31]. Recommendation of the European federation of neurological
societies [32]:Administration of oral anticoagulants for at least 3 months if
CVT is due to a transient risk factor.
In the case of mild thrombophilia or “heterozygous” factor V
Leiden or prothrombin G20210A mutation, anticoagulants need to
be given for 6 to 12 months.
In the case of recurring CVT or a patient with severe
thrombophilia like protein C and S mutation, “homozygous” factor V
Leiden mutation, antiphospholipid antibody, anticoagulation should
be continued for an indefinite period.
Deep venous involvement along with parenchymal hemorrhages
if associated with CVT is regarded as poor prognostic factors.
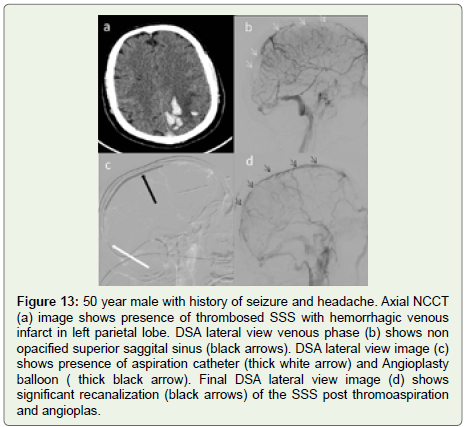
Endovascular management:
Mechanical Thrombectomy (MT) and administration of
thrombolytics are the endovascular options for CVT (Figure 13).Indications include -:
-Patients having neurological deterioration despite
anticoagulation and hydration- Patients in whom anticoagulation is contraindicated
- Patients with ongoing intractable headache [33]
In a study including 52 patients having CVT, MT along with urokinase injection lead to complete and partial recanalization of the
thrombus in 87% and 6% respectively [34].
Several non-randomized studies to compare endovascular
therapy and systemic anticoagulants have shown that the results with
endovascular therapy are at par with that of intravenous heparin
[35,36].
References
Citation
Raj S, Bhatia V, Bhatia P, Joshi M, Saini AG, et al. Imaging in Cerebral Sinovenous Thrombosis. Indian J Appl Radiol. 2021;7(1): 157.