Research Article
Ultrasonographic Estimation of Skin to Subarachnoid Space Depth in the Pre-eclamptic Indian Parturients and its Comparison with Physical Index Based Formula− A Prospective Observational Study
Sutagatti JG1*, Kurdi MS2 and Bilung PA2
1Department of Radiodiagnosis, Karnataka Institute of Medical Sciences, Hubli, Karnataka, India
2Department of Anesthesiology, Karnataka Institute of Medical Sciences, Hubli, Karnataka, India
*Corresponding author: Sutagatti JG, Department of Radiodiagnosis, Karnataka Institute of Medical Sciences,
Hubli, Karnataka, India, Tel: +919448054113; E-mail: drjagadishsutagatti@yahoo.com
Copyright: © 2019 Sutagatti JG, et al. This is an open access article distributed under the Creative Commons Attribution
License, which permits unrestricted use, distribution, and reproduction in any medium, provided the original work is
properly cited.
Article Information: Submission: 04/06/2019; Accepted: 19/07/2019; Published: 22/07/2019
Abstract
Introduction: Spinal Anesthesia technique can be difficult to perform in parturients with pre-eclampsia (PE) due to weight gain along with edema
obscuring the anatomical landmarks.
Aim: This study was planned to determine the skin to subarachnoid space depth (SSD) in full term parturients with PE by ultrasonography (USG) &
physical index based method using Stocker’s formula. The primary outcome was to find out which method correlates best with clinically measured SSD in the
study population. The secondary outcome was to find the difference in SSD between patients with mild PE and those with severe PE.
Materials and Methods: A randomized prospective study for a period of one year was conducted on 100 PE parturients (power of study 95%) aged above
18 years of American Society of Anesthesiologist(ASA) physical status II and III undergoing elective lower segment caesarian section. Pre-procedural USG
of lumbar spine at L3-4 level was done. SSD was noted and marked with a surgical skin marker. Later, on the operation table (OT) SSD was measured with
Quincke spinal needle through the skin marking using conventional landmark technique. These values were then compared with physical index based formula.
Data analysis was done using Microsoft excel and analysed by Statistical Package for the Social Sciences (SPSS) 17.0 version.
Results: Data was collected & analyzed on remaining 97 cases. Bland Altman analysis showed that the limits between SSD-USG & SSD-OT were
narrower (-0.70 to 0.09) than that of SSD-Stockers & SSD-OT (-0.11 to 1.94) which were wider with a larger difference. The SSD-OT in mild PE (4.6 ± 0.5 cm)
& SSD-US (4.3 ± 0.5 cm) was less compared to SSD-OT in severe PE (5.2 ± 0.4 cm) & SSD-US (4.9 ± 0.4 cm).
Conclusion: Pre-procedural USG can be useful in estimating the SSD in parturients with PE who have back edema.
Keywords
Caesarian Section; Neuraxial, Parturients, Pre-eclampsia, Quincke Needle, Spinal Anesthesia, Subarachnoid Space, Ultrasonography
Introduction
Spinal Anesthesia is a generally preferred anesthetic technique in
obstetric anesthesia practice as it is simple to perform and Provides
rapid onset and a dense block.
However it can be difficult in pregnant patients with preeclampsia
(PE). During lumbar puncture, the subcutaneous tissue
is the most variable layer that is related to weight. In pre-eclamptic
patients there is an abnormal weight gain with or without visible edema. This means that the skin to subarachnoid distance may be
variable (may increase in PE patients), thus creating difficulties in
spinal anesthetic technique and choice of length of spinal needle [1].
In recent years, ultrasonography (USG) has been presented as an
innovative and promising device to facilitate neuraxial Anesthesia
application.
USG is a reliable, safe, non-invasive, pain free and real-time
modality for evaluation of the spine and may be helpful to estimate
the skin to subarachnoid space depth (SSD). The estimation of SSD
can help to guide spinal needle placement that results in less traumatic
or bloody lumbar puncture and reduces unsuccessful and repeated
attempts which may worsen the outcome of patients. Estimation
of SSD can help to reduce post spinal anesthetic complications [2].
Investigators have correlated SSD with different demographic and
anthropometric parameters [3].
USG guided performance of regional anesthesia is an attractive
option for high risk parturients as in PE, but its benefit has to be
quantified as yet While there are several studies on distance from skin
to epidural space, studies on SSD are relatively few; infact they are very
few in obstetric populations [4,5]. Keeping this in mind the present
study was planned with an aim to determine the accuracy of USG
to assess the SSD at L3-4 space and comparing it with the physical
based formula (Stocker’s) in parturients with PE. We hypothesized
that preinsertion USG for spinal anesthesia is more accurate than
physical indexed based method (Stocker’s formula) in estimating SSD
in parturients with P.E.
Materials and Methods
Institutional ethical committee approval was obtained. A
prospective observational study was planned for a period of one year
from January 2017 to December 2017.
A pilot study was conducted by us in our hospital which is a
tertiary medical care centre on 10 PE parturients. Based on this and a
study conducted by Ellinas EH et al. on the average number of needle
passes for an experienced anaesthesiologist [6], we hypothetised that
pre-procedural USG could reduce the number of needle passes and
we calculated the sample size to be 100, power of the study 95% with
α error of 5%.
After obtaining individual patient consent, 100 PE parturients aged
above 18 years were enrolled in the prospective observational study.
The inclusion criteria were American Society of Anesthesiologists
physical status (ASA) II and III full term pregnant patients scheduled
for elective lower segment caesarean section under spinal anesthesia.
The exclusion criteria were eclampsia, hemolysis, elevated liver
enzymes, low platelets (HELLP) syndrome, hematological and
neurological disorders, prior lumbar surgeries and patients with
spinal anomalies and local infection at the lumbar puncture site.
The primary outcome was to estimate the correlation of SSD
measured clinically on the operating table with SSD estimated by
USG and physical index based method in the study population. The
secondary outcome was to find the difference in SSD between patients
with mild PE and those with severe PE.
Basic characteristics of each patient like age, weight, Grades of
PE, Grades of back edema were noted.
Pitting edema was classified based on the depth & duration of the
indentation [7].
The following scale was used to rate the severity:
+1: The pressure applied by the doctor leaves an indentation of
0-2 millimeters (mm) that rebounds immediately. This is the least
severe type of pitting edema.
+2: The pressure leaves an indentation of 3-4 mm that rebounds
in few seconds.
+3: The pressure leaves an indentation of 5-6 mm that takes less
than 15 seconds to rebound.
+4: The pressure leaves an indentation of 8 mm or deeper. It takes
more than 20 seconds to rebound.
Consecutive eligible parturients were evaluated prior to elective
LSCS and the patient was immediately taken up for USG spine which
was done by a qualified radiologist who is one of the co-researchers of
this study. The USG was done in the department of radio-diagnosis.
The time duration between USG and LSCS was around 18 to 20
hours. The patient would be in sitting position during the procedure
with back flexed as if for a lumbar puncture and the SSD was noted.
The steps were as follows -
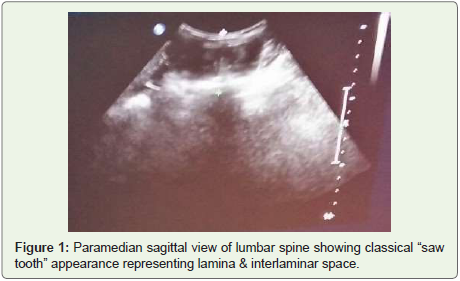
Para median sagittal approach at the lower back was made to
identify the sacrum and the desired level of the spine using
5-12 MHz curvilinear transducer with an US device (Philips
IU-32). The transducer was then oriented towards the midline
to achieve “saw- tooth appearance” indicating lamina and
inter-laminar space (Figure 1)
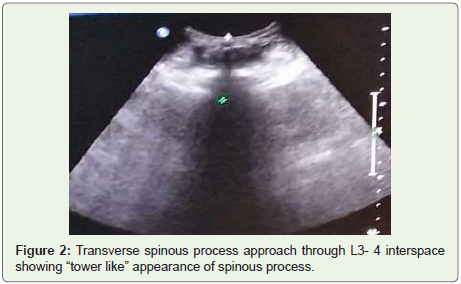
Counting up the levels from sacrum L5S1 to the desired level.
The transducer was rotated by 90° at L3-4space.Transverse
view at spinous process would now show “tower” sign
indicating the spinous process (Figure 2).
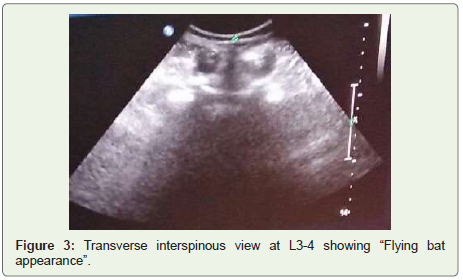
The transducer was then rotated caudally into the L3-4 space,
“tower” sign would disappear as the transducer was moved
into the space either caudally or cephalad. The “flying bat”
sign would then emerge (Figure 3).
The midline and level on the side of probe would be marked
using a surgical skin marker to keep insertion point visible
after cleaning with antiseptic solution.
The SSD-USG was obtained by measuring between the skin
surfaces to the echo-lucent rim noted in the spinal canal
representing the subarachnoid space.
When the patient was taken up for elective LSCS in the operating
room, standard monitoring including electrocardiograph, pulse
oximetery and non-invasive blood pressure was established.
Intravenous access was secured with an 18 gauge intravenous cannula.
All patients were co-loaded with Ringer’s lactate solution.
The patient was put in the sitting position on the operation
table with the back fully flexed. Using aseptic precautions, the skin
marking was identified. Dural puncture was performed through this
marked point with a 25/26 gauge Quincke (3.5 inch/8.9 cm) spinal
needle using the midline approach.
The spinal needle was inserted perpendicular to the skin. The
needle was advanced until loss of resistance was obtained, signifying
entry into the subarachnoid space and confirmed by free flow of clear
cerebrospinal fluid. Local anaesthetic was then injected intrathecally.
The spinal needle was grasped firmly between the thumb & the
index finger abutting the patient’s back and then removed. The depth
of insertion was measured using a standard scale and was noted down.
All this was done by a qualified experienced anesthesiologist. In case lumbar puncture (LP) was unsuccessful, the direction of needle was
changed in the same space without withdrawal of needle outside the
skin.
In case two more such attempts with changed direction failed,
the optimal space for LP was now identified guided by an anatomical
landmark like Tuffier’s line. This would be either L3-4 or L4-5 space.
The LP was then attempted in this space with perpendicular needle
approach/ change in needle angulation till successful. In case LP
was still unsuccessful, paramedian approach would be resorted to;
however all these cases where LP was unsuccessful by perpendicular
midline approach in USG identified L3 L4 space were considered as
drop outs for the study.
Stocker’s formula: SSD (mm) = 0.5 x weight (kg) + 18 [8],
was applied to each patient in whom USG guided puncture by
perpendicular approach was successful and the SSD as per this
formula was estimated.
Comparison between SSD estimated by USG and Stocker’s
formula and correlation with clinically assessed SSD was done for each
of those patients in whom USG guided puncture by perpendicular
approach in L3-4 space was successful.
The collected data was entered into Microsoft excel and analysed
by statistical package for the social sciences (SPSS) 17.0 version. The
results were expressed as mean +/- standard deviation of difference
(SD).
Bland Altman analysis was used for comparison of SSD between
different methods.
Results
In our study, 100 parturients were enrolled, out of which 3
delivered vaginally and were considered dropouts. 47 patients
(48.5%) were between 20-24 years of age, 39 patients (40.2%) were
between 25-29 years of age and 11 (11.3%) were 30 years and above.
The mean age in the study population was 24.9 years & SD was 3.91.
The mean weight in the study population was 78.9 kilograms and SD
was 6.6. The mean gestational age was 38.2 weeks and SD was 1.1.
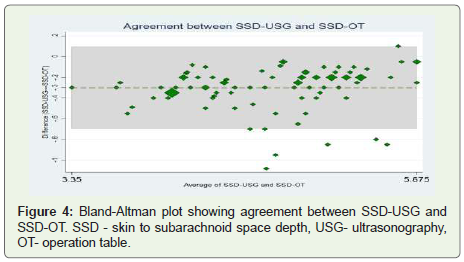
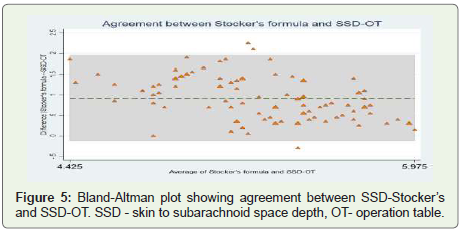
We plotted the limits of agreement using Bland- Altman plots
(Figure 4 and 5).
We found that the limits between SSD-USG & SSD-OT were
narrower (-0.70 to 0.09) than that of SSD-Stockers & SSD-OT (-0.11
to 1.94) which were wider with a larger difference.
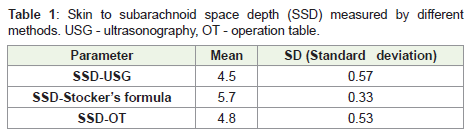
SSD using USG had a mean of 4.5cm & SD of 0.57 and correlated
well with SSD on O.T table with a mean of 4.8cm. The mean difference
(95% CI) between SSD-USG & SSD-OT was -0.3(-0.34 to -0.26). SSD
measured by Stocker’s formula was 5.7 ± 0.33 cm [SD=0.33]. The
mean difference between SSD-Stocker’s & SSD-OT was 0.91(0.81 to
1) shows SSD estimated by different methods (Table 1).
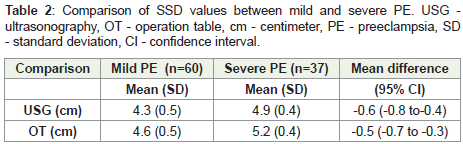
In our study population, 37 patients (38%) had mild PE and 60
(62%) had severe PE. The SSD-OT in mild PE (4.6 ± 0.5 cm) was less
compared to SSD-OT in severe PE (5.2 ± 0.4 cm); p<0.001. SSD-US
in mild PE (4.3 ± 0.5 cm) was less than SSD-US in severe PE (4.9 ± 0.4
cm); p<0.001(Table 2).
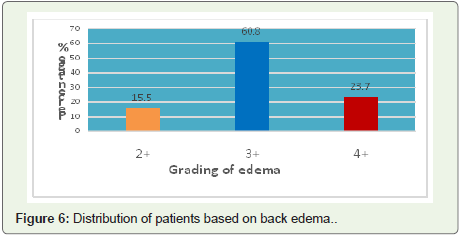
15 patients (15.5%) had grade 2 edema, 59 (60.8%) had grade 3 &
23 patients (23.7%) had grade 4 edema of the back (Figure 6).
Discussion
Neuraxial ultrasound is a useful complement to clinical
examination when performing lumbar central neuraxial blocks.
It provides anatomical information including the depth of the
subarachnoid space, the identity of a given intervertebral level, and
the location of the midline and interspinous/interlaminar spaces.
We thought that an estimation of SSD would be particularly useful
in difficult anatomical situations such as PE. Hence, we planned this
study in PE parturients. To our knowledge, there are very few studies
on this topic in PE parturients.
Some investigators have correlated SSD with different
demographic and anthropometric parameters. Various formulae like
Abe’s, Bonadio’s, Craig’s, Chong’s, have been used to estimate the
SSD in different populations [3]. Stocker’s formula most accurately
predicted the SSD when applied to our Indian population & it is
characterized by being simple, easy to remember & uses only weight
as the only variable [9]. Hence, we selected Stocker’s formula for our
study.
We chose midline approach in our study as it is a commonly used
and most familiar approach.
We chose midline approach in our study as it is a commonly used
and most familiar approach.
USG imaging of the spine can be performed in the transverse
axis (transverse scan) or the longitudinal axis (sagittal scan) for
midline approach. We located the interspinous space by sagittal scan
and chose transverse scan for measuring the SSD. Most researchers
have chosen the transverse scan as it is relatively easy to acquire in
the lumbar region [10]. A transverse scan can be performed over the
spinous process or through the interspinous, interlaminar space. The
transverse scan in our cases was performed over the spinous process
and a transverse spinous process view of the spine was obtained. We
did have to tilt the transducer either cranially or caudally depending
upon the angulation of the spinous process in order to produce an
optimal interspinous view of the neuraxial structures.
Some researchers have compared pre-procedural USG- guided
paramedian approach with landmark- guided midline approach
[1]. Others have compared SSD-USG with SSD-OT in the general
populations [10]; some researchers have compared SSD using
USG & predicted SSD (using various formulae for anthropometric
measurements like Bonadio’s formula) with clinically observed SSD.
Tyagi et al in a recent study found that SSD using Bonadio’s formula
did not correlate with the SSD-USG or actual needle insertion [11].
In our study too, the anthropometric measurement using Stocker’s
formula did not correlate with the SSD-USG or actual needle
insertion. Also to our knowledge, no such study has been conducted
till date in PE cases. Dhanger et al. have compared landmark versus
pre-procedural USG- assisted midline approach for identification
of the subarachnoid space in elective caesarean section cases [12];
however unlike us, they did not include PIH cases in their study. Also
in addition to measuring SSD, they also measured other parameters
like identification of the interspace.
Our study results are comparable with those of Sahin T et al. in
whose study a good correlation between ultrasound group & control
groups has been demonstrated [13]. They found a high correlation
between ultrasound and needle depth. However their study was done
on obese & lean parturients and not on PE patients as in our study.
In our study results the mean difference (95% C.I) between
SSD-USG & SSD-OT was -0.3 (-0.3 to -0.26). Predicted SSD using
Stocker’s formula (5.7±0.33cm) was also significantly longer & was far away from observed SSD-OT (4.5±0.53cm). As mentioned by
some authors, the correct statistical approach to assess the degree of
agreement between two quantitative methods of measurements is not
obvious. Bland Altman analysis studies the mean difference between
two quantitative measurements and constructs limits of agreements
[14]. The smaller the range between the two limits, the better the
agreement between the two methods of SSD measurement. In our
study, in the Bland Altman plot, the limits between SSD-USG and
SSD-OT were narrower, thus implying that the range between the two
limits SSD-USG and SSD-OT was smaller than that of SSD-Stockers
and SSD-OT [15]. The mean difference between SSD-USG correlated
well with SSD-OT, while SSD-Stockers overestimated SSD-OT. Thus,
SSD-USG when compared with SSD-Stockers correlated more with
SSD-OT.
The SSD-OT in mild PE (4.6 ± 0.5 cm) & SSD-US (4.3 ± 0.5 cm)
was less compared to SSD-OT (5.2 ± 0.4 cm) & SSD-US (4.9 ± 0.4 cm)
in severe PE in our study. This may be explained by more edema in
the subcutaneous tissue in severe PE.
Similar to our study findings, Dhanger et al. found that USG
measured depth of subarachnoid space correlated highly with the
depth of the needle measured after the LP procedure in elective
caesarean section cases [12]. In our study, SSD-USG underestimated
the distance observed clinically by 0.3 cm. Dhanger et al. also found
that the USG measured depth underestimated the depth measured
by landmark technique by about 0.08 cm. They attributed this to
subcutaneous tissue compression by the ultrasound transducer. The
underestimation in our study was more than that in Dhanger et al.
study, probably because of greater subcutaneous tissue compression
by the US transducer in our study.
Our study findings correlated with those of Gnaho et al. where they
have compared the depth of the subarachnoid space by ultrasound
(ED-US) & the distance between the skin and the anterior portion
of the flavum ligamentum on the needle (ED-N) and found that the
distances were not significantly different [10]; however they observed
a significant correlation between ED-US and ED-N thus supporting
the idea that the USG transverse plane allows the identification of
axial anatomical structures and provides the physician with efficient
information to perform spinal anesthesia.
The ‘saw-tooth appearance’ indicating the lamina and interlaminar
space was visible in most of our study cases. The ‘tower sign’ indicating
the spinous process was also an interesting observation during the
procedure. The ‘flying bat’ sign indicating symmetrical interlaminar
spaces was seen quite clearly after which we measured the SSD.
Our study had some limitations. We used midline approach for
LP, nevertheless when paramedian approach is used, or congenital
deformities of the spine are present, we are not sure whether this USG
based method which we have used will correctly estimate the skin to
subarachnoid space depth.
The time between USG measurement and actual performance of
the spinal block was 18 to 20 hours in our study. In parturients with PE,
edema can increase in this time period and render the results inaccurate.
The SSD measurement is thus expected to differ slightly from the
clinically observed needle depth. This degree of unpredictability could
be erased by a real time USG. However unfortunately a real time USG
was not available for our study in the OT.
Ultrasound is an operator-dependent examination. Learning
the ultrasonographic anatomy, cost, time for execution, were few
of our technical limitations. In our study, ultrasound was done by
a radiologist. It is possible that the estimation of SSD by USG was
more accurate in the latter half of the study period because of the
experience built up by us with the previous cases.
Thus, the main findings of our study were that compared to SSD
estimation by Stocker’s formula, the SSD estimation by USG method
better agrees with clinical SSD estimation in OT; nevertheless,
our study findings clearly show that SSD is greater in severe PE
compared to mild PE. Our study thus concludes that pre-procedural
ultrasonography is useful in estimating the SSD even in the presence
of back edema like in cases of PE.
References
Citation
Sutagatti JG, Kurdi MS, Bilung PA. Ultrasonographic Estimation of Skin to Sub-arachnoid Space Depth in the Pre-eclamptic Indian Parturients and its Comparison with Physical Index Based Formula− A Prospective Observational Study. Indian J Appl Radiol. 2019;5(1): 135.