


Research Article
Role of Adding T2 Mapping Sequence to the Routine Mr Imaging Protocol in the Assessment of Articular Knee Cartilage in Osteoarthritis
Kulkarni AM*, Halakoli RS, Baloj SS, Geethanjali AM, and Rao SV
Department of Radiodiagnosis, S. S. Institute of Medical Sciences and Research Centre, Davangere, Karnataka, India
*Corresponding author:Dr Akhil M Kulkarni, MD, Department of Radiodiagnosis, S. S. Institute of Medical Sciences and Research Centre, Davangere, Karnataka, India. E-mail id: drakhilmkulkarni@gmail.com
Copyright: © 2026 Kulkarni AM, et al. This is an open access article distributed under the Creative Commons Attribution License, which permits unrestricted use, distribution, and reproduction in any medium, provided the original work is properly cited.
Article Information:Submission: 20/08/2026; Accepted: 12/10/2026; Published: 17/10/2026
Abstract
Introduction:Osteoarthritis (OA) of the knee is characterized by early biochemical cartilage changes that may precede visible morphological damage. Conventional 1.5 Tesla MRI provides detailed anatomy but may be less sensitive to early matrix alterations. T2 mapping quantifies T2 relaxation and is sensitive to changes in collagen organization and tissue water content.
Methods:A prospective observational study of 50 participants (25 OA and 25 controls) was performed over two years at SSIMS & RC, Davangere. All participants underwent routine 1.5 Tesla knee MRI with an additional T2 mapping sequence. T2 relaxation values and cartilage thickness were assessed at the medial and lateral femoral condyles, medial and lateral tibial plateaus and patella. Statistical significance was set at p < 0.05.
Results:Mean T2 relaxation values were significantly higher in OA patients than in controls across all assessed compartments (p < 0.001). Cartilage thickness did not differ significantly between the groups at the femoral condyles or tibial plateaus. However, patellar cartilage was significantly thicker in the OA group than in the control group (1.88 ± 0.55 mm vs. 1.57 ± 0.36 mm; p = 0.025).
Conclusion:T2 mapping demonstrated biochemical and microstructural cartilage abnormalities before consistent morphological thinning and can be incorporated into routine 1.5 Tesla knee MRI as a quantitative adjunct for early OA assessment.
Keywords:Knee osteoarthritis; T2 mapping; Quantitative MRI; Articular cartilage; Cartilage degeneration; 1.5 Tesla MRI
Introduction
Knee osteoarthritis (OA) is characterized by progressive
biochemical and structural cartilage deterioration. Compositional
changes in collagen organization and cartilage water content may
occur before appreciable morphologic cartilage loss. Conventional
MRI is well suited to structural assessment, whereas T2 mapping
provides a quantitative measure that is sensitive to changes in cartilage
matrix organization and water mobility. The clinical interpretation of
T2 values may also be influenced by patient-related factors, including
body mass index (BMI), because increased mechanical loading
may affect cartilage composition and degeneration. Similarly, the
relationship between T2 relaxation and symptom duration or disease
chronicity is clinically relevant, as a quantitative marker that changes
with longer-standing disease could provide information beyond a
simple OA-versus-control comparison. The present study therefore
primarily compared cartilage T2 relaxation times and thickness
between patients with knee OA and controls. Where participant-level
BMI and symptom-duration data are available, their associations with
compartmental T2 relaxation should be assessed using correlation or
regression analysis rather than inferred from the group comparison.
[4,7,9-11]
Materials and Methods
Study design and setting. This was a prospective observational
study conducted in the Department of Radiodiagnosis, S. S.
Institute of Medical Sciences and Research Centre, Davangere,
over a period of two years. Participants were recruited from the
Orthopaedics outpatient service and referred for knee MRI.
Participants. Fifty participants were included in the study: 25 patients
with clinically and radiologically diagnosed knee osteoarthritis
(OA) and 25 clinically normal controls. Participants were recruited
using consecutive sampling. Exclusion criteria included MRIincompatible
implants, orthopnea or claustrophobia, knee implants,
previous trauma or knee surgery, and other contraindications to MRI.
Imaging protocol. MRI was performed on a GE Signa HDxt 1.5 Tesla
system using a knee coil. Routine knee MRI sequences were followed
by a T2 mapping sequence for quantitative assessment of articular
cartilage. T2 relaxation values and cartilage thickness were assessed
at the medial femoral condyle (MFC), lateral femoral condyle (LFC),
medial tibial plateau (MT), lateral tibial plateau (LT), and patella.
Statistics and ethics. Quantitative variables were summarized as mean
± standard deviation and qualitative variables as frequencies and
percentages. Data were analyzed using SPSS version 25.0, with p <
0.05 considered statistically significant. Institutional ethics approval
was obtained and written informed consent was obtained from all
participants.
Results
The study population had a mean age of 68.4 ± 9.47 years. The
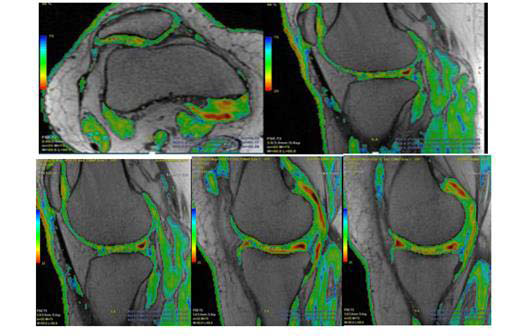

OA group had a mean age of 68.60 ± 10.19 years and the control
group 68.20 ± 8.91 years. Females constituted 62% of the overall
cohort (31/50). Across all five evaluated cartilage compartments,
T2 relaxation values were significantly higher in the OA group. In
contrast, cartilage thickness showed no statistically significant group
difference at the MFC, LFC, MT or LT; the only significant thickness
difference was at the patella, where cartilage was thicker in the OA
group. The available manuscript does not provide participant-level
BMI or symptom-duration data. Therefore, the relationship between
BMI and T2 relaxation, and the relationship between T2 relaxation
and duration of symptoms or OA chronicity, could not be statistically
evaluated from the supplied dataset.
Discussion
The principal finding of this study was a consistent elevation of
T2 relaxation values in OA cartilage across the medial and lateral
femoral condyles, tibial plateaus and patella, despite largely preserved
cartilage thickness. This supports the concept that compositional
cartilage abnormalities can be detected before consistent morphologic
thinning. Prolonged T2 relaxation is compatible with disruption of
the collagen network and increased water mobility within the cartilage
extracellular matrix. The magnitude of the between-group differences
was substantial in all five compartments (approximately 7–11 ms),
with p < 0.001 for each comparison, indicating a statistically robust
group separation in this cohort. However, statistical significance
should not be equated with an established diagnostic threshold
or with clinical severity, because the study was small and crosssectional
and no longitudinal clinical outcome was assessed.
BMI is a potentially important modifier of cartilage T2 values.
Higher body mass may increase mechanical loading across the knee
and may be associated with cartilage degeneration, which could
in turn influence T2 relaxation. Accordingly, an observed BMI–
T2 association would need to be distinguished from the effect of
OA itself, ideally by using participant-level data and multivariable
regression adjusting for age, sex and OA status. Such an analysis was
not possible in the present manuscript because participant-level BMI
measurements were not included in the available dataset. Therefore,
the current results should not be interpreted as demonstrating either
a positive or negative association between BMI and T2 relaxation.
Symptom duration and disease chronicity are also relevant to
interpretation. T2 mapping reflects tissue composition rather than
symptom duration directly, and patients with similar symptom
duration may have different structural and biochemical stages of OA.
Conversely, prolonged disease may be associated with progressive
matrix disruption and potentially higher T2 values, although this
relationship cannot be established from the present cross-sectional
group comparison. Because individual symptom duration, disease onset
timing or a formal chronicity classification was not available
in the supplied dataset, no valid correlation, trend analysis or acuteversus-
chronic comparison could be performed. Importantly, the
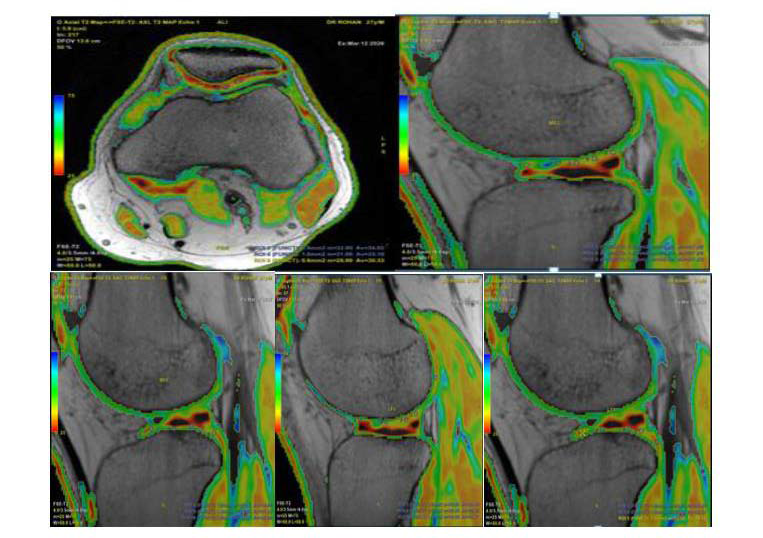
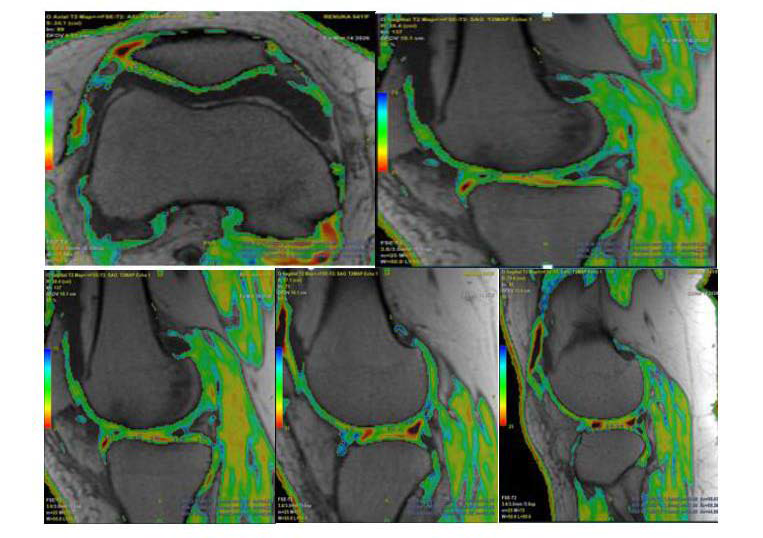
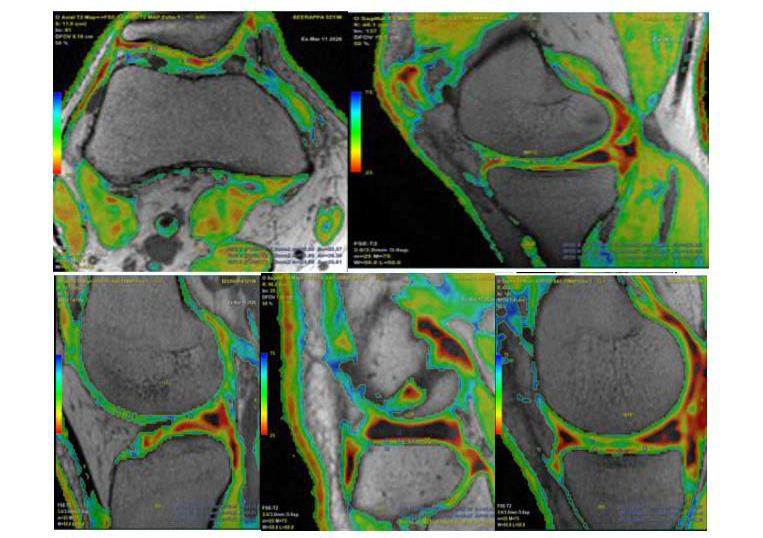
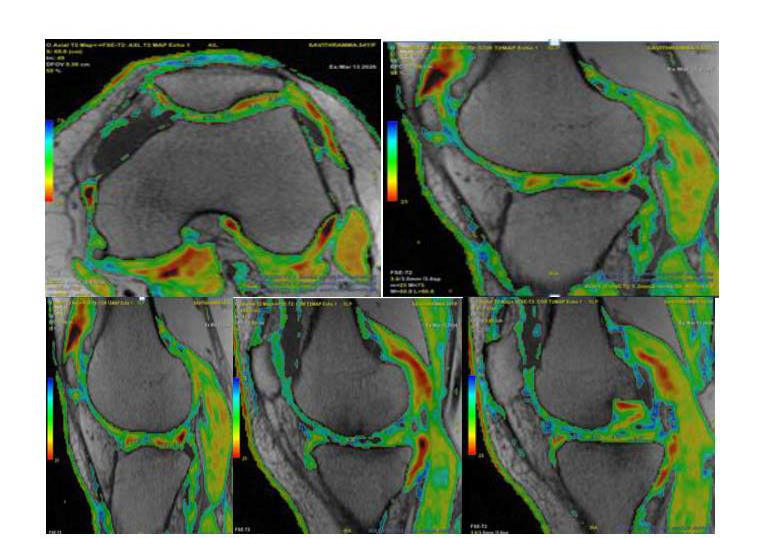
representative images in the manuscript illustrate a range of T2 values
in individuals with and without symptoms, but these examples are
descriptive and cannot substitute for participant-level statistical analysis.
The lack of significant thickness differences at most compartments,
despite consistently elevated T2 values, further emphasizes the
complementary role of compositional imaging. The higher patellar
thickness observed in the OA group may reflect early cartilage swelling
or measurement variability, but this finding should be interpreted
cautiously because the study was not designed to establish the
mechanism of thickness increase. Absolute T2 values should also be
interpreted in the context of field strength, sequence parameters, ROI
placement, loading state and other technical and biological sources
of variation. Overall, the study supports the feasibility of adding T2
mapping to routine 1.5-T knee MRI, while the associations of T2 with
BMI and disease duration remain important questions for adequately
powered studies with detailed clinical metadata. [4,7,9–11]
[4,7,9,10] [7,9,10]
Limitations
Limitations included the single-centre design, relatively small
sample size, use of a 1.5 Tesla scanner, lack of longitudinal followup,
absence of histopathological or arthroscopic correlation,
possible biological and technical variability in T2 measurements,
and potential segmentation or partial-volume effects in cartilage
thickness measurements. Most importantly, participant-level BMI
and symptom-duration/chronicity variables were not available in
the dataset supplied for this manuscript, preventing valid secondary
analyses of BMI–T2 association and T2 variation according to
symptom duration or disease chronicity. These relationships should
be evaluated in future studies using participant-level clinical data
and appropriate multivariable statistical methods. Other quantitative
techniques such as T1rho and dGEMRIC were not evaluated
extensively.
Conclusion
T2 mapping demonstrated significantly higher cartilage T2
relaxation values in OA than in controls across all five evaluated
compartments, while cartilage thickness was largely preserved. These
findings support T2 mapping as a complementary compositional
technique for detecting cartilage abnormalities that may precede
consistent morphologic loss. The present dataset does not permit
conclusions regarding BMI-related variation or the effect of symptom
duration/disease chronicity on T2 relaxation; these associations
require participant-level clinical data and dedicated statistical analysis.
Learning Points:
1. T2 mapping can detect cartilage biochemical and microstructural
abnormalities before consistent morphological thinning becomes
apparent.2. In this cohort, T2 values were significantly higher in OA cartilage at all five assessed compartments.
3. Cartilage thickness was not significantly different at the femoral condyles or tibial plateaus; patellar thickness was higher in OA.
4. BMI and symptom duration are clinically relevant potential modifiers of T2 relaxation, but their associations could not be tested because participant-level data were unavailable in the supplied dataset.
5. Interpretation of absolute T2 values should account for field strength, acquisition parameters, ROI technique and biological variability.
6. Adding T2 mapping to a routine 1.5 Tesla knee MRI protocol is feasible and provides quantitative information complementary to morphology.
7. In this cohort, T2 values were significantly higher in OA cartilage at all five assessed compartments.
8. Cartilage thickness was not significantly different at the femoral condyles or tibial plateaus; patellar thickness was higher in OA.
9. Interpretation of absolute T2 values should account for field strength, acquisition parameters, ROI technique and biological variability.
10. Adding T2 mapping to a routine 1.5 Tesla knee MRI protocol is feasible and provides quantitative information complementary to morphology.
Ethics and Consent:
The study was conducted in accordance with the ethical principles
of the Declaration of Helsinki. Ethical clearance was obtained from
the Institutional Ethics Review Board of S. S. Institute of Medical
Sciences and Research Centre, Davangere, Karnataka, India. Written
informed consent was obtained from all participants.Conflict of Interest:
To be confirmed by the authors before submission.References
Citation
Kulkarni AM, Halakoli RS, Baloj SS, Geethanjali AM, Rao SV, Uppin MS. Role of Adding T2 Mapping Sequence to the Routine Mr Imaging Protocol in the Assessment of Articular Knee Cartilage in Osteoarthritis. Indian J Appl Radiol. 2026;12(1): 241.