Research Article
Comparative Analysis of Bottled Mineral Water and Municipal Tap Water Samples from Different Parts of Hyderabad
Madhuri A*, Tanushree J, Raveena G, Sowmya Sri M, Tabassum A, Amreen M and Nagasree PV
Department of Microbiology, Government Degree College for Women, Begumpet (Autonomous), Hyderabad, Telangana, India
*Corresponding author: Madhuri A, Department of Microbiology, Government Degree College for Women, Begumpet
(Autonomous), Hyderabad, Telangana, India; E-mail: a.madhuri108@gmail.com
Article Information: Submission: 17/03/2023; Accepted: 19/04/2023; Published: 24/04/2023
Copyright: © 2023 Madhuri A, et al. This is an open access article distributed under the Creative Commons Attribution
License, which permits unrestricted use, distribution, and reproduction in any medium, provided the original work is
properly cited.
Abstract
Recently, the consumption of bottled water has increased significantly, even though the quality of tap water is considered excellent, which contributes
to plastic pollution. Moreover, it is recommended worldwide to reduce the use of plastic, as its consumption is increasing at an alarming rate. Therefore, this
study aims to make a comparison between tap water and bottled water and to show the reasons for choosing bottled water, which is less convenient and
often more expensive than tap water. In this study, a total of 20 samples were collected from different parts of Hyderabad and analyzed for bacteriological
quality using MPN method and heterotrophic plate count method. Other factors like pH, electrical conductivity (EC) and TDS value were also checked. For
bottled water samples, pH was in the acidic range in most cases, which is not good for health, while for tap water it was within the permissible limits, i.e., in
the neutral range. The TDS value was very low in most samples of bottled water, while in tap water samples it was in the acceptable range. The number of
viable bacteria ranged from 1160 to 9500 CFU for the different bottled water samples and from 1400 (T20) to 10170 CFU (T19) for the tap water samples.
The MPN index was zero for all bottled water samples, indicating that they did not contain coliform bacteria or indicator organisms. In the tap water samples,
the highest MPN count (17) was found in samples T3, T6, T12, T19, and T13, while the other samples had varying degrees of E. coli contamination. In this
study, we isolated Pseudomonas from the bottled water samples of B16 and Staphylococcus from samples B5, B7, B11, and B14. There is a possibility
that these microbes may cause opportunistic infections in immunocompromised individuals. Similarly, E. coli was isolated from samples of T3, T5, and T6.
Staphylococci were isolated from samples of T9, T14, T16 and Pseudomonas from T16 and T17.
Keywords
Muicipal tap water; Bottled mineral water; Coliform bacteria; Heterotrophic plate count; IM ViC; Most probable number
Abbreviations
WHO- World health organization; CFU- colony forming unit;
HPC- heterotrophic plate count; MPN- most probable number; ECelectric
conductivity; TDS- total dissolved solids; SDGs- sustainable
development goals; CAGR- compound annual growth rate; POEpoint
of entry systems; POU- point of use; BIS- bureau of Indian
standards; APHA- American public health organization; IBWAinternational
bottled water association
Introduction
Safe drinking water is vital to human life. It is generally believed that bottled mineral water is safe for humans. For long-distance
travelers, it is the only source of reliable drinking water. However,
several studies have shown that bottled mineral water does not always
meet the required standards. Access to quality drinking water and
sanitation for all is an important public health and development issue
identified in the sixth goal of the Sustainable Development Goals
(SDGs) and supported by all nations worldwide. However, over
771 million people worldwide still lack access to improved sources of
drinking water sources [1].
The usage rate of bottled mineral drinking water is around 27% in
some parts of Asia [2]. In terms of bottled mineral water consumption, India is among the top ten countries in the world. Bottled mineral
water companies are one of the fastest growing industries and
currently there are more than 3400 bottling plants in India, half of
which are in the southern regions of India [3]. Most of the bottled
water passed off as mineral water in India, however, is filtered, boiled,
or purified by other means such as chlorination, deionization, and
reverse osmosis. A better description of bottled drinking water sold
in India, therefore, would be ‘‘purified bottled water’’. The nonexistence
of strict norms on bottled drinking water in India has led
to the mushrooming of many small-scale units producing bottled
water under different brand names [4]. However, as the demand
has increased, serious concerns about the quality and safety of the
water have also arisen. The chemical and microbiological quality of
bottled mineral water has been found to violate national standards
by some manufacturers [5]. Studies conducted in India and other
parts of the world have found that bottled water was contaminated
with pathogens at various stages of its production [6]. Consumption
of contaminated water has led to frequent outbreaks of waterborne
diseases such as cholera, typhoid, and hepatitis A and E in India [7].
The production facilities of most companies producing bottled
mineral water in India are located in unhygienic places such as
agricultural fields or estates. Most companies use bore wells as a
source of water. Here, water is pumped from a depth of 80 to 500
feet underground [8]. The less likely sources of packaged water are
from public drinking water systems such as municipal water supplies
[9]. Therefore, regular monitoring of packaged drinking water such
as bottled mineral water is very important. It serves the dual purpose
of monitoring the standards of bottled mineral water producers
and providing a quality assurance to consumers. The present study
was therefore conducted to assess the bacteriological and physical
quality of bottled mineral water marketed in the major transit areas
of Hyderabad and whether it meets national standards. Along with
that municipal tap water samples from different parts of Hyderabad
were also analysed and compared with the quality of bottled drinking
water.
Review of Literature
The largest beverage market in the world is the bottled mineral
water market. The global bottled mineral water market was valued at
USD 283.01 billion in 2021 and is expected to grow at a compound
annual growth rate (CAGR) of 6.7% from 2022 to 2030. Increasing
concerns about various health issues such as gastrointestinal diseases
caused by consumption of contaminated water is leading to increased
demand for clean and hygienically packaged options [10]. The overall
recycling rate for bottles was 27.2% in 2020 [11]. Bottled mineral water
is also subject to several criticisms. First, there are no longer significant
quality differences between bottled mineral and municipal tap water
in many water supply systems. Modern water treatment systems can
eliminate the organoleptic impairments that were once common.
In fact, blind tests show that consumers do not perceive significant
differences between the two waters when they are simply treated [12].
In this context, it is important to consider that a significant portion of
bottled mineral water is, in some cases, nothing more than municipal
tap water that has been treated to meet chemical, microbiological,
and radiological safety requirements applicable to bottled mineral water [13]. Second, the cost of delivery, including energy and
packaging [14], is another major issue with bottled mineral water,
which is between 240 and 10,000 times more expensive per liter than
municipal tap water [15]. Third, plastic waste, most of which ends
up in landfills or contributes to the concentration of microplastics
in the oceans [16], is another important issue. The environmental
costs of bottled water, including those related to energy demand,
embedded CO2 emissions, or waste production, are reported to be 100
times higher than municipal tap water [17]. Fourth, environmental
and human health concerns associated with bottled mineral water
are also increasing, particularly in the context of plastic bottles and
exacerbated by current concerns about microplastics in water. A
recent U.S. study concluded that consumers of bottled mineral water
could invest up to 90,000 plastic particles in their water each year,
compared to 4,000 for those who drink tap water [18]. However, a
recent report by the World Health Organization (WHO) concluded
that there were no significant health risks, but again cautioned that
further research was needed [1]. Leaching of other chemicals such as
BPA or antimony into bottled water also remains an important issue.
As mentioned in the introduction, a second strategy for addressing
drinking water quality problems is to use a variety of water treatment
systems for domestic use. These systems are divided into two main
categories: Point-of-Entry systems (POE), which are installed at
the entrance of water into the household (e.g., water softeners,
disinfection devices, etc.), and Point-of-Use (POU) systems, which
can be installed directly into one of the water sources available in
the household (reverse osmosis, activated carbon filters, etc.) [20].
POU systems have lower capacity and higher operating costs but are
cheaper and easier to install than POE. Of all these systems, jugs or
bottles dominate the market in terms of sales and value. The success
of bottles can be attributed to their low cost and the fact that they
do not require installation Markets. Point-of-use water treatment
systems market by equipment [21].
Bottled mineral water manufacturers must obtain ISI certification
from the Bureau of Indian Standards (BIS). The BIS tests water samples
from these systems at an independent laboratory. Only if the samples
are found to be safe does the plant receive official confirmation and a
license number [9,22,23].
The various treatment processes for factory-packaged drinking
water are decantation, sand filtration, silver ionization, ion exchange,
and reverse osmosis. Among chemical disinfectants, free chlorine
is most used for water treatment. Tanks are visually inspected for
suspended solids and leaks using an illuminated screen [9].
Despite all these protective measures, the presence of impurities
in the bottled mineral water indicates that the treatment process in
the plants is not effective [8]. Therefore, it was necessary to verify the
quality of the bottled mineral water available at this site.
Materials & Methods
Study Area and Sample Collection:
This project is carried out in Hyderabad, Telangana State.Collection of Samples:
A total of 20 samples of bottled mineral water samples (20 brands) and 20 municipal tap water samples were collected from
different parts of Hyderabad. The bottled mineral water samples
were checked for good condition with intact caps and protective seals
before purchase. The date of manufacture and batch numbers were
documented. Municipal tap water samples were collected in sterile
containers. They were taken to the laboratory and analyzed for total
bacterial load and the presence of bacterial indicators of drinking
water quality. For the purposes of this study, the bottled mineral water
brands were coded B1- B20 and the municipal tap water samples were
coded T1-T20. Samples were stored at 4°C until further analysis, and
water quality parameter analysis was performed according to the
standard methods of Martel et al. (2006) [24], APHA (2012) [25], and
IBWA (2012) [26]. Inoculations into selective media were performed
within 24 hours of water sample collection (Figure 1).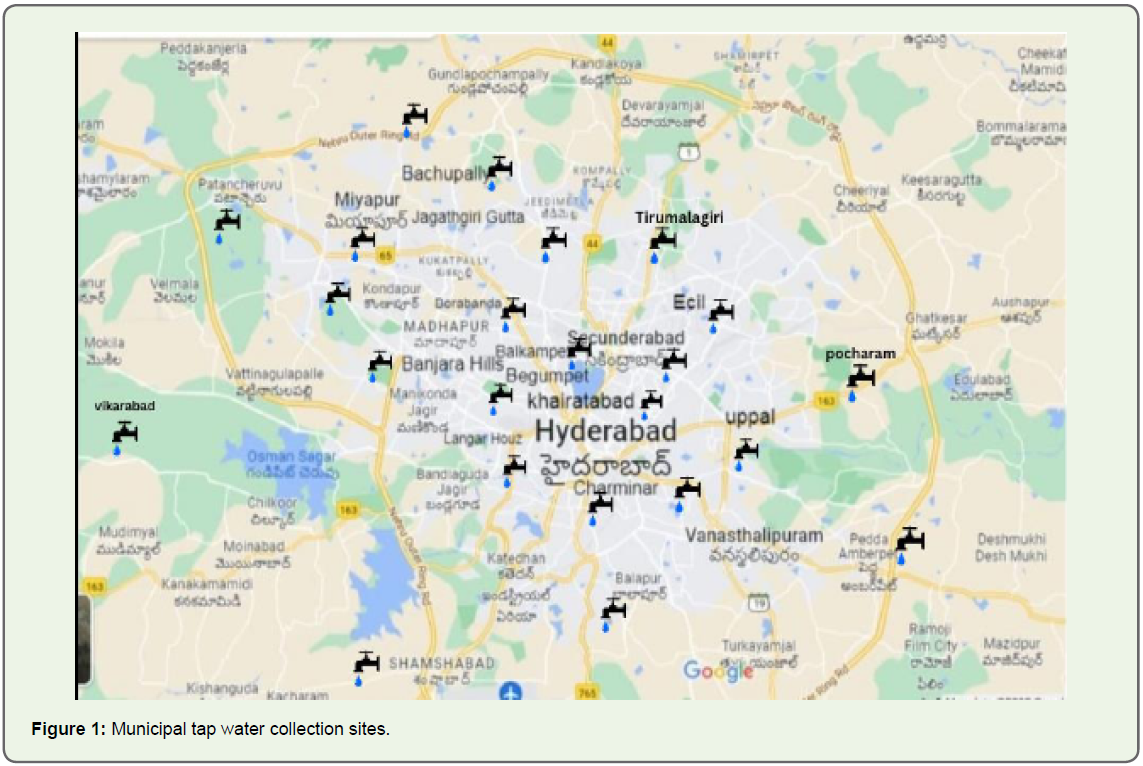
The samples were examined individually. They were subjected to
chemical and bacteriological examination. The analytical procedure
was carried out according to the standard methods for the analysis of
water and wastewater [26].
Chemical Parameters:
pH and Conductivity (EC): The pH is measured with a pH meter
and EC with a digital electrical conductivity meter, which provides
the direct value of pH and EC according to the instructions of the
American Public Health Organization (APHA, 2012) [25].
Total Dissolved Solids (TDS): Total dissolved solids are
determined using a digital pocket TDS meter. Premium and routine
bench top instruments allow measurement of Electrical conductivity
(μS/cm, mS/cm) and TDS (mg/L).
Microbiological parameters:
Total heterotrophic plate count (HPC), most probable number
of coliform bacteria and IMViC test for differentiation of coliform
bacteria were also determined in 20 municipal tap water samples and
20 bottled mineral water samples.Determination of total heterotrophic bacteria:
Heterotrophic bacteria were counted by both serial dilution and
pour plate technique (HPC). Serial 10-fold dilutions were performed
in sterile water, and 1 ml of each dilution was aseptically placed in
sterile Petri dishes in triplicate. Then 20 ml of agar cooled to 45°C was
added to each of the plates and mixed thoroughly. The mixture was
allowed to solidify, and the plates were incubated at 37°C for 24-72
hours. The number of bacterial colonies were counted and expressed
as CFU (colony forming units) per milliliter. Heterotrophic plate
count (HPC) was determined using the pour plate technique as
described in Standard Methods (APHA, 2005) [25].MPN test:
The purity of drinking water with respect to bacterial contaminants is evaluated by testing for the presence of coliform bacteria, as they
are considered indicator organisms for fecal contamination. The
coliform bacteria in the water sample were determined using the
MPN (Most Probable Number) test or the multiple tube fermentation
tests. This test is performed sequentially in 3 steps:1) Presumptive coliform test:
This test detects coliforms in water samples. In this test, lactose
fermentation tubes (Mac-Conkey broth) are inoculated with water
samples and checked for production of acid and gas from lactose
fermentation within 48 hours in any of the tubes is the presumptive
detection of coliforms in the water sample.
(a) 10 mL of the water sample was inoculated into each of the 3
tubes with 10 mL of the double strength of Mac-Conkey broth.
(b) 1 mL of the water sample was inoculated into each of the 3
tubes with 9 mL of single strength Mac-Conkey broth.
(c) 0.1 mL of the water sample was inoculated into each of the 3
tubes containing 9.9 mL of the single strength Mac-Conkey broth.
All inoculated tubes were incubated at 37°C for 24 hours. After
incubation, the tubes that had produced gas were counted. The tubes
with negative results were incubated for another 24 hours at 37°C.
The tubes that showed gas production were further inoculated for the
confirmatory test.
2) Confirmed coliform test:
This test is used to confirm the presence of coliforms and to
determine the MPN level in the water sample. In this test, water
samples from all positive tubes were inoculated with Mac-Conkey
broth into two sets of tubes containing Brilliant Green Lactose Bile
Salt (BGLB) broth and one set was incubated at 37°C for 24-48 hours
for total coliforms and another set was incubated at 44°C in a water
bath for 24 hours for fecal coliforms. Positively confirmed tubes were
used to determine MPN/100ml by the statistical method (MPN table).
3) Completed coliform test:
This test is used to determine the presence of total coliforms as
MPN/100ml in a water sample. A positive tube from the confirmatory
test was streaked onto a plate of EMB agar and incubated at 37°C for
24 hours. After 24 hours, colonies with typical growth (dark center
with greenish metallic sheen) and atypical growth were transferred
to Nutrient agar and Mac Conkey Broth and incubated for 24 hours
at 37°C. By Gram staining, the presence of total coliform and fecal
coliform bacteria was further confirmed [27].
IMViC tests:
Different colonies (10) from samples of bottled mineral and
municipal tap water were selected based on their morphology. These
organisms were subjected to IMViC tests for identification [25].Results
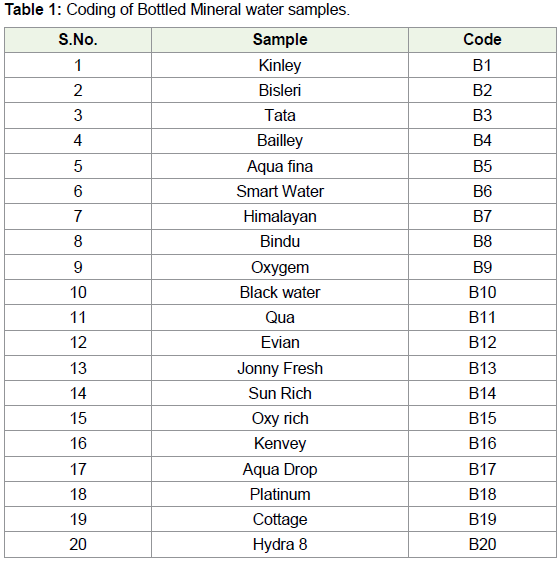
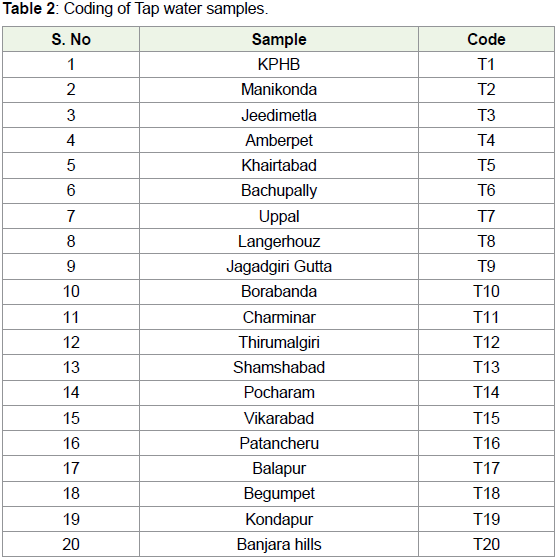
For convenience, different water samples were given coding i.e.,
from B1 to B20 for bottled mineral water samples and T1 to T20 for
Municipal tap water samples. The details of the same were given in
Table 1 and Table 2.
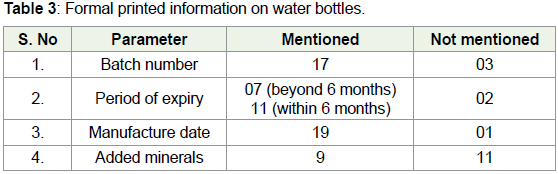
As mentioned in the methodology, 20 samples of bottled mineral
water were collected from different retail outlets in different parts of
Hyderabad. Out of these 20 samples, 9 were from local brands, 5 from
national brands and 6 from international brands. The collected samples
were checked for formal data such as batch number, manufacturing
period, expiry date, added minerals, manufacturer etc. It was found
that in 3 samples the batch number was not indicated. In 7 samples,
the expiry date was more than 6 months after the manufacturing date
and in 11 samples it was within 6 months. In the 2 other samples the
expiry date was not indicated (Table 3).
Physicochemical parameters:
Standard methods were used for the analysis of physicochemical
water quality parameters. Parameters analyzed were pH, total
dissolved solids (TDS), Electrical conductivity [28].pH:
pH is an extremely important variable because it determines
the solubility of most metals and because most microorganisms can
survive within a narrow pH range. Proper chemical treatment of
water, including disinfection, requires control of pH. The pH values
obtained are within the WHO standards of 6.5to 8.5. pH has no direct
adverse effect on health [29]. Waters with pH below 4 have an acidic
taste and above 8.5 have an alkaline-bitter taste. A high pH leads to
the formation of Trihalomethanes, which are toxic [30]. At pH below
6.5, corrosion in the pipes starts, releasing toxic metals such as Zn,
Pb, Cd, and Cu, etc. Of the total 20 samples analyzed, the lowest pH
of 4.4 was found in sample B3 and the highest value of 6.49 was found
in sample B11 (Figure 2). This shows that all 20 bottled mineral water
samples are not within the prescribed range, with only the sample
showing the highest value being closer to the prescribed range, at 6.5.
This is significant in that drinking water with a neutral pH is preferred
for the effective functioning of our bodies.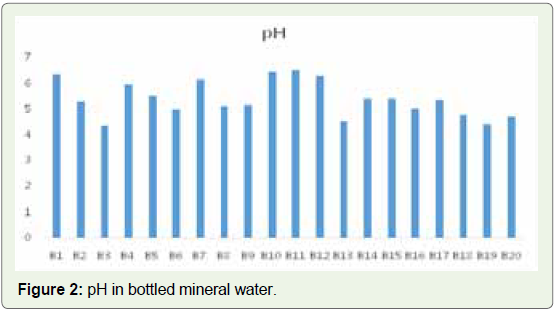
In the 20 samples of municipal tap water tested, 12 samples had
their pH in the prescribed range, i.e., above 6.5, while sample T13
had the lowest pH of 5.78 and the highest pH of 6.79 was recorded in
sample T17 (Figure 3).

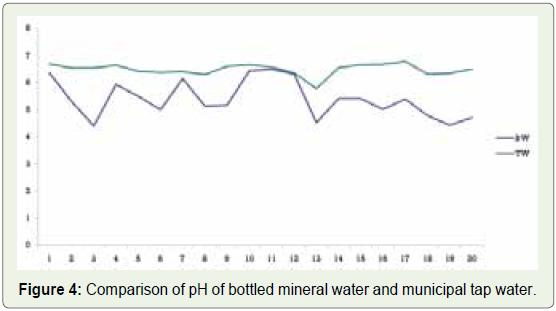
When comparing bottled mineral water and municipal tap water,
many municipal taps water samples showed pH in the prescribed
range, while none of the bottled mineral water samples showed pH in
the required range (Figure 4).
According to Dehghani Mohsen et al. in their study in Iran, a
mean pH of 7.5 was found in the range of 7.1 to 8.2 in bottled
mineral water samples [31]. According to Jersey et al (2019), the
average pH of municipal tap water was 6.595 and bottled mineral
water was 6.55. Low pH increases the dissolution/absorption of toxic
substances [32,33]. Prolonged consumption of this water can lead
to hyperacidity, which health experts believe can lead to cancer or
cardiovascular damage, including constriction of blood vessels and
reduction of oxygen supply, even at low levels.
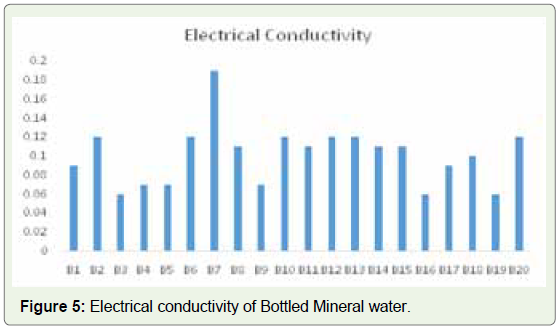
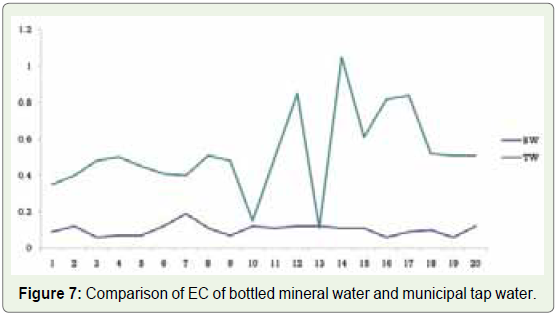
Electrical conductivity:
Pure water is not a good conductor of electric current but is a
good insulator. With the increasing concentration of ions in water,
the electrical conductivity increases. In general, the number of
dissolved solids in water determines the electrical conductivity.
Electrical conductivity (EC) measures the ionic process of a solution
that enables it to conduct electricity.Pure water is not a good conductor of electric current, but rather a
good insulator, and increasing the concentration of ions increases the
electrical conductivity of water [34], however, a high concentration
of electrical conductivity has no medical effects (SON, 2007) [35].
Typical values of conductivity for drinking water range from 50 μS/
cm to 1500 μS/cm [36]. According to Reda 2016, the permissible limit
for electrical conductivity (EC) is 300 μS cm-1 or 0.3 mS cm-1 [37].
The values of conductivity for our samples ranged from a minimum
of 0.06 ms/cm for samples of B3, B16 and a maximum of 0.19 ms/cm
for B7 (Figure 5).
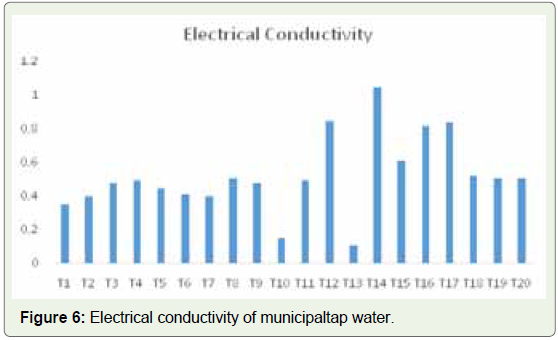
The electrical conductivity for the municipal tap water samples
also ranged from 0.11 to 1.05 ms/cm. The lowest value was found in
sample T13 and the highest in sample T15 (Figure 6). These values clearly show that the samples of bottled mineral and municipal tap
water are within the prescribed limit (Figure 7).
According to Marjan and Aliakbar (2022), the EC values for
bottled mineral water ranged from 0.105 mS (105 mS) to 0.473 mS
(473 mS). For municipal tap water samples, the EC values ranged
from 0.478 mS (478 mS) to 0.872 mS (872 mS) [38].
In another study by Uddin, M.R et. al (2021), the values of EC for
bottled mineral water ranged from 7.12 mS to 433.8 mS [39].
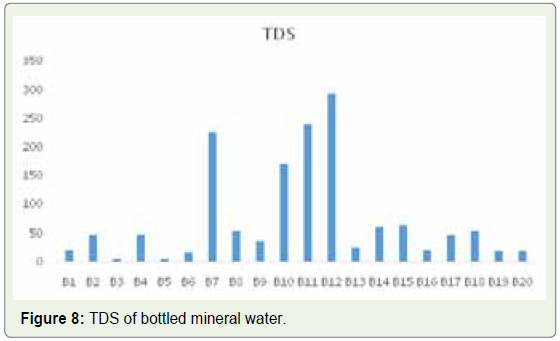
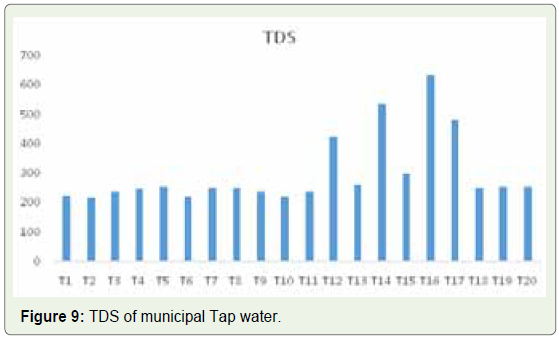
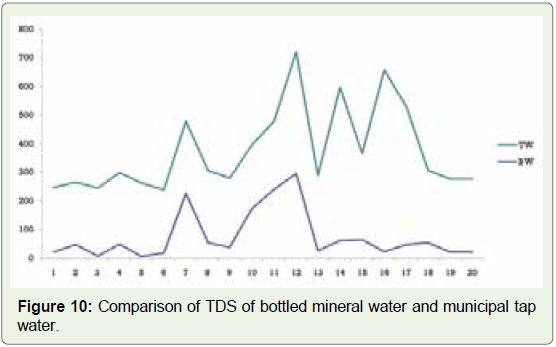
Total Dissolved Solids (TDS): TDS affects water quality in
different ways. Excessive TDS gives the water a bad taste due to
mineralization of various salts. A dissolved solid of more than 2000
mg/l has a laxative effect [40,41]. This is due to magnesium sulphate
along with some sodium sulphate. Sodium components affect cardiac
part and women with pregnancy related toxemia [42]. According to
the Bureau of Indian Standards (BIS), the upper limit for TDS content
in water is 500 ppm. However, the TDS level recommended by WHO
is 300 ppm [42,43]. According to one report [44], minerals such as
sodium, calcium, magnesium, etc. may be absent at 0-250 ppm. In
our study, we found that bottled mineral water had a TDS value of 5
in B5 and 294 in B12 (Figure 8). In municipal tap water samples, on
the other hand, the lowest value of 218 was found in sample T2 and
the highest of 634 in sample T16 (Figure 9). Based on these data, we
could conclude that bottled mineral water samples have lower TDS
value than municipal tap water samples (Figure 10). Although no
clear health symptoms are reported due to consumption of low TDS,
Lee T. Rozelle (1996) states that it can be corrosive and lead to some
minor health problems [45].
Ndinwa et al. (2012) recorded values ranging from 2.47 to 62.3
mg/l in bottled mineral water samples in Delta State, Nigeria [46],
while Ajayi et al (2008) recorded high values ranging from 78.0 to
180 mg/l in Ibadan, Nigeria [47]. The total dissolved solids content of
drinking water varies from 20 mg/l to 1000 mg/l and consists mainly
of inorganic salts, some organic substances, and dissolved gases [35].
The palatability of water with a TDS content of less than 600 mg/
liter is generally considered good; when the TDS content exceeds
1000 mg/liter, the drinking water becomes distinctly and increasingly
unpalatable (WHO, 2011) [48].
Heterotrophic plate count:
The World Health Organization (WHO) recommends that
drinking water should have less than 20 CFU/ml of heterotrophic
bacteria, excluding coliform bacteria, fecal coliform bacteria, E. coli,
Enterococci, and P. aeruginosa [49]. In our results, we found that the
CFU for heterotrophic bacteria in bottled mineral water ranges from
1160 to 9500 CFU/ml. in sample B13, 1160 and in sample B5, the
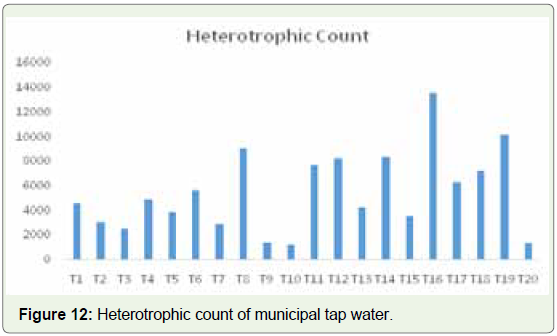
highest value of 9500 CFU/ml was found (Figure 11). In Municipal
tap water samples, the HPC range is from 1200 in T10 to 13550
CFU/ml in sample T16 (Figure 12). This is of concern as the live
cells in the water samples exceed the limit recommended by WHO.
Consumption of such bottled mineral water may also have a negative
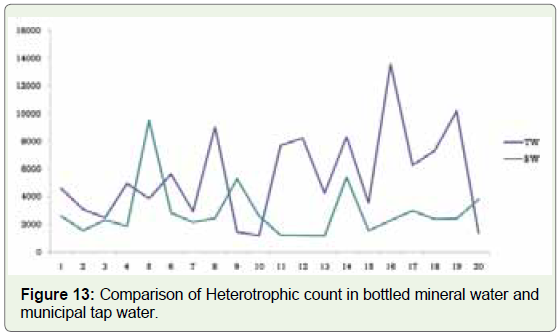
impact on immunocompromised patients. In terms of HPC, there
is not much difference between bottled mineral and municipal tap
water samples (Figure 13). In municipal tap water, the number was
relatively high, which could be due to the distance the water travels
from the purification point to the consumer. Bacteria in bottled
mineral water may originate from a natural water source or be
introduced during the bottling process [50]. Rapid growth of bacteria
prior to bottled mineral water may be due to increased surface area,
increased temperature during storage, and trace nutrients during
storage [51].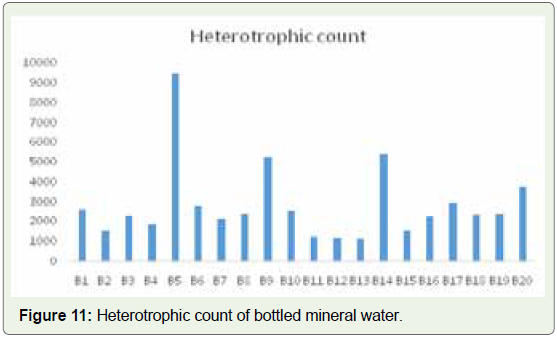
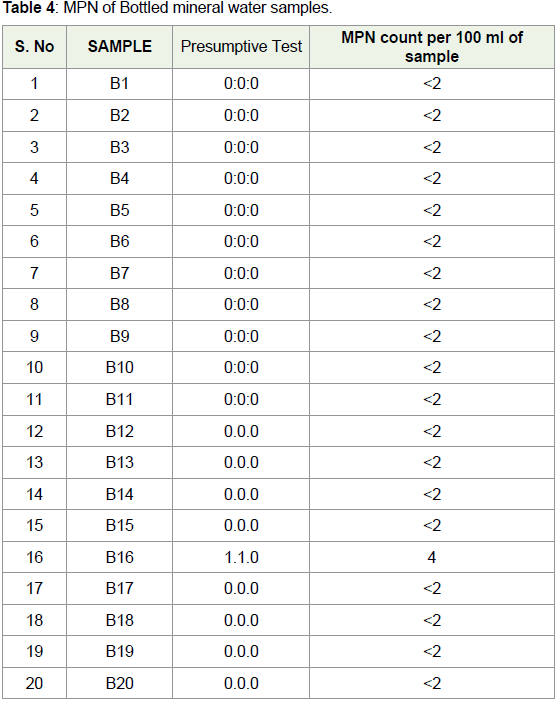
In B16 sample, MPN index was 4 indicating the presence of E. coli
in the sample. For all other bottled mineral water samples, the MPN
index was less than 2, assuring the absence of E. coli.
In municipal tap water samples, T1, T3, T5, T6, T10, T12, T13,
T16 and T19 shows the MPN index more than 2. It shows 45% of the
samples were contaminated with the presence of E. coli and hence
with sewage water.
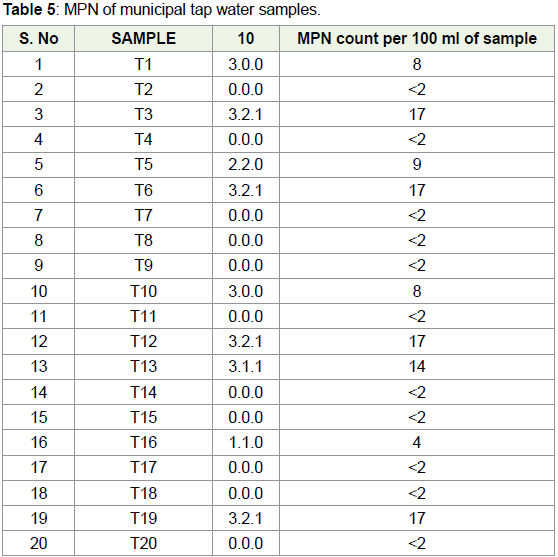
MPN was negative for all bottled mineral water samples showing
absence of E. coli in the given samples (Table 4). For municipal tap
water samples, MPN was in the range of <2 to 17. Out of 20 samples,
in 55% samples, MPN was <2 showing absence of E. coli. In remaining
samples, highest MPN value i.e., of 17 cells / was observed in 20% of
samples (Table 5). MPN was very high in municipal tap water samples
when compared to bottled mineral water samples (Figure 14).
Escherichia coli was detected in 5 out of 19 bottled mineral water
samples by SeinnSandar May Phyo et al. (2019) [52]. According to a
report in Deccan Chronicle, Escherichia coli bacteria were found in
Alwal and Saroor Nagar drinking water at the rate of 1,600 per 100 ml
of water in a water quality report by the Institute of Health Systems
for March 2016. A similar result was also reported by Rasheed et al,
2009 [53].
IMViC:
Based on colony morphology, 10 bacteria were identified and
subjected to IMViC test. Based on the IMViC results, we confirmed
that Pseudomonas was present in sample B16 and Staphylococcus
was present in samples B5, B7, B11 and B14. In municipal tap water,
however, E. coli was present in samples T3, T5, and T6. Similarly,
Staphylococcus was detected in samples T9, T14 and T16. Pseudomonas
was present in samples T16 and T17 (Table 6). Pseudomonas aeruginosa
has been shown to be a persistent contaminant of aquatic plants [54].
This organism is an opportunistic pathogen whose ingestion can cause
infections in immunocompromised individuals [55]. Pseudomonas
aeruginosa is also known for its resistance to many antimicrobial
agents, which complicates the treatment of infections caused by this
organism. For this reason, testing for the presence of Pseudomonas
species in drinking water has been proposed as a means of monitoring
the hygienic quality of drinking water [48]. Staphylococcus aureus is
an indicator of poor hygiene practices in bottled mineral water and
was likely introduced into samples by personnel involved in water treatment [48]. The presence of Staphylococcus aureus in the water
samples suggests that the bottled mineral water samples in this study
were contaminated not only by the factory environment but also by
the people who met any part of the bottling process [56]. A likely
source of this bacterial contamination is the use of bare hands during
the various stages of bottled water production.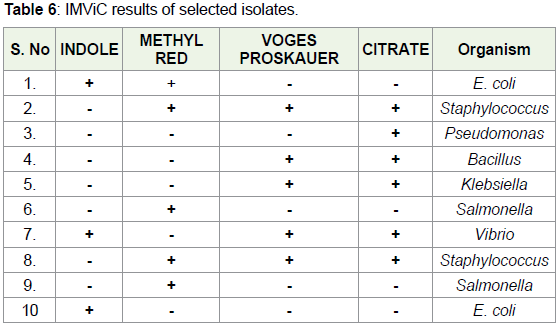
Conclusion
Recently, plastic pollution of land and water has become a
worldwide problem, to which bottled water also contributes. To
address this problem, this study was conducted that could raise
awareness to reduce the use of bottled water and regain confidence
in tap water. In our studies, it was found that bottled mineral
water from reputable companies such as B2, B1, etc. is considered
safer than that from small companies such as B16, B7, B5, and B11.
Nowadays, there is a trend in the market to produce bottles that
look like branded bottles. This confuses customers and makes them
victims of adulteration. In terms of pH, EC, and TDS, tap water is
better than bottled water samples. The Heterotrophic count is also
very high and not within the recommended limits for bottled water
samples. The only positive factor observed with bottled water is the
absence of coliforms but at the same time other microorganisms such
as Pseudomonas and Staphylococcus have been isolated from bottled
water, which can cause opportunistic infections in consumers. It
is best to consume boiled, municipal treated water or use regular
bacterial filters instead of reverse osmosis purification systems. The
disadvantage of reverse osmosis purification systems is high water
loss along with loss of minerals, change in pH, etc.
Acknowledgment
We would like to acknowledge, Principal, Government Degree
College for Women, Begumpet for financial assistance. We also
acknowledge Ms. Rohini, Head, Dept. Of Biotechnology for her
support.
References
45. Rozelle LT (1996) Huamn health effects due to consumption of low TDS water. Membrane J 6: 189-195.
Citation
Madhuri A, Tanushree J, Raveena G, Sowmya Sri M, Tabassum A, et al. Comparative Analysis of Bottled Mineral Water and Municipal Tap Water Samples from Different Parts of Hyderabad. J Environ Soc Sci. 2023;8(1): 130.