Research Article
Visual Representations of Climate Change - A Case Study of Canada
Morris S1,2 and Pickering GJ1,3-6*
1Environmental Sustainability Research Centre, Canada
2Department of Geography and Tourism Studies, Canada
3Cool Climate Oenology and Viticulture Institute, Canada
4Departments of Biological Sciences and Psychology, Brock University, Canada
5Charles Sturt University, Australia
6University of the Sunshine Coast, Australia
Corresponding author: Pickering GJ, Brock University, 1812 Sir Isaac Brock Way, St. Catharines, Ontario L2S 3A1, Canada, E-mail: gpickering@brocku.ca
Citation: Morris S, Pickering GJ. Visual Representations of Climate Change - A Case Study of Canada. J Environ Soc Sci. 2019;6(1): 139
Copyright ©2019 Morris S, et al. This is an open access article distributed under the Creative Commons Attribution License, which permits unrestricted use, distribution, and reproduction in any medium, provided the original work is properly cited.
Journal of Environmental and Social Sciences | Volume: 6, Issue: 1
Submission: 15/03/2019; Accepted: 02/05/2019; Published: 07/05/2019
Abstract
Understanding how environmental problems, including Climate Change (CC), are visualized by the public and the media is crucial to developing effective communications strategies aimed at encouraging mitigation and adaptation behaviors. In this study, we sought to understand how Canadians visualize CC, the affective response elicited by CC images, and what factors predict the representativeness of photographs depicting CC. A representative sample of Canadian adult Anglophones (n = 618) completed an online survey that assessed responses to CC imagery and corresponding affective content (PANAS). Measures of demographics, CC beliefs/knowledge, and environmental values (NEP) were also collected. Content analysis showed Canadians mainly associate CC with ice melt, temperature, pollution, and flooding imagery. Logistic regression showed that CC representativeness of several photos is predicted by pro-environmental values, belief in the causes of CC, and political affiliation. Images generally elicited negative affect, particularly those depicting anthropogenic causes of CC, where feelings of distress and upset were strong. Importantly, CC images identified by participants differ from those commonly used in the Canadian news media. These findings will aid communicators in optimizing the use of visuals in CC messaging, and offer some guidance for more effective communication within the challenging Canadian context.
Keywords:
Visual communication; Climate change; Communications; Environmental psychology; Perceptions
Abbreviations
CC: Climate Change; IAPS: International Affective Picture System; IPCC: Intergovernmental Panel on Climate Change; NEP: New Environmental Paradigm; PANAS: Positive and Negative Affect Schedule; UNFCCC: United Nations Framework Convention on Climate Change
Introduction
Impacts of Climate Change (CC) have been experienced around the world, and the importance of mitigation and adaptation strategies have been strongly emphasized over the past decade [1,2]. Concurrently, public perceptions of CC impacts have continued to shift over time (see systematic review by [3]). Due to CC, extreme weather events are occurring more frequently and having detrimental effects on both human and ecological systems [2,4,5]. In Canada, impacts from CC vary across the country due to the diverse geography. For example, Canada has seen increased frequency and severity of extreme weather events (such as flooding and droughts), reduced ice cover in the Arctic, forest loss due to wildfires and pests, and variation in the amount and availability of surface water [6]. Overall, Canada has experienced an increase in landmass temperature two times the global average between 1948 and 2012, while the north has experienced temperature increases two and a half times the global average since the 1940s [6].
Strategies for mitigating the impacts of CC at the national and provincial scales include integrated policies, financial incentives, taxes and fees, regulatory standards, and voluntary agreements [2]. Although these strategies are critical for CC mitigation and adaptation on a larger scale, it has also been argued that individual action is essential [3,7-10]. To elicit the necessary action, it is important to understand how CC is perceived and how information is currently communicated to the general public; this knowledge forms the foundation for improving the effectiveness of CC communications and messaging with respect to encouraging the necessary mitigation and adaptation behaviors.
Climate change communications
Although information and data on CC exist in large quantities, there are a number of concerns regarding how both the scientific and media communities present them. Environmental scientists, whom were some of the first to communicate on CC, do not always have experience writing information for the general public [11]. This can result in the presentation of information that is too complex for the general public to consume. On the other hand, environmental organizations and the media do not always have the scientific knowledge to support their claims [12]. These challenges have contributed to an overall confusion about CC amongst the general public as they receive differing messages about CC [13]. This is of particular concern, since the media plays an important role in sharing consumable, non-technical information on CC and environmental issues, and has become a main source of CC information for the general public [12].
With access to the Internet increasing rapidly in the past two decades, there has been a shift in the way that people consume information. Social media and news websites provide consumers with quick snapshots of information, often linking to longer stories, reports, or articles. In their book Media/Society: Industries, Images, and Audiences, Croteau and Hoynes highlight the relationship between media and society and the shift to electronic media and communications [14]. Pictures and videos (visuals) play an important role in this shift in communicating and receiving information [14]. The concept of using visuals as an information-medium and a behavior-alteration tool has long been studied in the marketing and communications literature (e.g. [15-20]). For example, from tourism research, images can influence consumers’ decision-making processes by helping them to shortcut processing the purchasing data [15,17,18], as well as positively or negatively influence consumers’ behavior and satisfaction [16]. Poor, et al. explored how images of other people eating can influence perceptions of taste [19], and Lang, et al. examined how individuals respond to images of alcohol [20].
Many of the methods and theories from communications and marketing research are applicable to CC communications research. Framing theory for example [21], has been used by many researchers in environmental and CC communications studies (e.g. [22-24]) allowing audiences to understand complex issues with more ease, and communicators to shape and tailor messages using words or images [25]. Visuals “help shape meaning partially because they convey a sense of reality, even though they are highly framed representations” [26, p. 493]. When communicating CC information, particular consideration must be given to how it is framed both verbally and visually [11]. For example, one of the most common framing strategies is to emphasize local impacts, or highlight the benefits of avoiding CC impacts [27].
Research on the use of visuals in CC communications is an emerging field, and most has been exploratory in nature focused on how CC is visualized by the public and the media [e.g. 28-34] National surveys in the UK [28], USA and Norway found that weather, melting ice, and heat were common mental images associated with CC by the general public [32,34]. In the USA, CC was also highly associated with alarmist imagery, and in Norway a greater focus on the social aspects of CC was reported. Several studies have focused on visual representations of CC in the media [29,31,33,35]. Notably, DiFransceco, et al. found a large disconnects between the text and accompanying images used in Canadian CC news stories [29]. A common theme across the aforementioned studies is that CC visuals are associated with negative affect. The relationship between the affect elicited by CC imagery and behavioral intent has been explored in more recent literature. Leviston, et al. reported that while CC impact photos elicited strong negative feelings [36], participants were still willing to respond to CC. Similarly, Chapman, et al. found that participants connected CC impact photos to CC, and that these images motivated them to take action [37]. Hart, et al. reported that images of actions and action stories increased the perception of efficacy to address climate change [38]. Other studies have found that CC solution photos can make people feel more empowered to take action, but reduce the perceived importance of the issue [33,39].
The case of Canada
Historically, the Canadian government has held differing positions on CC. In 1988, Prime Minister Brian Mulroney made a public commitment to reduce green-house gas emissions [40]. Following this, the Canadian government committed to several CC agreements, including ratifying the United Nations Framework Convention on Climate Change in 1992, ratifying the Kyoto Protocol in 2002, introducing the Clean Air Act in 2006, committing to the 2030 Agenda for Sustainable Development in 2015, and ratifying the Paris Agreement in 2016 [40,41]. In more recent years, the Conservative government of Stephen Harper formally withdrew from the Kyoto Protocol, eliminated and scaled back funding for national networks for climate science, released a Media Relations policy in the Ministry of Environment to stop scientists from directly communicating with the media, and funded some CC mitigation research, including projects on carbon capture and storage in the Alberta oil sands [40-42]. As our study was undertaken while the Harper government was in power, these events were potentially influential on public perceptions of CC in Canada. Perhaps most notably, the centralization of communications and control over messaging was not well received by scientists or the media. (For fuller details on the history of environmental politics in Canada, see [43-47]). This study also took place during a federal election year which meant that many of these issues were brought to light on different media platforms by opposing political parties. Public opinion, therefore, may have been influenced by such messaging.
Nationally, media coverage of CC has been integrated into the normal news cycle since the Kyoto Protocol, and since this time, policy making has been a dominant thematic frame in CC-related articles [48]. Stories on ecological events and scientific discoveries have decreased, while policy debates and coverage of proposed CC solutions have increased [49]. In addition to the diverse political history, Canada serves as a unique case as it has a large minority population of French Canadians, and the American news media is widely accessible to the general population. Young, et al. studied regional differences between the French and English media in Canada, and found that coverage of social justice is more prevalent in French CC stories [50]. Good undertook a content analysis of CC coverage in Canadian news, and showed that CC stories are more frequent and prominent in Canada than in the American media [51]. Ultimately our survey was only available in English, which meant that monolingual francophone Canadians were unable to participate. However, 10% of respondents were from Québec, and many Canadian francophones live in other areas of the country and have access to these media through television and the Internet.
Current study
To our knowledge, there are no prior reports in the peerreviewed literature on how a representative sample of Canadians visualizes CC, and this gap informs the current study. Using Canada as a case study, we seek to better understand CC visualisation by determining (i) what images represent CC, and how this varies with demographics, CC knowledge and beliefs, and environmental values, and (ii) the affective response elicited by CC imagery depicting causes and impacts. We also wished to better characterize the Canadian public with respect to their attitudes and beliefs around CC, and where they source their information. This information should be of value to communicators, policy makers, and educators in tailoring CC messages to diverse populations, and assist in communication strategies aimed at encouraging CC mitigation and adaptation behaviors amongst citizens.
Materials and Methods
Recruitment
An online survey (English language) was administered using the QualtricsTM survey platform (2015, Provo, Utah, US) in August and September of 2015. Ethics approval for this study was obtained from the Brock University Research Ethics Board (#14-320). Prior to the survey being administered, pilot testing was conducted using a convenience sample (n = 40) to test for clarity of questions and ease of software use. We sought to obtain a representative sample of the Canadian population through two recruitment drives; the first, a market research company (IPSOS; Cohort 1, n = 563), and the second through the Internet (Cohort 2, n = 120). For the former, the overall sample was selected based on its representativeness of the Canadian adult population for age, gender, region and education. Individual participants self-selected, but had to be 18 years of age or older and Canadian citizens in order to participate. For Cohort 2, adult individuals self-selected by responding to invitations to participate posted on social media, emails to individuals, and postings on the online research advertising website Call for Participants (https://www.callforparticipants.com). Additionally, posters were positioned around the Brock University campus, and participants in Cohort 2 were offered the chance to enter a prize draw for $200 cash.
Survey measures
The order of presentation of material in the survey was structured as follows: 1) CC images: open ended image identification; 2) CC images: photograph rankings; 3) CC knowledge and beliefs; 4) proenvironmental values; and 5) socio-demographics. The following sections expand on each of these, with the full survey available in the supplementary materials.
Climate change images: Open-ended image identification
The first question participants were asked was “when you hear the words ‘climate change,’ what is the first image that comes to mind?” [32,52]. This was an open-ended question, presented first to reduce any priming effects from other questions. Participants were then asked to give their impression of this response (‘very negative’, ‘somewhat negative’, ‘neutral’, ‘somewhat positive’, ‘very positive’) to capture the affective rating of the identified image [52].
Climate change images: Photograph rankings
Participants were also asked to rate a set of seven photographs (refer to Supplementary Materials 1) presented randomly for how much they thought each represented CC to them (1 = ‘not very well’, through to 7 = ‘very well’). The photographs were selected based on their representativeness of the impacts and causes of CC outlined by the Government of Canada in Canada’s sixth national report on climate change [6]. This report was chosen as a guideline for selecting Canada-relevant images depicting CC causes and impacts. It is a publicly available document, which outlines Canada’s greenhouse gas emissions, what actions are being undertaken to address CC, and climate-related support Canada provides to developing nations. The report is submitted biennially to the United Nations Framework Convention on Climate Change (UNFCCC).
The three impact photos were images of melting Arctic sea ice, flooding (as example of extreme weather), and a thermometer showing elevated temperature on a sunny day (as example of increased temperatures). The four cause photos consisted of three depicting human-induced causes (fossil fuel extraction, deforestation/land use change, and smokestacks [as an example of pollution/greenhouse gases]), and one depicting a natural cause (volcanic eruption). Stock photographs that represented these seven impacts and causes were purchased from BigStock Photo (http://www.bigstockphoto.com), and pilot testing with environmental researchers and members of the general public (n = 40) helped to confirm the photos represented the desired concepts. Seven photos was considered optimal with respect to representing a sufficiently diverse range of ‘iconic’ images related to the target concepts, while reducing the risk of participant fatigue and non-completion of the survey. Photo selection was also limited to those CC impacts and causes that could be clearly visualized.
After rating all of the photos for representativeness, participants then provided affect ratings on the Positive and Negative Affect Schedule (PANAS; [53]) for those photos scored 5, 6, or 7 for representativeness of CC. The PANAS scale is a widely used research tool for measuring affect or emotion, and captures responses to a list of words depicting emotions, such as (“when I look at this photo I feel:”) distressed, excited, guilty, and inspired. Each emotion is scored on a 5-point Likert scale (Not at all; A little; moderately; Quite a bit; extremely). Of the original 20 indicators, the terms jittery and active were removed after piloting to help reduce cognitive load/survey time, and the PANAS total score adjusted accordingly (range became 9-45). To capture a baseline of positive, negative and neutral affect ratings, and to ensure that the scale was being used correctly, three photographs from the International Affective Picture System (IAPS; [54]) were also included (photographs were of a mourning couple, a stool, and puppies). The IAPS is database of standardized photographs available to researchers to use for investigating emotions and attention [54].
Climate change knowledge and beliefs
Several questions aimed to measure participants’ CC knowledge and beliefs. First participants were asked “Have you heard or read anything about climate change?” (‘yes’, ‘no’, ‘unsure’; [55]). Respondents were then asked to identify all the sources they get their information about CC from (options: ‘books’, ‘environmental organizations’, ‘government’, ‘Internet’, ‘newspapers and magazines’, ‘radio’, ‘research reports’, ‘school/education’, ‘television’, ‘none’, or ‘other’). CC knowledge was assessed with the statement “On a scale of 1-10, how much do you know about climate change?” (1 = ‘I know very little’, through to 10 = ‘I know a great deal’). They were then asked, “How important is the issue of climate change to you personally?” (5-point Likert scale; [55]), and how they have been affected by CC (‘very positively’, ‘somewhat positively’, ‘unsure’, ‘somewhat negatively’, ‘very negatively’, ‘not at all’).
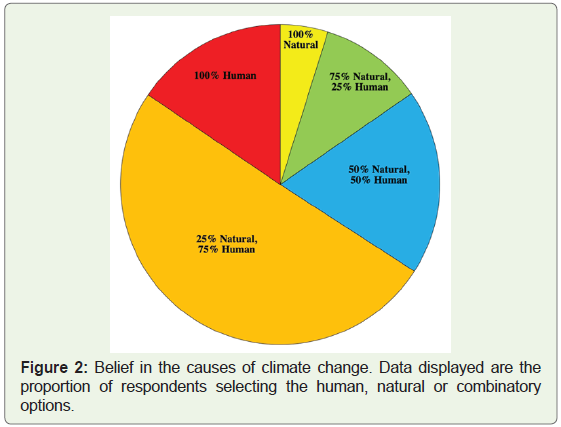
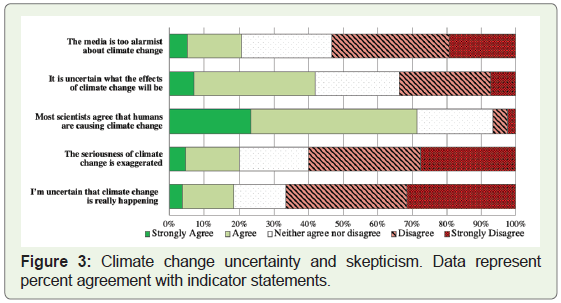
Belief in CC was assessed with the statement “Do you think the causes of climate change are ...”, with five response options presented as pie charts representing different degrees of anthropogenic v natural causes (natural 100%; natural 75% and human 25%; natural 50% and human 50%; natural 25% and human 75%; or human 100%). To measure uncertainty and skepticism, participants were asked to choose one response (5-point Likert scale) for each of the following statements: “I’m uncertain that climate change is really happening”; “The seriousness of climate change is exaggerated”; “Most scientists agree that humans are causing climate change”; “It is uncertain what the effects of climate change will be” and “The media is too alarmist about climate change” (adapted from [56,57]). We acknowledge that the understanding and expression of CC skepticism by the public is nuanced, and may encompass multiple constructs. The measures that we have used here are intended to capture what has been termed ‘epistemic skepticism’ [58].
Pro-environmental values and socio-demographics
Environmental values were assessed using the New Environmental Paradigm scale (NEP; [59]), as shortened and adapted by Whitmarsh [56]. Several socio-demographic indicators were also assessed, including age, sex, education attainment, environmental/science education attainment, location, household and individual income, political party affiliation, and religious affiliation. The majority of the response options for these questions were derived from Statistics Canada census data (refer to Supplementary Materials 2).
Data treatment and analysis: General approach
XLStat (version 2015.4.1, Addinsoft SARL, 28 West 27th Street, Suite 503, New York, NY, 10001) was used for analysis, and both qualitative and quantitative methods were utilized. Content analysis was applied to the open-ended CC image associations using the codebook of Leiserowitz [52]. The codebook was adapted for this study as some of the original categories were not applicable, and some new categories emerged; however any coding into new categories employed the same grounded coding theory. With the aim of capturing the most salient responses from participants, only the first response provided was used, even if more than one response was provided (n = 31). The original and adapted coding frameworks are given in Supplementary Material 3 [52]. Affect ratings were then summarized by category to understand the positive and negative emotion associated with each image group. NEP responses were recorded to numerical values (1-5), with reverse coding applied where necessary, and the mean NEP score calculated.
Logistic regression analysis was used to determine which independent factors influence the representativeness of the CC photographs. Photograph representativeness values were recorded as 1 (representative; scores 5-7) or 0 (not representative; scores 1-4). The independent variables included in the analyses were: 1) sociodemographic (age, sex, location, political affiliation, individual income and household income); 2) education and CC knowledge; and 3) CC beliefs (human vs. natural causes) and pro-environmental values (NEP scores). In some cases socio-demographic categorical responses were selected by only a small proportion of participants, so these were collapsed into fewer categories. Specifically, location data was grouped into Prairies and West Coast (British Columbia, Alberta, Saskatchewan, and Manitoba), Central (Ontario and Québec), and Atlantic (New Brunswick, Nova Scotia, Prince Edward Island, and Newfoundland). Age responses were collapsed into five categories: 18-29, 30-39, 40-49, 50-59, and 60-74 years. Bloc Québécois political affiliation responses were grouped into the other category. For the education categories, High School and Less than High School were collapsed into a High School or Less category, and University Master’s and University PhD into a University Graduate category. Errors terms for all mean values shown for summary and descriptive data are standard deviations unless otherwise stated.
Sample description
In total 683 adult Canadians completed the survey (563 from Cohort1 and 120 from Cohort 2). Of the 683 usable responses, 65 were removed because an insufficient number of questions were answered or because participants took less than four minutes to complete the survey. Based on socio-demographic characteristics, the sample is broadly representative of the Canadian population (full summary in Supplementary Materials 4) [60-62]. Significant differences exist (Stats Canada v our study) in representation from Ontario (38% v 53%) and Québec (24% v 10%), proportion of females (50% v 64%), and proportion of participants aged 18-24 yrs (18% v 11%).
Results
Climate change knowledge, beliefs and pro-environmental values
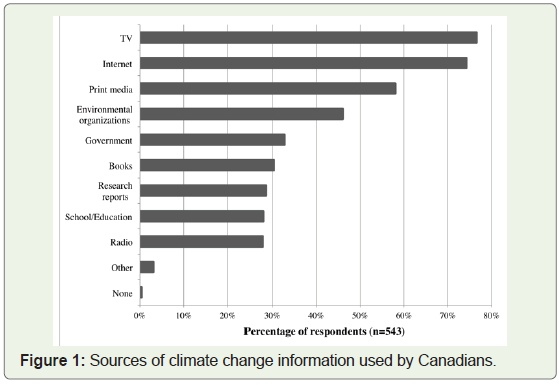
Knowledge: To the question “Have you heard or read anything about climate change?” 79% reported yes, 13% no, and 6% not sure. The sources used for information about climate change for participants who reported that they have heard or read about CC are summarized in Figure 1. More than half reported they acquire information from television (77%), the Internet (74%), and print media (58%), whereas research reports (29%), school/education (28%) and radio (28%) were the least common sources. Other sources were selected by 3% of participants, with journal articles, talks and seminars, friends, family, colleagues, neighbors, acquaintances, podcasts, Facebook, and changes in weather patterns reported. For the question “How much do you know about climate change?” (1 = very little, 10 = a great deal), the average response of 5.83 ± 1.95 represents an intermediate level of knowledge. 13% of participants reported low CC knowledge (responses 1-3), 68% an intermediate knowledge (responses 4-7), and 19% high knowledge (responses 8-10).
Beliefs and pro-environmental values: CC belief was assessed using three questions. First participants were asked “How important is the issue of CC to you personally?” A large majority of respondents felt that CC is personally important (85%), 6% felt that it is personally unimportant, and 9% felt that it was neither important nor unimportant. Participants were also asked how they have been affected by CC. A large proportion of the respondents were unsure if they have been affected by CC (42%), 35% believed they have been negatively impacted, 15% believed they have been positively impacted, and 8% believed they have not been impacted at all. Finally, participants were asked if they thought that the causes of CC are natural, human or a combination of both. The majority of respondents believed that the cause of CC is entirely anthropogenic (66%), 5% believed it is entirely due to natural causes, and the remainder believed it is a combination of both (Figure 2).
To gain a better understanding of perceived uncertainty and skepticism about CC, participants were presented with a series of five indicator statements and asked to record their level of agreement (1 = strongly disagree, 5 = strongly agree). Responses are summarized in Figure 3, and indicate that the sample had a relatively low level of skepticism, but was also uncertain on what the effects of CC will be. The overall pro-environmental values of participants were relatively high, with the average NEP score of 3.77 ± 0.73.
Climate change images
Open ended responses: Participants were first asked “When you hear the words ‘climate change,’ what is the first image that comes to mind?” Of the 30 image categories that emerged (Supplementary Materials 3), the top 12 categories captured 84% of responses, with ice melt (18%), weather (16%), global warming (12%), and nature (11%) being the most prevalent themes (Figure 4). Participants also rated the affect associated with their self-identified images. The mean affect rating was 1.96 ± 1.03, corresponding to the somewhat negative anchor term (value = 2). All image categories associated primarily with negative affect, with the pollution and dry/desert categories evoking 100% negative affect. In contrast, the nature category had the highest proportion of positive affect associated with it (26%) and evoked the lowest percentage of negative affect (50%).
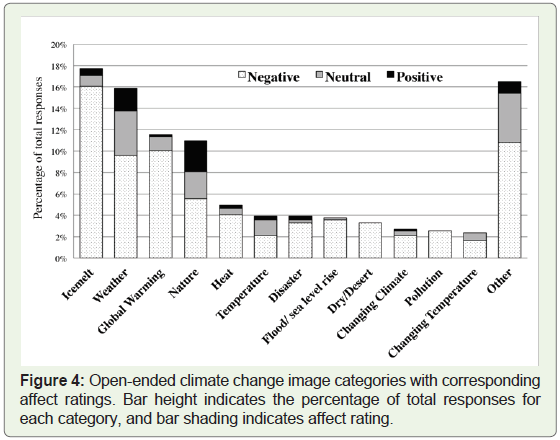
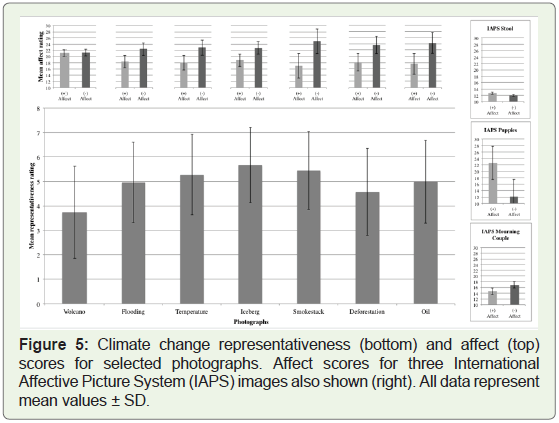
Photo representativeness: Respondents were asked to rate a series of photographs for how much each represents CC (1 = not very well, 7 = very well). The iceberg image ranked highest for representativeness (5.67 ± 1.54), and the volcano the lowest (3.74 ± 1.89) (Figure 5). Affective responses were also collected using the PANAS and are summarized in Figure 5. All of the CC photographs were associated with overall negative affect scores with the exception of the volcano, which was rated similarly for both negative and positive affect. The smokestack image had the highest negative affect rating and the lowest positive rating, as partly reflected in the highest response for the distressed, upset, irritable, and afraid emotion indicators (data not shown). Contrasting this, the volcano photograph had the highest positive affect rating, scoring highest for the strong, alert, inspired, and determined indicators (data not shown). Images depicting CC impacts and causes were scored similarly for both negative (22.13 ± 8.82 and 23.07 ± 8.97, respectively) and positive (18.10 ± 7.44 and 17.32 ± 7.77, respectively) affect when ratings were averaged across individual photographs. Affective responses to the three IAPS images were as expected (puppies = positive; mourning couple = negative; stool = neutral), and indicate participants were using the scale as intended.
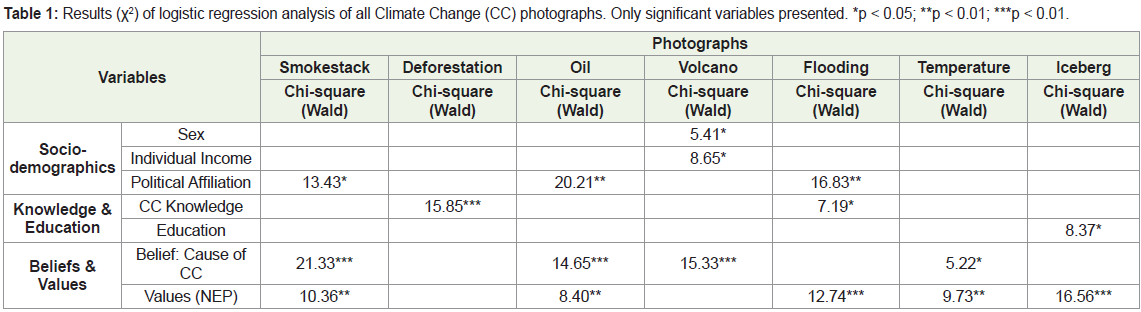
Predictors of representativeness: Logistic regression analysis was used to determine which independent variables influence the identification of representative CC photographs. Table 1 shows which factors were predictive of representativeness, while Table 2 breaks these findings down and gives the standardized coefficients for the significant variables. Overall, pro-environmental values were the most prevalent and one of the strongest positive predictors of representativeness, while beliefs surrounding the cause(s) of CC were also predictive for the smokestack, oil, volcano, and temperature images. Of the several socio-demographic factors examined, only sex (volcano), individual income (volcano), and political affiliation (smokestack, oil, and flooding) were significant.
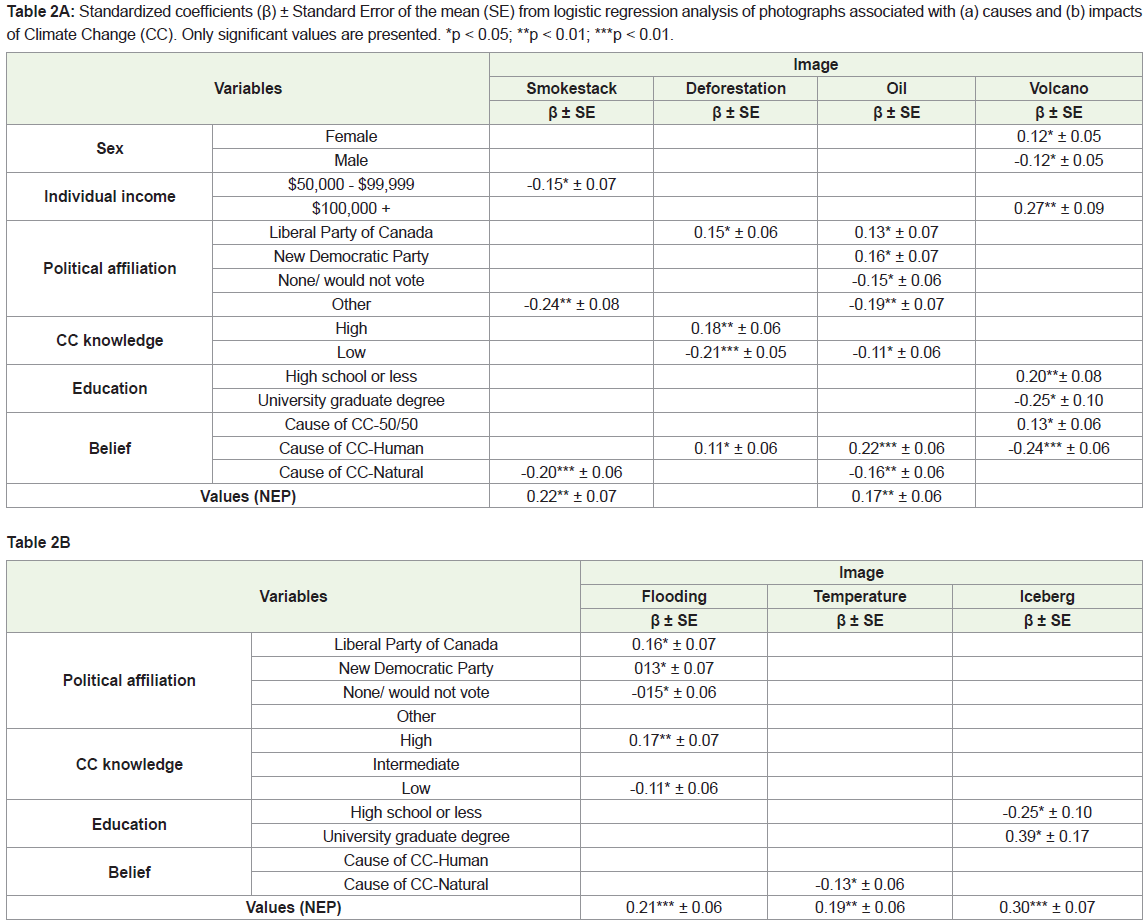
The smokestack image was the only one where representativeness was predicted by income. Specifically, participants who earned between $50,000 - $99,999 were less likely to rate this photograph more representative of CC than those in other income brackets. Association with the Liberal (deforestation, oil, flooding) and New Democratic (oil) parties predicted representativeness for several photographs. Participants who self-reported lower knowledge of CC rated the deforestation, oil and flooding images as less representative than other knowledge groups. While the representativeness of only two images was predicted by education level, they varied in direction. Specifically, individuals with an education at or below high school level rated the volcano photograph as more representative, whereas this was reversed for the iceberg photograph, where participants with a university graduate degree rated it as more representative of CC than those with an education at or below high school level. Participants with greater belief that CC is caused by natural factors rated the smokestack, oil and temperature photographs as less representative than did other belief groups.
Discussions and Conclusions
Where do people get their climate change information and what do they think about climate change?
Television, Internet and print media emerged as the top sources of CC knowledge, reinforcing the importance of understanding how Canadians visualize CC and the potentially powerful influence of images in affecting behavior in this domain. Overall, participants indicated a relatively high level of pro-environmental values, with NEP scores similar to those previously reported for Canadian adults [9]. We also found that Canadians are generally confident that CC is happening; believe that it is personally important, and that it is primarily caused by humans. These findings, and the reports that individuals with higher pro-environmental values are more likely to engage in pro-environmental behaviors [e.g. 65,66] suggest that Canadians may be willing to support mitigation and adaptation strategies.
Climate change images
Ice melt emerged as the most representative CC image in both the open-ended image identification and rated photographs. Temperature, pollution, flooding and weather were also common image themes. This is perhaps excepted, as Canada is perceived to be very cold and snowy, and Canadians are known to talk about the weather more than any other country in the world [67]. These general findings align with results from similar studies in the US and Norway [32,34]. Two differences, however, are noteworthy. Firstly, Americans increasingly associate global warming with more alarmists and naysaying images, whereas only 1% of responses to our openended question fit into the “skeptics” category. Secondly, Norwegians tend to have more of a focus on the social aspects of CC than the participants in our study (where social themes accounted for only 1% of responses), and US and UK cohorts [34]. While overall Canadians rated the CC cause photographs as more representative than those depicting impacts, whereas the only cause image that emerged in the top 12 categories in the open-ended image identification question was pollution (3% of respondents). The association of the term “climate change” with impacts rather than causes is not entirely unexpected, as a common strategy for CC communications is to emphasize impacts [27]; indeed, impact visuals are more frequently used in the news media [29,35]. However, the divergent finding in our CC representativeness photo ratings suggests that using CC cause images to accompany relevant articles should also be carefully considered. Two very useful resources for communicators, including media professionals and scientists, on using CC visuals effectively are Seven principles for visual climate change communication and Visualizing Climate Change [68]: A Guide to Visual Communication of Climate Change and Developing Local Solutions [69].
Our images were associated with a high level of negative emotion, consistent with previous research that has generally found negative affect associated with CC images [28-34,39,70]. Interestingly, a much higher level of negative emotion was recorded for photos depicting the three anthropogenic causes of CC compared to that showing a natural cause (volcano), which may be due to the relatively low representativeness of this image category. Overall, participants associated a higher level of negative emotion with CC cause photographs than with impact images. Feeling distressed and upset were the strongest emotions associated with the photographs of CC causes. Visuals can trigger a plethora of feelings and emotions, and can been used as a tool to influence behavior [71]. Presenting CC information that is overly negative or upsetting can make people become defensive and potentially less likely to engage in pro-environmental behaviors [72]. Given that these CC images elicit mainly negative emotions, communicators need to be wary in selecting visuals that promote the target pro-environmental behavior rather than simply reinforcing the negative aspects of CC impacts. This finding aligns with that of O’Neill, et al. who recommends using engaging rather than fear-based imagery [39].
A key finding of this research is that the open-ended images identified by participants differ from the CC images typically used by the Canadian news media [29,31]. Whereas participants mainly associated CC with more nature-based images, Canadian news media most frequently use images of people to accompany their CC stories [29]. Indeed, the images identified here more closely align with the CC images that are presented in non-Canadian media. For example, increased temperatures are amongst the most prevalent visual frames/images in the US media [26], melting ice, chimneys and factories in Spanish television news [73], and melting ice, flooding and polar bears in the UK [35]. This disconnect may cause confusion about CC amongst the Canadian public. The extent to which the disconnect may impact on how the information is received and engagement in pro-climate behavior remains to be determined.
Predictors
Participants who associate with political parties with left-ofcenter ideologies were more likely to identify the oil, deforestation and flooding photographs as representative of CC than were those of other political leanings. Conservative political affiliation in Canada has been previously associated with higher levels of CC skepticism and lower environmental concern [9], and Canadians with Liberal Party affiliation are more likely to develop environmental concern than those with Conservative political affiliation [74].
Self-reported CC knowledge, environmental values and CC beliefs all predicted the representativeness of some CC photographs. Low CC knowledge decreased the likelihood of identifying the deforestation, oil and flooding photographs, while higher pro-environmental values increased the likelihood of identifying the smokestack, oil, flooding, temperature and iceberg photographs as representative of CC. Belief in the anthropogenic versus natural origins of CC was also predictive for three cause and one impact photograph. Previous research has shown that CC knowledge, beliefs and pro-environmental values are also good predictors of pro-environmental behavior [65,74-80]. Both challenges and opportunities emerge from the finding that images vary significantly with several socio-demographic, knowledge and belief indicators in how well they represent CC for Canadians. An obvious challenge for communicators is that it is difficult to create a ‘one-size-fits-all’ message that will be effective nationally, which is further confounded when budgets may limit multiple iterations of articles or other media pieces for specific audiences. Nonetheless, optimizing the effectiveness of messaging by tailoring visuals to specific segments within Canada is possible. For instance, for CC communicators in Alberta, photos depicting oil, deforestation and flooding may best be avoided in favour of other images, as these are less representative of CC for Canadians who associate with rightwing political parties. (Alberta is a province that predominantly endorses conservative federal politics, as evidenced by the most recent election [81]). While the current study was being undertaken, Chapman, et al. were in the process of developing a public database of CC photographs based on the study of Corner, et al. (see http://climateoutreach.org/climatevisuals/) [37,68]. We recommend that Canadian researchers work with CC communicators to contribute relevant images to this database; the development of practical tools and resources such as this is important to enabling and encouraging the effective use of CC visuals.
Study limitations and recommendations
Although the sample was generally representative of the Canadian adult population, we acknowledge the overrepresentation from Ontario and female participants, and underrepresentation from Québec. Unfortunately, we did not have the resources to include a French version of the survey; however this could be considered in future studies. Additionally, self-reported measures of knowledge - as employed here -may not provide the most accurate measure of CC knowledge. Specifically, we recommend that future research consider the use of questions to test objective CC knowledge. For instance, the CC knowledge index used by Stoutenborough, et al. is based on responses to 6 domain-specific questions designed with the assistance of climate scientists and reports from the Intergovernmental Panel on Climate Change [82], with the authors concluding that it is a superior tool for assessing CC knowledge. An extension of this research is to explore the relationships between CC images and behavior; specifically, how CC images influence motivation toward engagement in pro-climate activities. We recommend more research on how CC is visualized in smaller Canadian communities and in vulnerable and marginalized communities such as people with disabilities, impoverished individuals, Indigenous peoples, and refugees, who may have different experiences and perceptions of CC. For instance, Canadian Inuit perceptions of CC develop from placebased knowledge of sea ice and personal interaction with local marine environments [83], which differ from other Canadian communities. These future research directions could build on existing work in British Columbia that uses 3D and 4D imaging to help people better understand the local impacts of CC [84-87].
Educators, the media, researchers and policy makers play a crucial role in developing easy-to-understand and factually correct communications materials for consumption by the general public. Each group should acknowledge each other’s strengths and work together to develop accurate and consumable information about CC. Visuals can be an important part of this; framing messages more clearly and effectively, helping people understand some of the more complex concepts, and assisting them in imagining future scenarios under CC [13]. Canada, with its broad geographical spread, wide range of projected CC impacts, and diverse ethnic, linguistic and political character, represents a challenging yet important case-study in CC communication. The results from this study provide important baseline information on CC perception and visualization amongst Canadians, which should assist in designing communication strategies for encouraging pro-climate behaviors.
Acknowledgements
The Council for Research in the Social Sciences and the Environmental Sustainability Research Centre, Brock University, are gratefully acknowledged for funding this research. We also thank Dr. Cheryl McCormick for her advice and support, Hannah Pickering for her valuable technical support, and Samantha Stea for her assistance (all from Brock University). The National Institute of Mental Health Center for Emotion and Attention at the University of Florida is thanked for access to photos from the International Affective Picture System (IAPS). Finally, thank you to all the individuals who were kind enough to participate in this study.
References
- Intergovernmental Panel on Climate Change (IPCC) (2007) Climate change 2007: Synthesis report. Contribution of Working Groups I, II and III to the fourth assessment report of the Intergovernmental Panel on Climate Change. Geneva: IPCC.
- Intergovernmental Panel on Climate Change (IPCC) (2014) Climate change 2014: Impacts, adaptation, and vulnerability. Part A: Global and sectoral aspects. Working Group II Contribution to the Fifth Assessment Report of the Intergovernmental Panel on Climate Change. Cambridge University Press, New York.
- Capstick S, Whitmarsh L, Poortinga W, Pidgeon N, Upham P (2015) International trends in public perceptions of climate change over the past quarter century. Wiley Interdiscip Rev Clim Change 6: 35-61.
- Hitz S, Smith J (2004) Estimating global impacts from climate change. Glob Environ Change 14: 201-218.
- Parry ML, Rosenzweig C, Iglesias A, Livermore M, Fischer G (2004) Effects of climate change on global food production under SRES emissions and socio-economic scenarios. Glob Environ Change 14: 53-67.
- Government of Canada (2014) Canada’s sixth national report on climate change.
- Adger WN, Arnell NW, Tompkins EL (2005) Successful adaptation to climate change across scales. Glob Environ Change 15: 77-86.
- Beechie TJ, Sear DA, Olden JD, Pess GR, Buffington JM, et al. (2010) Process-based principles for restoring river ecosystems. BioScience 60: 209-222.
- Pickering GJ (2015) Head in the (oil) sand? Climate change scepticism in Canada. J Environ Soc Sci 2: 1-11.
- Vasseur L, Pickering GJ (2015) Feeding the social animal: how to engage Canadians in climate change mitigation. In: Potvin C, Aitken S, Berkes F, Margolis L, Stoddart M (eds.) Acting on climate change: extending the dialogue among Canadians, 147-154.
- Moser SC (2010) Communicating climate change: History, challenges, process and future directions. Wiley Interdiscip Rev Clim Change 1: 31-53.
- Nickerson RS (2003) Psychology and environmental change. Lawrence Erlbaum Associates, Mahwah, NJ.
- O’Neill SJ, Hulme M (2009) An iconic approach for representing climate change. Glob Environ Change 19: 402-410.
- Croteau D, Hoynes W (2013) Media/Society: Industries, images, and audiences (5th edn.). Sage Publications, Thousand Oaks, CA, pp: 424.
- Kotler P, Gertner D (2002) Country as brand, product, and beyond: A place marketing and brand management perspective. J Brand Manag 9: 249-261.
- Lee TH (2009) A structural model to examine how destination image, attitude, and motivation affect the future behavior of tourists. Leisure Sci: An Interdisciplinary J 31: 215-236.
- Lee JS, Hsu LT, Han H, Kim Y (2010) Understanding how consumers view green hotels: How a hotel’s green image can influence behavioral intentions. J Sustain Tourism 18: 901-914.
- Wang CY, Hsu MK (2010) The relationships of destination image, satisfaction, and behavioral intentions: An integrated model. J Travel and Tourism Marketing 27: 829-843.
- Poor M, Duhachek A, Krishnan HS (2013) How images of other consumers influence subsequent taste perceptions. Journal of Marketing 77: 124-139.
- Lang A, Yegiyan N (2014) Mediated substance cues: Motivational reactivity and use influence responses to pictures of alcohol. J Health Commun 19: 1216-1231.
- Entman RM (1993) Framing: Towards clarification of a fractured paradigm. J Commun 43: 51-58.
- Newell BR, McDonald RI, Brewer M, Hayes BK (2014) The psychology of environmental decisions. Annu Rev Environ Resour 39: 443-467.
- Yeomans M, Herberich D (2014) An experimental test of the effect of negative social norms on energy-efficient investments. J Econ Behav Organ 108: 187-197.
- Stea S, Pickering GJ (2017) Optimizing messaging to reduce red meat consumption in Canada. Environ Commun.
- Spence A, Pidgeon N (2010) Framing and communicating climate change: The effects of distance and outcome frame manipulations. Glob Environ Change 20: 656-667.
- Rebich-Hespanha S, Rice RE, Montello DR, Retzloff S, Tien S, et al. (2015) Image themes and frames in US print news stories about climate change. Environ Commun 9: 491-519.
- Wiest SL, Raymond L, Clawson RA (2015) Framing, partisan predispositions, and public opinion on climate change. Glob Environ Change 31: 187-198.
- Lorenzoni I, Leiserowitz A, Doria MD, Poortinga W, Pidgeon NF (2006) Cross-national comparisons of image associations with global warming and climate change among laypeople in the United States of America and Great Britain. J Risk Res 9: 265-281.
- DiFrancesco DA, Young N (2010) Seeing climate change: the visual construction of global warming in Canadian national print media. Cult Geogr 18: 517-536.
- Hespanha SR (2011) Thematic and affective content in textual and visual communication about climate change: historical overview of mass media sources and empirical investigation of emotional responses. Santa Barbara, CA: University of California, pp: 568.
- Ahchong K, Dodds R (2012) Anthropogenic climate change coverage in two Canadians newspapers, the Toronto Star and the Globe and Mail, from 1988-2007. Environ Sci Policy 15: 48-59.
- Smith N, Leiserowitz A (2012) The rise of global warming skepticism: Exploring affective image associations in the United States over time. Risk Anal 32: 1021-1032.
- O’Neill SJ (2013) Image matters: Climate change imagery in US, UK and Australian newspapers. Geoforum 49: 10-19.
- Tvinnereim E, Fløttum K (2015) Explaining topic prevalence in answers to open-ended survey questions about climate change. Nature Climate Change 5: 744-747.
- Smith N, Joffe H (2009) Climate change in the British press: The role of the visual. J Risk Res 12: 647-663.
- Leviston Z, Price J, Bishop B (2014) Imagining climate change: The role of implicit associations and affective psychological distancing in climate change responses. Eur J Soc Psychol 5: 441-454.
- Chapman DA, Corner A, Webster R, Markowitz EM (2016) Climate visuals: A mixed methods investigation of public perceptions of climate images in three countries. Glob Environ Change 41: 172-182.
- Hart PS, Feldman L (2016) The impact of climate change-related imagery and text on public opinion and behavior change. Science Communication 38: 415-441.
- O’Neill S, Nicholson-Cole S (2009) “Fear Won’t Do It”: Promoting positive engagement with climate change through visual and iconic representations. Science Communication 30: 355-379.
- Young N, Coutinho A (2013) Government, anti-reflexivity, and the construction of public ignorance about climate change: Australia and Canada compared. Glob Environ Polit 13: 89-108.
- Office of the Auditor General of Canada (n.d.). A timeline of Canadian climate change commitments.
- Cuddy A (2010) Troubling evidence: The Harper government’s approach to climate science research in Canada.
- Hessing M, Howlett M, Summerville T (2005) Canadian natural resource and environmental policy: Political economy and public policy (2nd edn.). UBC Press, Toronto, Canada.
- Boyd DR (2012) The right to a healthy environment: Revitalizing Canada’s constitution. UBC Press, Toronto, Canada.
- MacDowell LS (2012) An environmental history of Canada. UBC Press, Toronto, Canada.
- Doern GB, Auld G, Stoney C (2015) Green-lite: Complexity in fifty years of Canadian environmental policy, governance and democracy. McGill-Queen’s University Press, pp: 422.
- Olive A (2015) The Canadian environment in political context. University of Toronto Press, Toronto, Canada.
- Stoddart MCJ, Haluza-Delay R, Tindall DB (2016) Canadian news media coverage of climate change: Historical trajectories, dominant frames, and international comparisons. Soc Nat Resour 29: 218-232.
- Young N, Dugas E (2011) Representations of climate change in Canadian national print media: The banalization of global warming. Canadian Review of Sociology 48: 1-22.
- Young N, Dugas E (2012) Comparing climate coverage in Canadian English- and French-language print media: Environmental values, media cultures, and the narration of global warming. Can J Sociol 37: 25-54.
- Good JE (2008) The framing of climate change in Canadian, American, and international newspapers: A media propaganda model analysis. Can J Commun 33: 233-255.
- Leiserowitz AA (2003) Global warming in the American mind: The roles of affect, imagery, and worldviews in risk perception, policy preferences and behavior. University of Oregon, Oregon.
- Watson D, Clark LA, Tellegen A (1988) Development and validation of brief measures of positive and negative affect: The PAANS scales. J Pers Soc Psychol 54: 1063-1070.
- Lang PJ, Bradley MM, Cuthbert BN (2008) International Affective Picture System (IAPS): Affective ratings of pictures and instruction manual. Technical Report A-8. Gainesville, University of Florida.
- Nisbet MC, Myers T (2007) The polls-trends: Twenty years of public opinion about global warming. Public Opin Q 71: 444-470.
- Whitmarsh L (2011) Scepticism and uncertainty about climate change: dimensions, determinants and change over time. Glob Environ Change 21: 690-700.
- Spence A, Poortinga W, Pidgeon N (2012) The psychological distance of climate change. Risk Anal 32: 957-972.
- Capstick SB, Pidgeon NF (2014) What is climate change scepticism? Examination of the concept using a mixed methods study of the UK public. Glob Environ Change 24: 389-401.
- Dunlap RE, Van Liere KD, Mertig AG, Jones RE (2000) Measuring endorsement of the New Ecological Paradigm: A revised NEP scale. J Soc Issues 56: 425-442.
- Statistics Canada (Stats Can) (2011) NHS profile, Canada, 2011.
- Statistics Canada (Stats Can) (2015a) Population by sex and age group.
- Statistics Canada (Stats Can) (2015b) Population by year, by province and territory (Number).
- Feldman L, Nisbet MC, Leiserowitz A, Maibach E (2010) The climate change generation? Survey analysis of the perceptions and beliefs of young Americans.
- Pew Research Center (2015) Climate change seen as a top global threat.
- Stern PC (2000) Toward a coherent theory of environmentally significant behaviour. J Soc Issues 56: 407-424.
- Steg L, van den Berg AE, de Groot JIM (2012) Environmental psychology: History, scope and methods. In Environmental psychology: An introduction. Wiley-Blackwell, pp: 1-11.
- Influence Communication (2014) 2014 report: Review of the news.
- Corner A, Webster R, Teriete C (2015) Climate visuals: Seven principles for visual climate change communication (based on international social research). Oxford: Climate Outreach.
- Sheppard SRJ (2012) Visualizing Climate Change. A guide to visual communication of climate change and developing local solutions. Routledge, London, pp: 514.
- O’Neill SJ, Boykoff M, Niemeyer S, Day SA (2009) On the use of imagery for climate change engagement. Glob Environ Change 23: 413-421.
- Sheppard SRJ (2005) Landscape visualization and climate change: The potential for influencing perceptions and behavior. Environ Sci Policy 8: 637-654.
- Nicholson-Cole SA (2005) Representing climate change futures: a critique on the use of images for visual communication. Comput Environ Urban Syst 29: 255-273.
- León B, Erviti MC (2013) Science in pictures: Visual representation of climate change in Spain’s television news. Public Underst Sci 24: 183-199.
- Zhou M (2013) A multidimensional analysis of public environmental concern in Canada. Can Rev Sociol 50: 453-481.
- Guiliani MV, Scopelliti M (2009) Empirical research in environmental psychology: Past, present, and future. J Environ Psychol 29: 375-386.
- Gifford R, Comeau LA (2011) Message framing influences perceived climate change competence, engagement, and behavioral intentions. Glob Environ Change 21: 1301-1307.
- Hirsh JB (2014) Environmental sustainability and national personality. J Environ Psychol 38: 233-240.
- Price JC, Walker IA, Boschetti F (2014) Measuring cultural values and beliefs about environment to identify their role in climate change responses. J Environ Psychol 37: 8-20.
- Schultz T, Fielding K (2014) The common in-group identity model enhances communication about recycled water. J Environ Psychol 40: 296-305.
- Devine-Wright P, Price J, Leviston Z (2015) My country or my planet? Exploring the influence of multiple place attachments and ideological beliefs upon climate change attitudes and opinions. Glob Environ Change 30: 68-79.
- Elections Canada (2017) Canada the 42nd parliament.
- Stoutenborough JW, Vedlitz A (2013) The effect of perceived and assessed knowledge of climate change on public policy concerns: An empirical comparison. Environ Sci Policy 37: 23-33.
- Laidler GJ (2006) Inuit and scientific perspectives on the relationship between sea ice and climate change: The ideal complement? Clim Change 78: 407-444.
- Burch S, Shaw A, Sheppard SRJ, Flanders D (2009) Climate change visualization: Using 3D imagery of local places to build capacity and inform policy. In: Neset T, Johansson J, Linnér BO (eds.), State of climate change visualization. (CSPR report No. 09:04). Centre for Climate Science and Policy Research.
- Sheppard SR, Cizek P (2009) The ethics of Google Earth: Crossing thresholds from spatial data to landscape visualization. J Environ Manage 90: 2102-2117.
- Cornish LM (2013) Can 4D visioning foster community responses on climate change? University of British Columbia.
- Sheppard SRJ, Shaw A, Flanders D, Burch S, Schroth O (2013) Bringing climate change science to the landscape level: Canadian experience in using landscape visualisation within participatory processes for community planning. In: Fu B, Jones K (eds.), Landscape Ecology for Sustainable Environment and Culture. Springer, pp: 121-143.